Listening to more data - Applying the DeLab method to questions form the listening session.

During the “Making sense of a COVID-19 world: applying collective intelligence to big data” webinar on the 3rd of June @kristof_gyodi and @Michal presented and discussed data science and their own method used at DeLa with us. They shared this interactive website full of valuable data relating to the COVID Crisis and how they gathered that data.

We had very interesting discussions on how to do and explain datascience, how to make citizens able to read datasets and visualisations and how else to use their methods.

@Alberto took the opportunity to put together a list of request for using the methods of DeLab for further exploration embracing the participatory research approach.

bellow you can find the ongoing conversation of how to use DeLabs methods further.

Feel free to also add questions of your own.

@kristof_gyodi I would be really curious to attempt this experiment with your dataset. Would you be up for trying a take onto Result 1? The words to look for (“solutionist” language):

solution, effective, efficient, real-time, scalable, rapid, advanced, compliant

Others? @eireann_leverett, @PhilBooth, @erik_lonroth, @CCS, @amelia, any suggestions?

1 Like

We are updating the Covid-19 presentation with new data - now we have news extending from 01.01.2020 until the 01.07.2020.

This is 57.5k unique terms: 37.8k have an increasing weekly frequency.

I checked the suggested terms - if they have an increase in frequency, and if yes, what is their position if we sort terms by the increase in frequency

The results:

solution:

474 solut
9719 accept_solut
13826 solut_group
14157 scalabl_solut
16294 endtoend_solut
17977 longterm_solut
19227 viabl_solut
22565 perfect_solut
24855 cloudbas_solut
26521 creativ_solut
28974 sharingsolut
34321 workabl_solut
36455 turnkey_solut

effective:

751 effect
3097 side_effect
3773 ineffect
4521 effect_vaccin
6970 effect_treatment
11612 costeffect_way
16603 effect_therapi
23163 effect_manner
24967 effect_manag
30020 effect_ban
34646 cost_effect

efficient:

829 effici
4642 ineffici
6133 power_effici
7625 energi_effici
15206 more_costeffici
28064 highereffici
30514 vehicleeffici
32896 resourceeffici
34280 improv_effici

real_time:

11790 real_time

scalable:

1382 scalabl
8901 scalabl_processor
9551 xeon_scalabl
14157 scalabl_solut
15466 high_scalabl

rapid:

8542 rapid_chang
11174 rapid_shift
12804 rapid_grow
13496 rapidflex
15650 rapid_increas
16968 rapid_expand
17227 rapid_respons
21559 rapid_deploy
35268 rapid_approach
37027 rapidrespons

advanced:

5071 advanc_baseless
7462 advanc_talk
11443 advanc_micro
11494 advanc_option
13885 more_advanc
15127 advanc_persist
21800 defend_advanc
22997 advanc_featur
23429 advanc_threat
25692 advanc_analyt
29487 superadvanc

compliant:

13032 ensur_complianc
13164 onlin_complianc
32915 compliancefocus
36044 hipaa_complianc

We will also check co-occurrences :slight_smile:

1 Like

Hey @kristof_gyodi I was wondering: did you get around to co-occurrence analysis in the end? No rush, of course!

1 Like

Yes, and here are the results :slight_smile:

We have found that the combination of the sentiment analysis and co-occurrence analysis provides more information. What we did in short:

  • selected different terms for the analysis, such as “effect” (terms are in root form, it can stand for effect or effective etc )

  • identified the co-occurring terms that are most frequently in the same article

  • calculated the sentiment scores for paragraphs that contain the analysed term (“effect”) and the co-occurring term

  • the sentiment scores can be interpreted as:
    – positive: > 0.05
    –neutral: > - 0.05 & < 0.05
    –negative < - 0.05

  • Finally, we sort the co-occurring terms based on the average sentiment score from most positive to most negative.

For each analysed term, the 10 most positive and 10 most negative will be shown below. The columns to pay attention are:

  • the co-occurring term
  • the average sentiment score
  • the number of paragraphs that contain both terms

It is important to note that sometimes the variance between sentiment scores are low and there are no negative scores.

The results:

solut

115 agil 0.292428 2415
108 kubernet 0.271692 1044
112 scalabl 0.267997 2733
105 workload 0.244434 2673
109 digit_transform 0.243253 4667
37 azur 0.234100 2193
102 workflow 0.230030 2968
116 sap 0.225665 1820
44 mac 0.217082 3104
27 collabor 0.213349 9998
54 hate 0.104241 1909
99 contacttrac 0.094482 1282
41 speech 0.086157 2442
52 tweet 0.084611 4222
60 moder 0.083985 2378
58 trump 0.060549 3640
55 polic 0.058068 4488
64 justic 0.052611 2153
51 civil 0.029812 1235
118 nithyananda -0.089585 113

effect

37 azur 0.229126 1676
3 chat 0.198213 6422
74 slack 0.193591 4244
27 collabor 0.192563 11582
17 architectur 0.191392 6040
44 mac 0.190547 4178
39 perspect 0.186990 7411
36 virtual 0.176136 13576
71 window_10 0.176131 2347
18 film 0.175904 4539
52 tweet 0.026164 9529
88 immun 0.025622 4115
93 sarscov2 0.022748 2372
56 disinform 0.020513 3737
98 hydroxychloroquin 0.019236 1364
58 trump 0.014557 10168
64 justic 0.011136 4491
55 polic 0.005596 8207
6 protest 0.001845 5882
86 conspiraci -0.066544 1686

effici

123 beta 0.268597 747
120 gpu 0.262380 873
109 digit_transform 0.261458 2573
110 vmware 0.254846 654
112 scalabl 0.250615 1629
102 workflow 0.249827 1744
63 api 0.246967 2160
122 crunch 0.245757 700
44 mac 0.237934 1189
39 perspect 0.234934 3218
66 black 0.138119 2154
58 trump 0.132191 1650
20 trace 0.130490 1697
121 indoor 0.130408 1331
62 blood 0.129597 927
41 speech 0.123830 1037
128 disinfect 0.122093 1028
73 mask 0.110900 1648
55 polic 0.073916 1937
52 tweet 0.060414 1369

real_time

181 np 0.367876 331
180 lyric 0.329951 102
166 snap 0.298800 591
74 slack 0.294608 1331
27 collabor 0.286358 1995
164 fluid 0.268798 498
37 azur 0.267434 230
63 api 0.263736 911
39 perspect 0.263198 1321
76 workforc 0.249945 953
174 clegg 0.032825 111
51 civil 0.025027 496
64 justic 0.019228 735
11 amend 0.014901 472
177 section_230 -0.015187 319
6 protest -0.015932 949
56 disinform -0.022727 742
173 watchdog -0.033630 558
86 conspiraci -0.033969 259
178 230 -0.112109 149

scalabl

152 hpc 0.379998 121
39 perspect 0.329352 697
102 workflow 0.329081 266
130 onpremis 0.326957 556
76 workforc 0.321901 498
109 digit_transform 0.311241 698
115 agil 0.310785 502
138 interconnect 0.305461 400
110 vmware 0.300487 331
124 cluster 0.297071 428
132 semiconductor 0.167003 202
97 contact_trace 0.166294 394
5 appl 0.164161 694
87 vaccin 0.162140 166
4 twitter 0.156674 786
33 april 0.152833 278
2 anonym 0.152284 367
113 proxim 0.151921 281
106 decentr 0.146176 173
146 enclav 0.055609 121

rapid_chang

109 digit_transform 0.398255 101
39 perspect 0.377123 133
272 mandatori 0.327904 126
27 collabor 0.326185 191
280 new_normal 0.293522 167
68 resili 0.292932 237
91 remot_work 0.288991 144
0 app 0.282973 170
125 boston 0.281343 136
279 salari 0.274830 120
96 covid19_pandem 0.155419 275
85 social_distanc 0.152995 190
23 particip 0.142780 119
89 pandem 0.138570 436
16 transit 0.134037 158
33 april 0.129989 149
95 coronavirus_pandem 0.106816 150
268 lay_off 0.076381 162
30 amid 0.061102 123
1 earlier_this 0.038643 127

advanc_option

0 app 0.146833 121
220 administr_templat 0.139412 108
215 comput_configur 0.139412 108
199 window_compon 0.139412 108
25 manual 0.106386 207
195 defer 0.101636 167
208 set_updat 0.097960 139
204 educ_edit 0.097960 139
71 window_10 0.095708 225
216 window_defend 0.089999 104
71 window_10 0.095708 225
216 window_defend 0.089999 104
205 instal_automat 0.089999 104
167 paus 0.088413 114
111 small_busi 0.083624 157
213 group_polici 0.082923 167
211 window_updat 0.082923 167
212 featur_updat 0.082923 167
227 version_2004 0.036226 104
231 deferr 0.036226 104

ensur_complian

78 guidelin 0.124666 123
97 contact_trace 0.118771 157
23 particip 0.110148 132
31 hire 0.110148 132
57 reopen 0.110148 132
68 resili 0.105191 120
34 freedom 0.101464 152
5 appl 0.099903 100
45 crisi 0.094613 197
20 trace 0.092249 120
94 covid19 0.081470 200
89 pandem 0.075501 177
311 onlin_platform 0.065915 113
313 selfregulatori 0.065915 113
79 lift 0.061370 106
0 app 0.049138 232
28 juli 0.035706 109
82 from_home 0.031856 117
76 workforc 0.020256 135
2 Likes

Whoa, this is not that easy to interpret. It feels like spotting shapes in the clouds :slight_smile: @amelia, @katejsim, @Leonie, is there anything you are seeing?

Re-upping this.

@kristof_gyodi, I was thinking we have a bit of a null problem here. It seems to be the curse of this sort of research. So, we see counts of co-occurrences. Do we have a reasonable way to assess if those counts are “normal” or “higher than normal”? The qualitative results do not resonate with the existence of co-occurrences (if the data are sufficiently big, they contain all possible co-occurences) but with their over-representation.

I am also curious to know if @amelia or @katejsim or @Leonie can see anything in your results – file under “experiments in epistemology”.

It would definitely be interesting to explore the overlaps between the SSNA (which is made from qualitatively coded data) and the DeLab results here (where terms are based upon existing words in articles).

Question for @kristof_gyodi – how did you select the terms for analysis? (e.g “ensur_complian”, “effic”)? The list is not a cluster (there are no relationships between the terms in the list, necessarily), it is just the terms that co-occur with that top term most frequently, correct?

There are a lot of similar codes that we could compare – and see if the clusters look different (ours is a network of co-occurrences, so a bit different). But I’ll show you some of ours and see if you think the comparative would be of interest.

Let’s look at your term “covid-19_pandem”

here’s where our COVID-19 code is in the co-occurrence network:
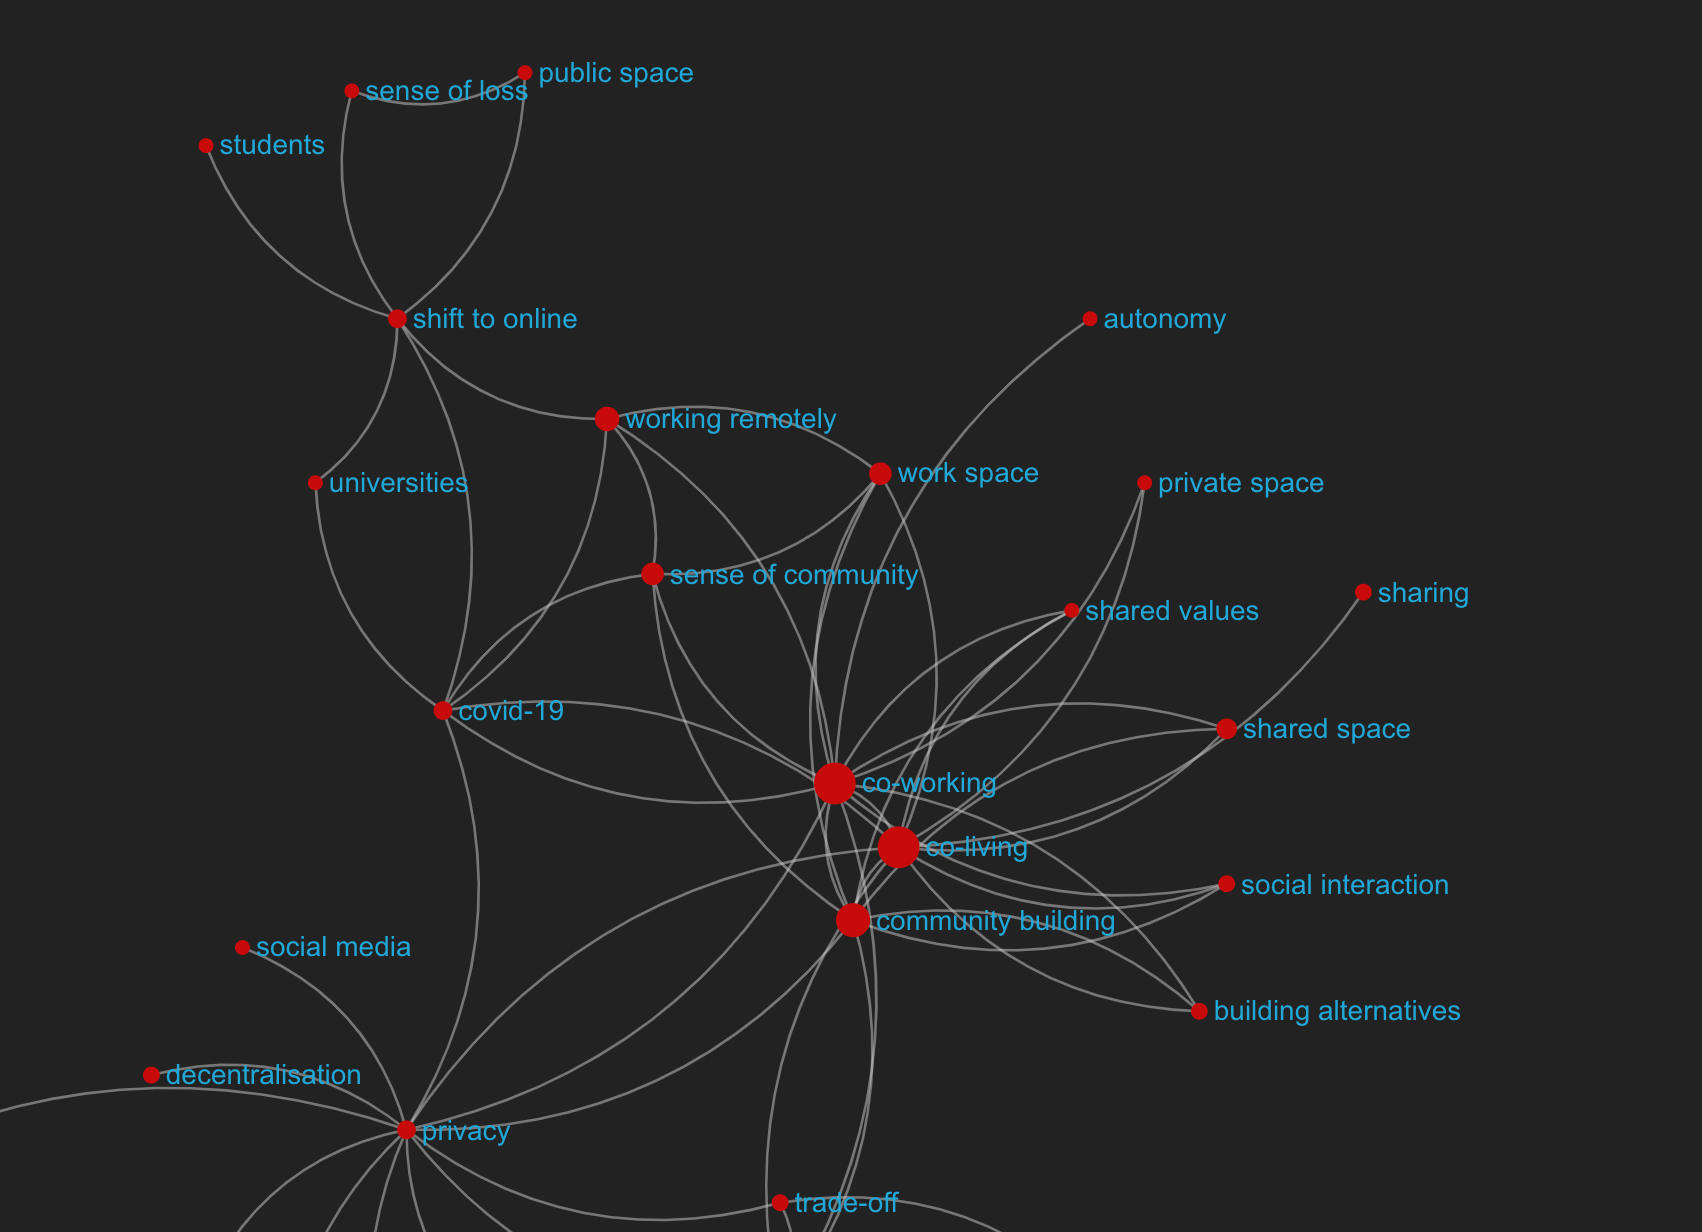
Screenshot 2020-10-20 at 11.42.03

and here it is in its own ego network, with lower-level co-occurrences filtered out, leaving only the codes that most frequently co-occur with COVID-19 (so, perhaps a better comparison to your data):
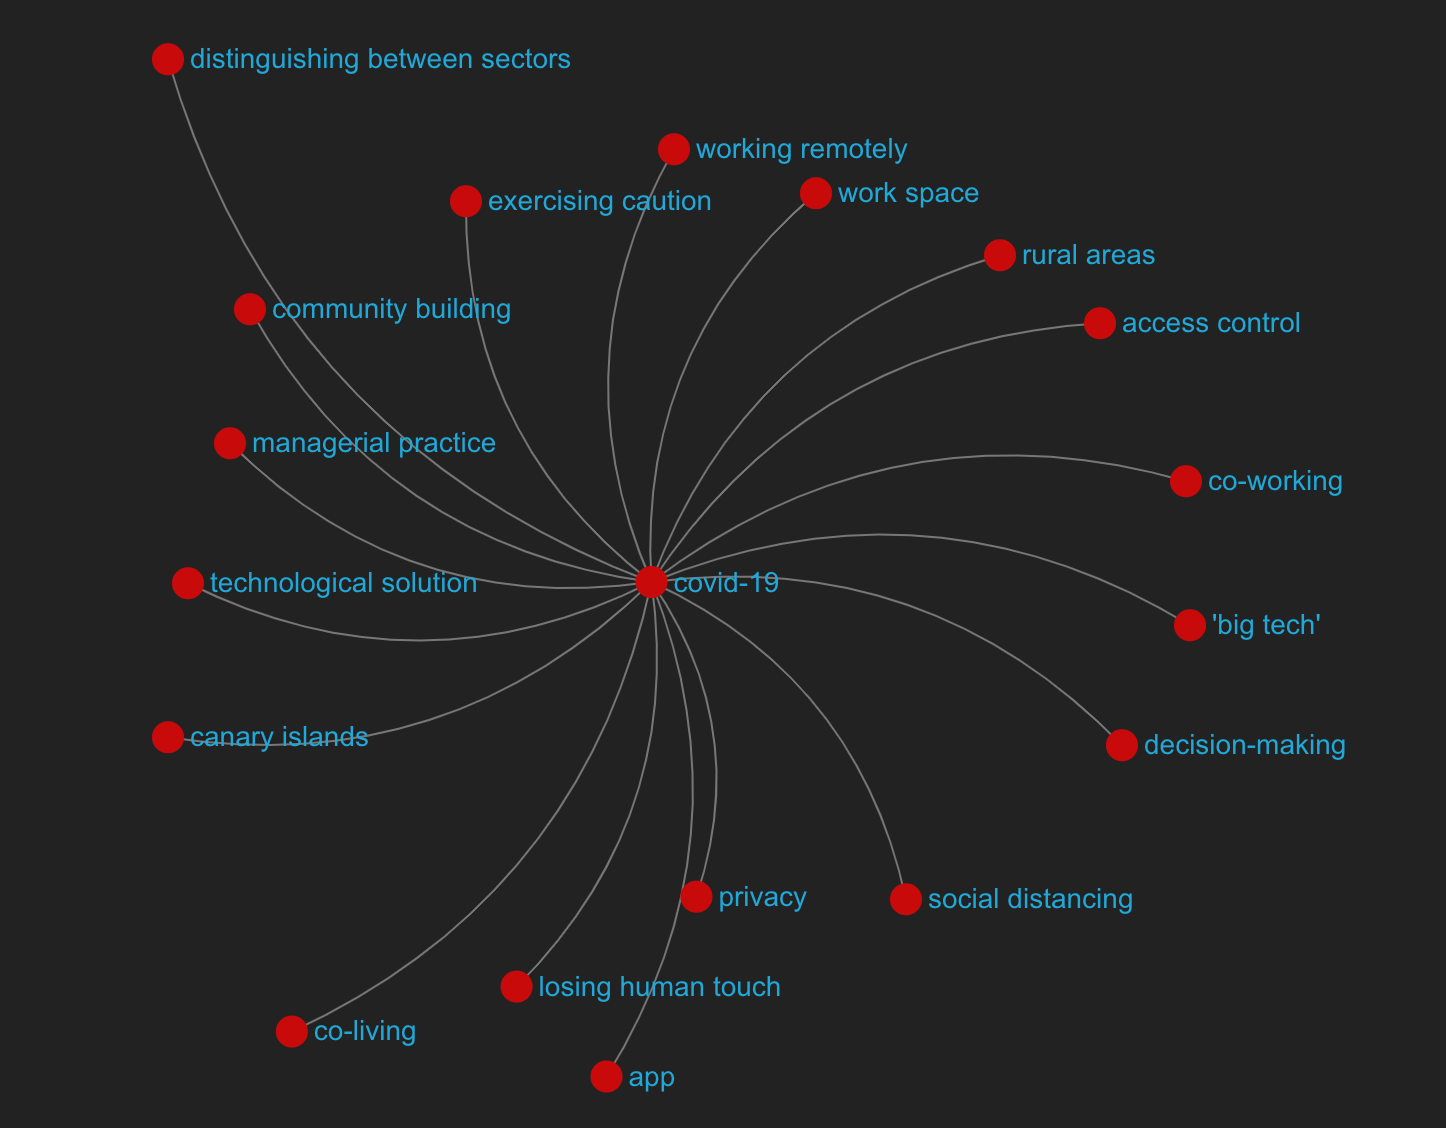
Screenshot 2020-10-20 at 11.44.24

When we look at the ego network, we can see some overlaps with your data:

  • social distancing, perhaps unsurprisingly. This concept is connected to social distance itself and its impacts – in the ego network, you can see codes like losing human touch and working remotely (and responses to the negative effects of those impacts, like co-working, co-living and community-building). These could relate to your term “particip”, potentially. I also am guessing that your term “earlier this” might refer to people making comparisons to how things were before the pandemic (though hard to say), which relates to the concept of “rapid_chang”.

Let’s turn to that one, “rapid_chang”. We have the code adapting to new circumstances, which is related. Here’s that ego network:
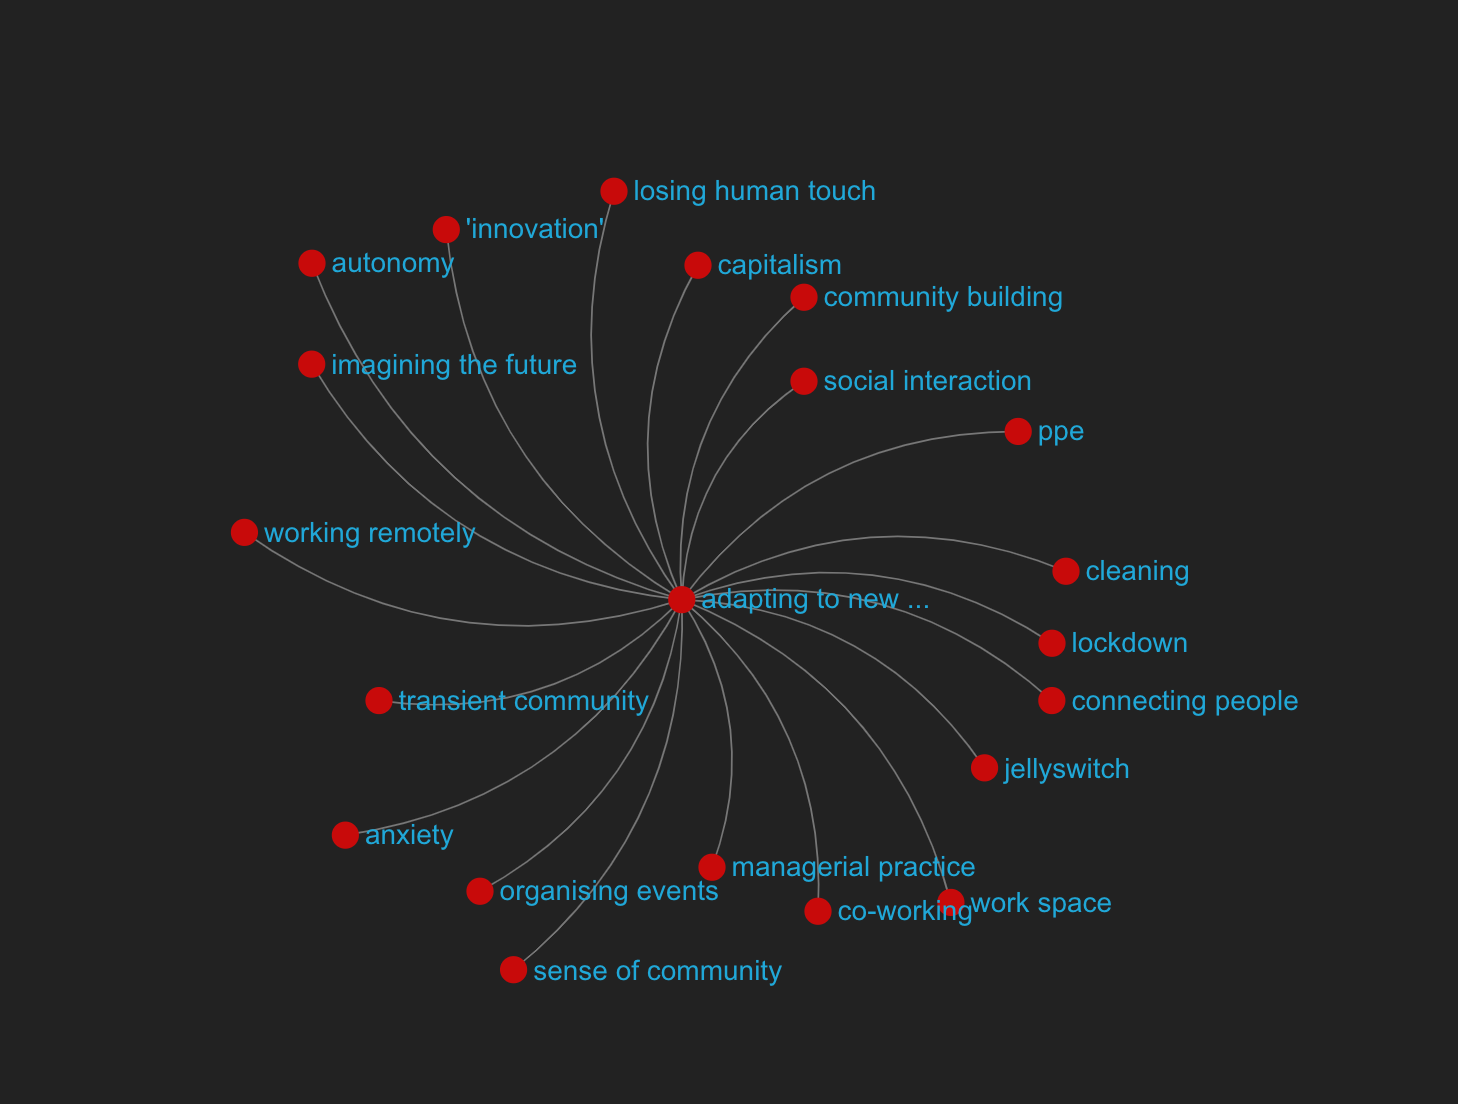
Screenshot 2020-10-20 at 11.54.58

I see overlaps here, too. “collabor”, I assume is related to collaboration, a response to rapid change. We have codes like connecting people, organising events, and community building (to create a sense of community) as ways of adapting to new circumstances(related to your “new normal”). resilience is a code we have as well, just outside of this co-occurrence level, that I know is increasing further as we are coding now (you can see anxiety in ours, too, so there is a sense of having to keep it together for increasing lengths of time in the face of uncertainty, another code).

We also have working remotely, like your “remot_work.” I imagine “mandatori” has to do something with the required safety measures like lockdown, ppe, and cleaning.

Your “rapid change” seems to refer to two things: the pace of technological change (digital transformation, app) and covid-19 related change. Heading back to the co-occurrence network, we can see these two kinds of change being discussed by our participants, too. imagining alternatives is connected to tech adaptation (not unlike your “digital transformation”) and app.

Uploading: Screenshot 2020-10-20 at 12.07.35.png…

I’m also interested to see what the addition of the sentiment analysis does, and see if the theory we have about negative/positive meaning usually being clear contextually bears out in practice when we compare (/if adding any element of sentiment analysis way down the road makes any sense for us – we talked about this at one Masters of Networks with @melancon and one of the LaBri students). If I recall correctly, when we saw the sentiment analysis his student did applied to one of the OpenCare threads, it didn’t accurately capture the nuance – but that was a different method of course.

Interested to see how we could make further comparisons going forward! I’d love to understand how you theorise why the co-occurrences exist (how you explain why terms are connected, from the perspective of the people making the connections, and explanation of the social phenomenon giving rise to them). I’m always interested in how to move from the co-occurrences to explaining what gave rise connections themselves/what story they tell.

@amelia, that was me. I used Result 1 of the Surveillance Pandemic listening session to generate a list of co-occurrences that I expected to find, given that that session had a broadly correct interpretation of the facts. and with that said, this is really great work. At the time, coding had not yet caught up with the conversation, so I made up that list based on participating in the session and reading the documentation carefully. But what you are doing is better, because you are now looking at the whole corpus, not just a small subset.

Do we have the start of a basis for a systematic comparison between DeLab’s text analysis and our own ethno analysis? Big question, I know…

Hum, can someone explain or give concrete examples what we can do with this in practice? Right now it just information with no form…

Here we have two dimensions - number of paragraphs that contain the two terms and the average sentiment of these paragraphs. We sort the co-occurring terms by sentiment, and not by number of paragraphs - there should be more frequent combinations in news than the ones presented. But: we only consider those terms that have an increase in frequency over time, hence all of them are trending terms. So: we capture trending terms that generate highest / lowest sentiment in pair with the analysed word, e.g. effect -azure (positive) and effect - conspiracy (negative). To answer your question, we rather see sentiment higher/lower than average, but not counts.

1 Like

Cool analysis! It is nice to see that the more “big picture” relationships that we capture from news are also visible in the conversations between actual users.

We usually calculate co-occurrences (e.g. for “solution - agile”: the number of occurrences of agile in articles containing solution divided by the number of occurrences of solution in all articles) and the analysis presented above that combines co-occurrences with sentiments. What would be interesting is to align our methods - e.g. calculate the sentiment of posts from the conversation and compare to news (we use this: GitHub - cjhutto/vaderSentiment: VADER Sentiment Analysis. VADER (Valence Aware Dictionary and sEntiment Reasoner) is a lexicon and rule-based sentiment analysis tool that is specifically attuned to sentiments expressed in social media, and works well on texts from other domains.). Or compare co-occurrences for same terms across the two datasets.

1 Like

Agree! One thing I could see being interesting in terms of combining our methods is the following: Using your method to determine what the most common co-occurrences and sentiments are for a particular news/information source (say, the Guardian, or even something like Breitbart) and compare those to the individual SSNAs of people who say they get their news/information from that source, or a composite of sources. I’d be really interested to know if the way that people interlink concepts and make sense of topics (like, say, COVID-19 pandemic) is affected by where they get their information.

@Jan, this could definitely be of interest to you in the context of POPREBEL.