Results of the DIY lab analysis of water contamination in Brussels

As it is officially one week since my workshop today, I have to give you the low down on the microbio results (lower your expectations, sorry!)!

5 Likes

thanks also to Nick and Winnie for getting lab stuff, including the pressure cooker autoclave, and to everyone for participating! at least we made the attempt, and E. coli was not in tap water samples… ciao for now!

4 Likes

@rachel I took the liberty of moving these results into their own topic, which will make finding them easier. :slight_smile:

1 Like

Ok, I am not sure I can interpret those results. What do columns mean exactly?

Also, about the “counting is not easy” part: how is it done? I would have thought:

  1. Count something (number of critters in a ml of water, or whatever) in the test sample (water from the fountain, for example). For statistics to work, you have to do this more than once! Suppose the average count is a.

  2. Count the same thing in the control sample (negative), again more than once. Suppose the average count is b.

  3. Run a t-test (technically a Welch test, I suppose?) on the null hypothesis that a = b. If the p-value is low enough, you reject the null and have found contamination.

But I see a number with its standard deviation, not a p-value, to the right of your sheet. How do I interpret that?

Thank you for the questions and comments.
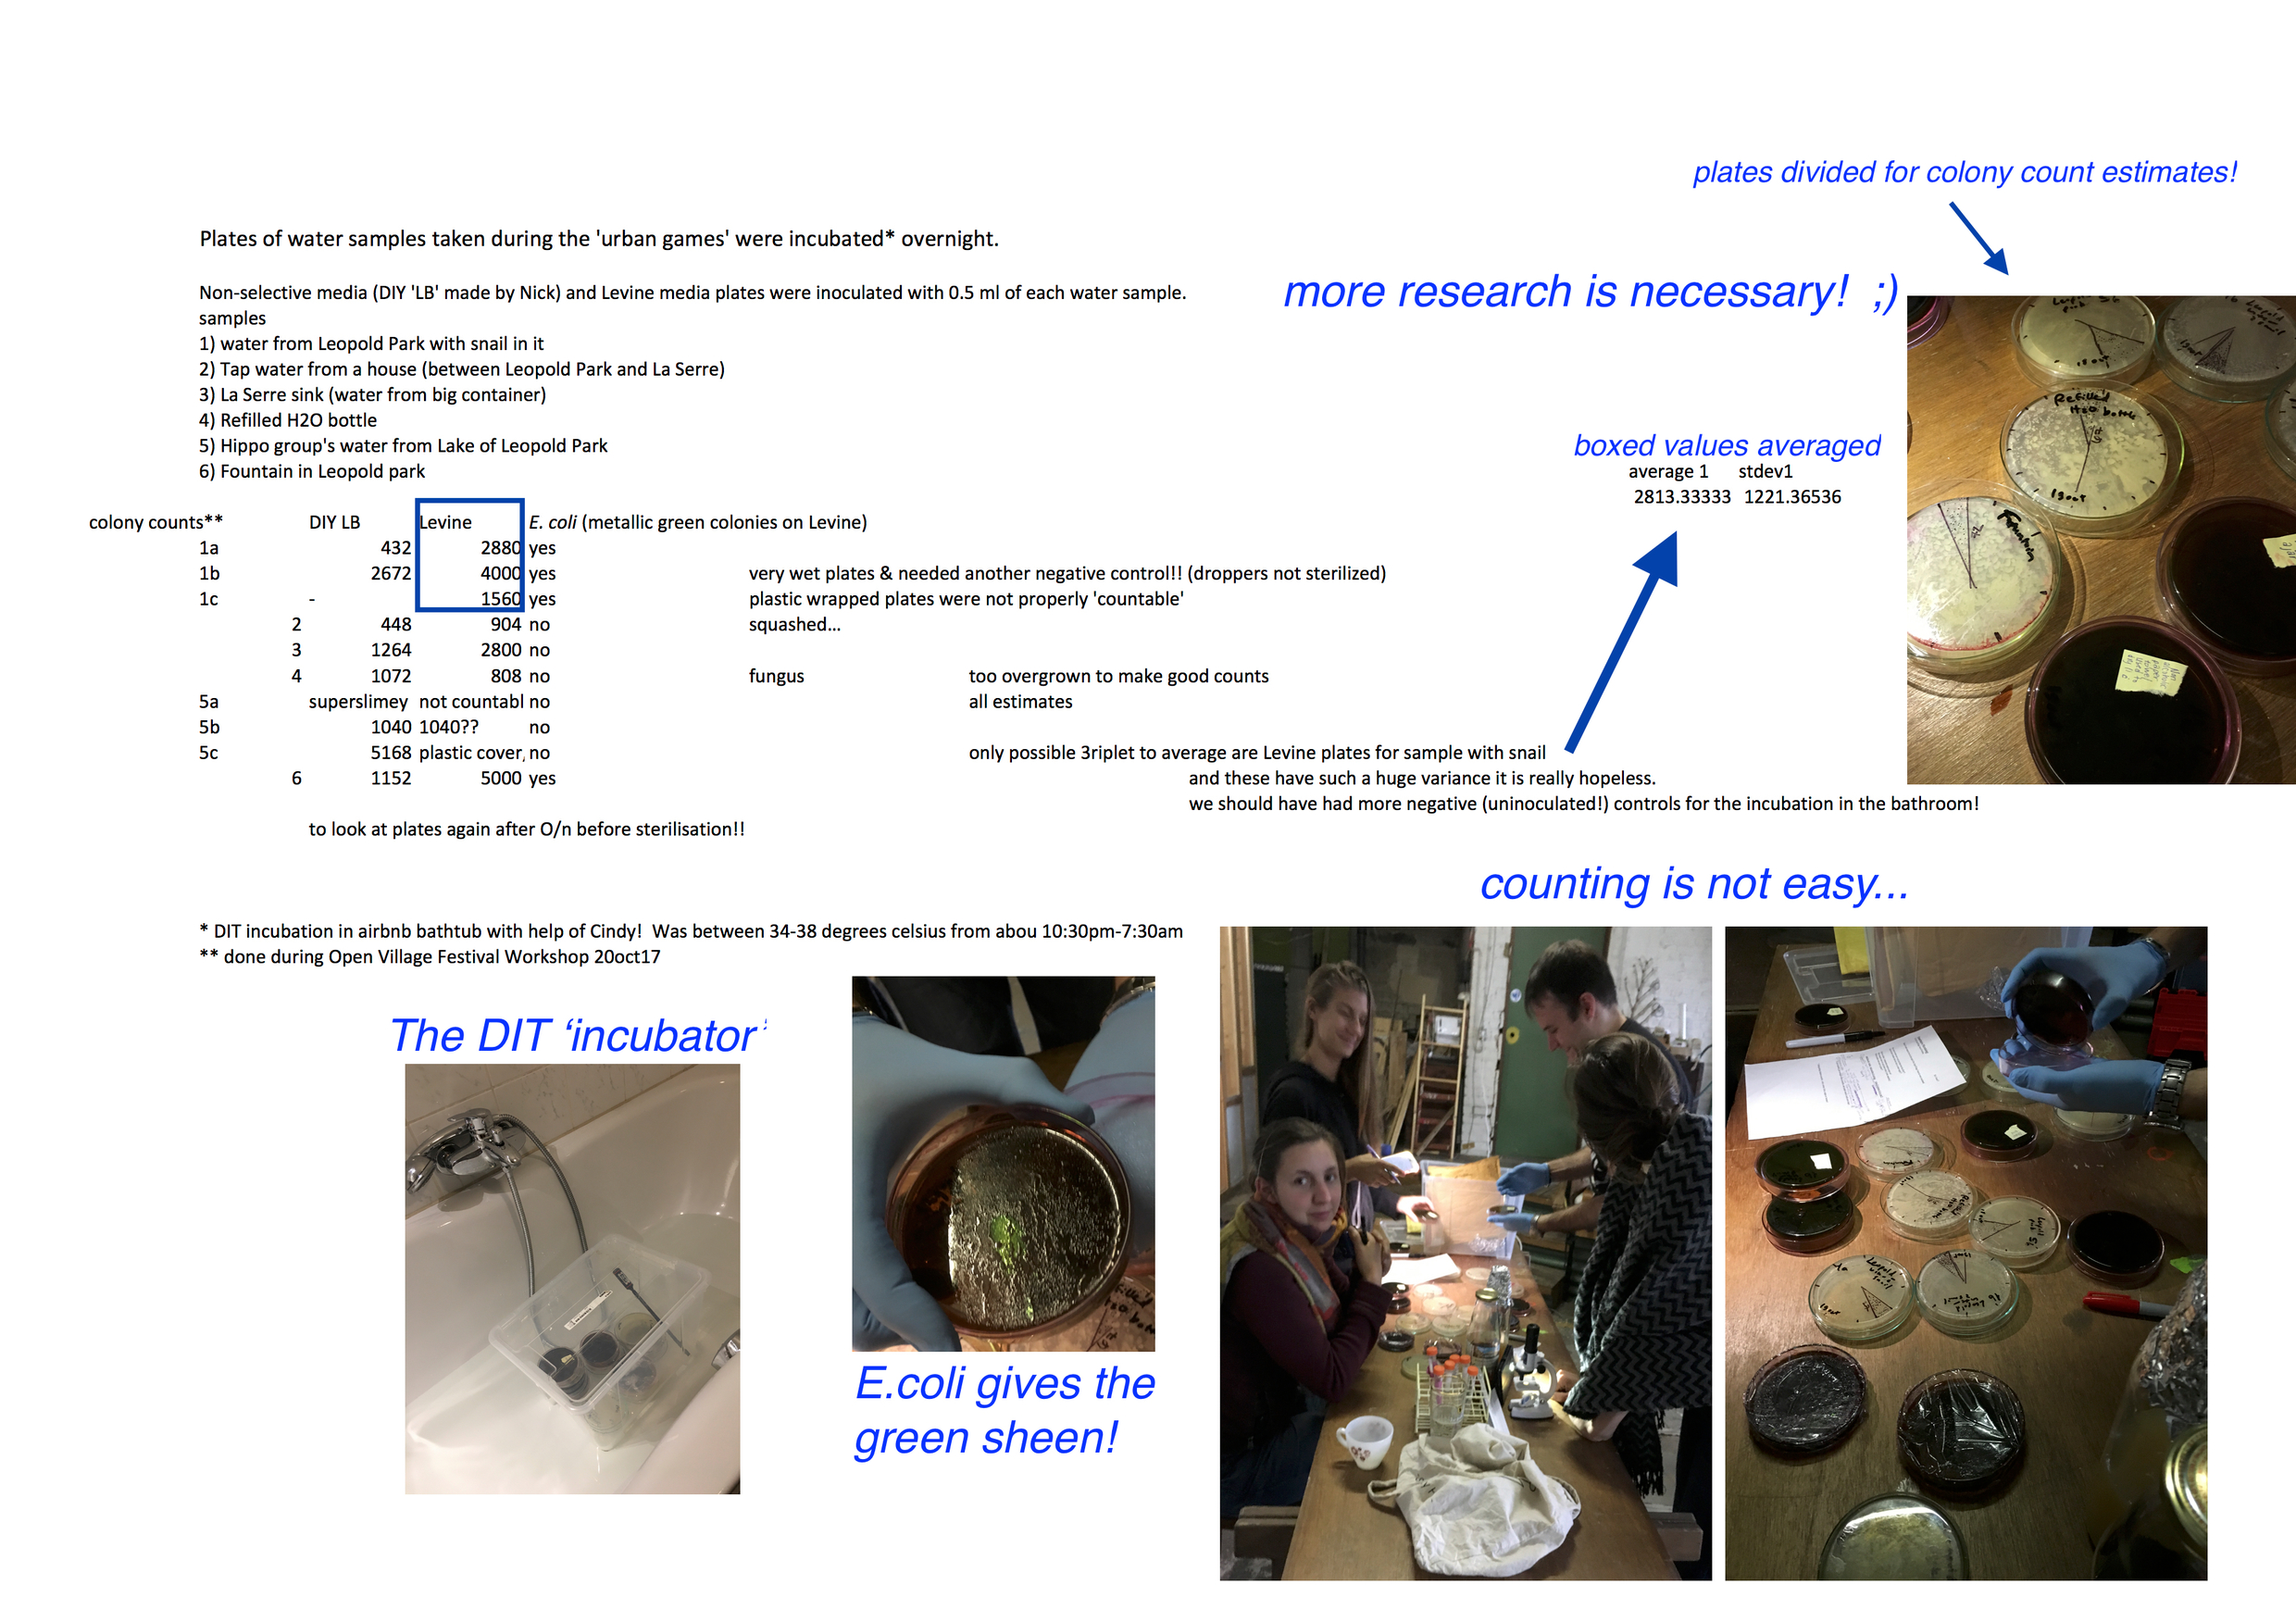
Indeed when ‘printing’ a page from excel it is always hard to interpret how the columns fit together with labels.
I will add a box or something to help clarify what is what and attach it next…

In terms of the hopes for reliable numbers from the plate counts a bit of background might help for people who did not make it to the presentation or at least see the prezi (which is open access here: Citizen Science by Rachel Aronoff).
Basically, for environmental microbial sampling, the rule is to take 3 independent samples from each site, then at the minimum you will have 3 plates to count colonies on (even better would be to have min 3 plates per sample). 0.5ml of water is put on each plate, spread over the surface (using sterile technique) then allowed to grow. (In the end all the values are calculated to know the average number of original cells in 100ml of a given sample.)
Then, the other important thing to grasp is that each microbial colony seen the next day on the plates (containing millions of cells after the overnight growth) represents of a single original cell from the sample, that has replicated in a certain spot of the plate - we call these ‘colony forming units’ because it is likely that there are lots of cells that actually don’t make colonies (because they don’t like the nutrients or the temperature or other parameters…). In fact the purple ‘Levine plates’ contain bile salts that prevent a whole class of abundant bacteria from growing (gram+ ones, if this means anything to you). This helps us look for ones of interest, esp our ‘bioindicator’ for untreated sewage, E. coli, which allows us to think that tons of other unknown things (enteroviruses, micropollutants) are also probably in the sampled water.
Of course, very importantly, one can’t just sample without comparing to something or another, and generally there is always a positive control (here in Switzerland, we have used river water or even sometimes toilet water - I still meant to talk with the other Alberto more about how rivers are full of bugs… :slight_smile: sadly…) and a negative control, ordinarily tap water.
Finally, you need to have confidence that your plates themselves are not going to just randomly have lots of things growing - an uninoculated control! This was something we really lacked last week! With the plates just freshly poured at La Serre, there were many possibilities for sources of contam, like the droppers we used to inoculate the plates with the water samples. Finally, the plates normally should have some time to lose excess water, otherwise the colonies can be smeary and very hard to distinguish one from another…
One other variable is the treatment of the sample. Ordinarily the rule is, after sampling, the tube must be kept in the cold and plated within 5 hours. Our tubes, perhaps, were not entirely sterile, and they were just carried around and left until we did the plating after dinner…
Ask more questions if this is not clear.
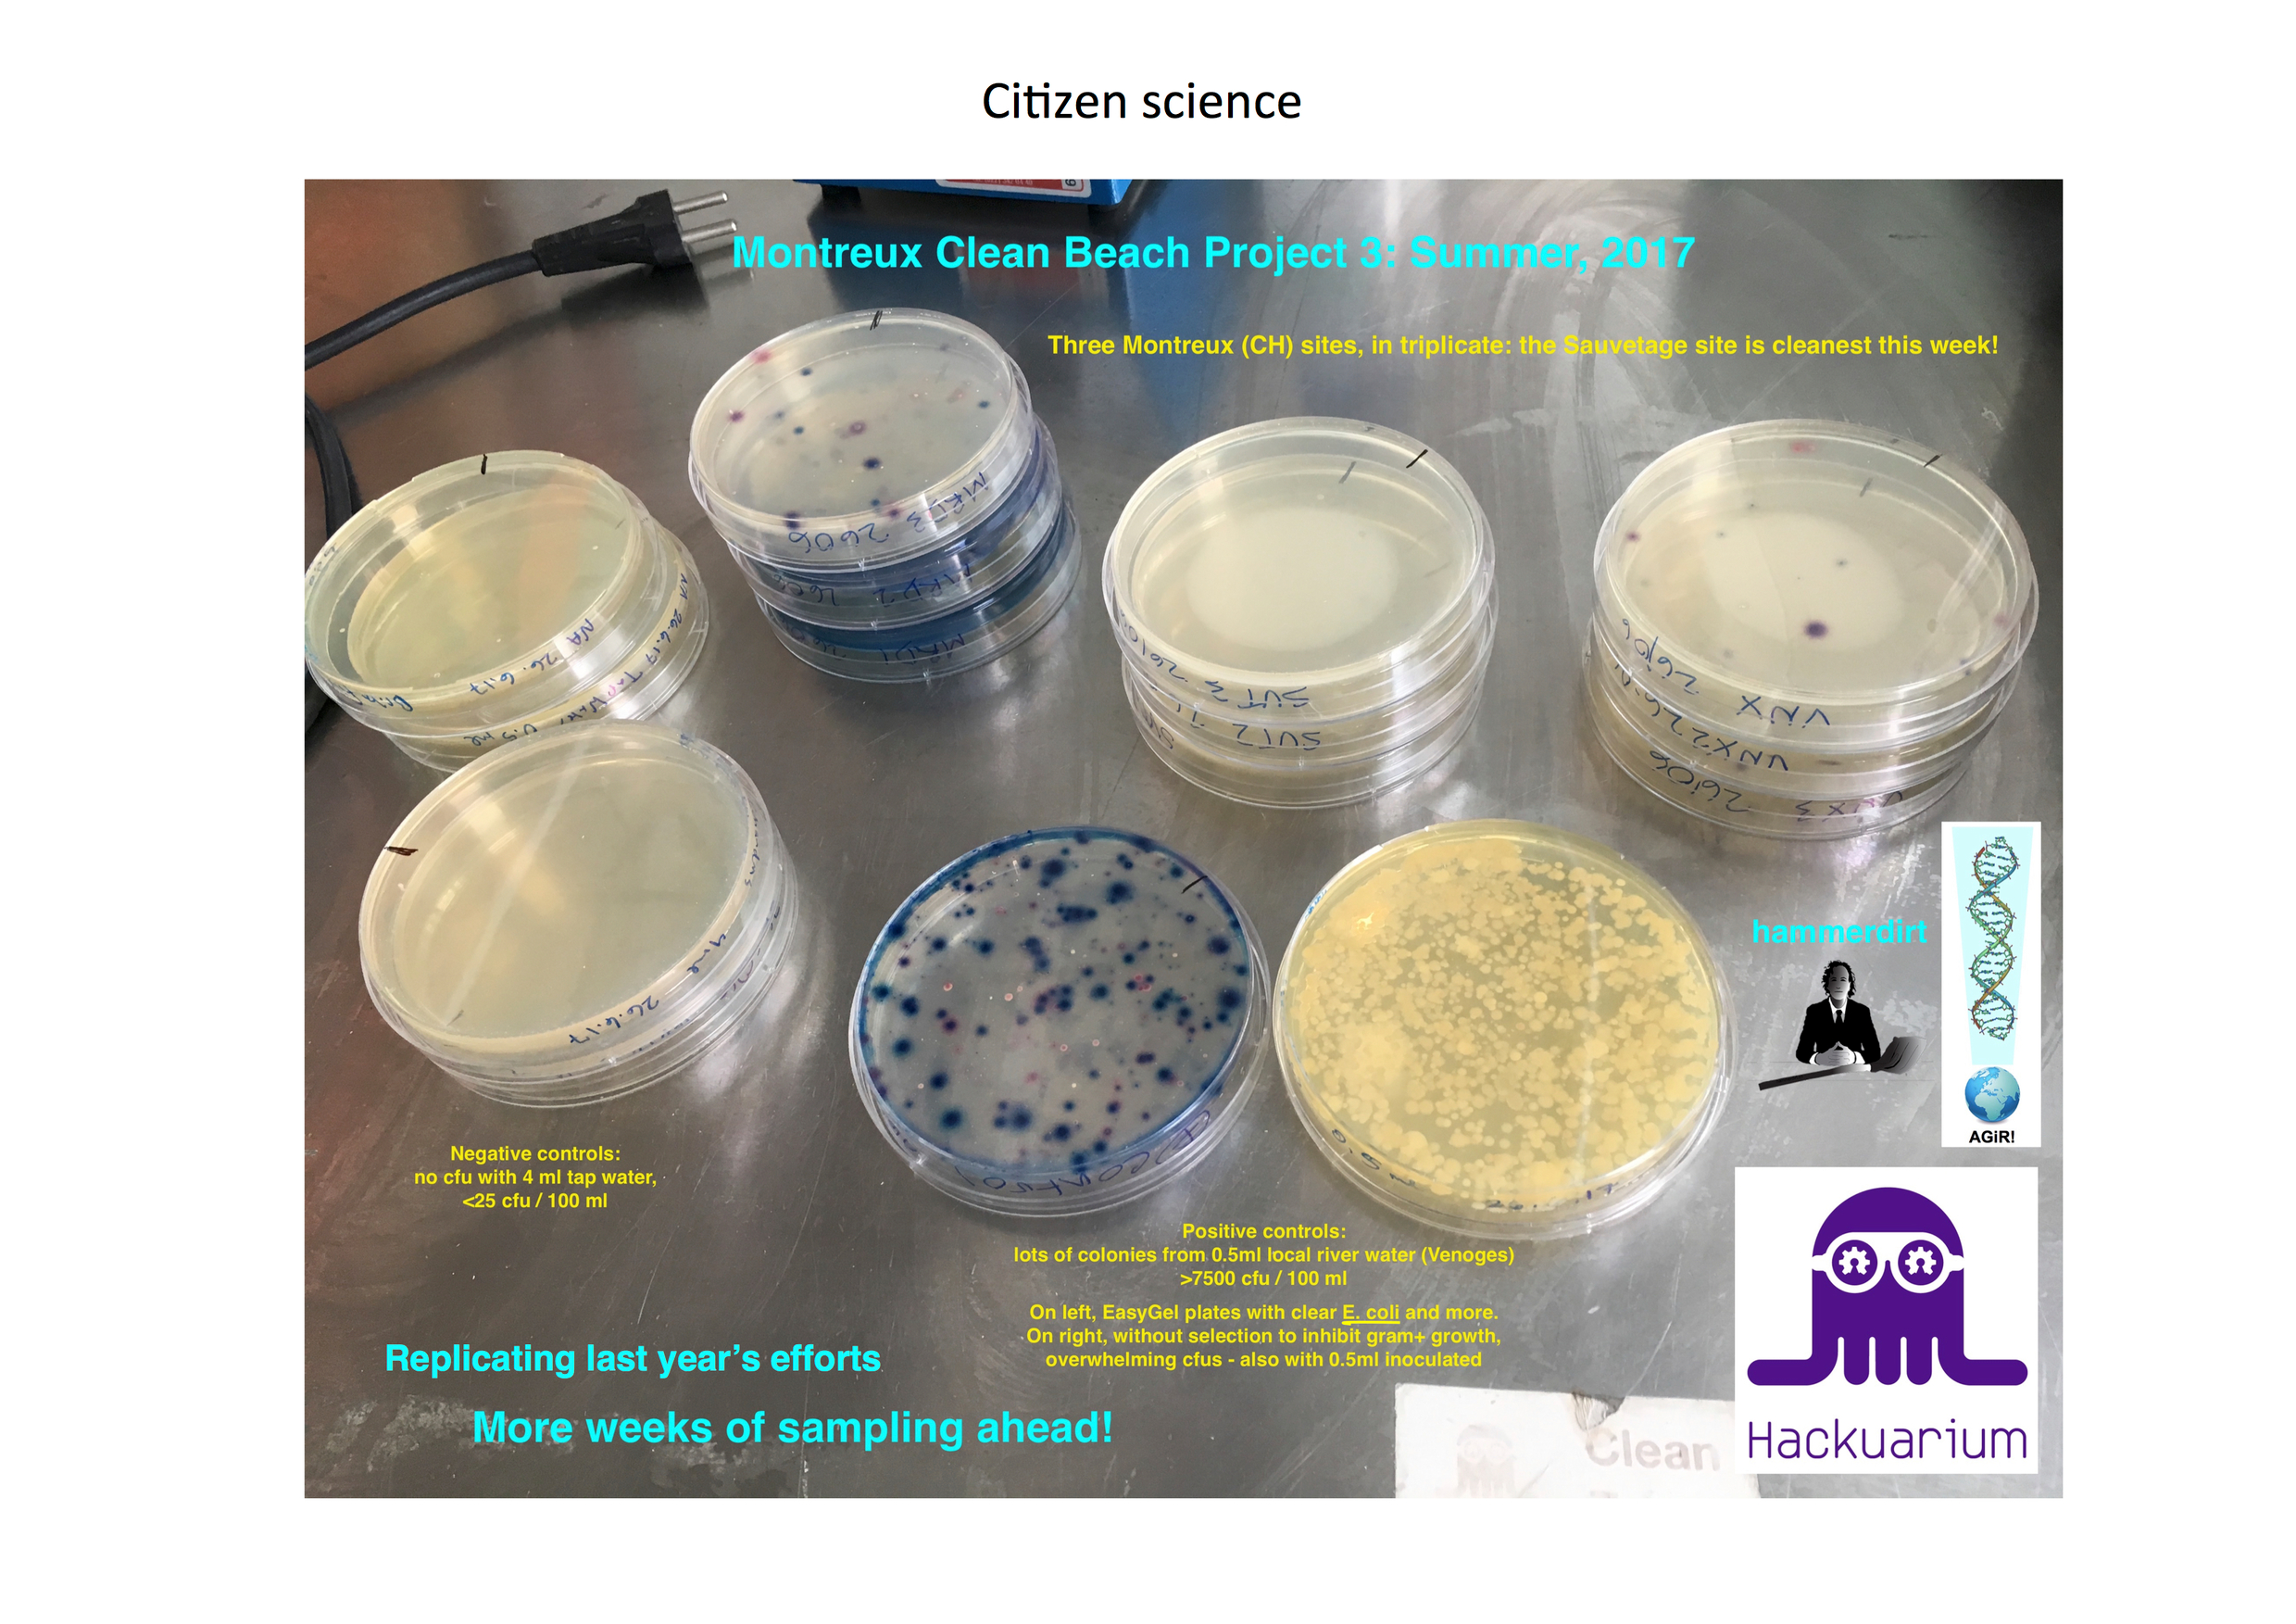
I will put an image up showing a collection of plates from one of our sampling days this last summer. (we had another special plate, termed ‘chromogenic’ that allows one to distinguish at least 4 kinds of bacteria, and even a fluorescent substrate that confirms E.coli - pics of this are in the prezi…)
Then, as you say, we ultimately want counts that give numbers that we can use for statistical tests, like the T-test…
For these tests though, you need at least 3 samples averaged to compare.
However, we only had one set of 3 plates with counts, and their variance was so high, not much could be said, esp without an average of 3 from controls to compare against!

Counting more than once is another good option, and we could have attempted that - actually we still could using some pictures! But, because of the problem of the negative controls full of colonies (but at least not E. coli), we would still have a very difficult time drawing meaningful conclusions. The crazy incubation in the bathtub also meant that the plates were not only super smeary, but a couple only had saran wrap as a cover, and got squashed! Also one could imagine bacteria floating on water droplets to cause all our negative controls to have so many colonies (if it wasn’t the droppers we used or the tubes we collected the samples in, which were left at RT too long…)!

Quantitative biology is coming of age now, I should note - tons of old papers that relied on stats p<0.05 are now realised to be completely underpowered and with non-reliable conclusions.

I am happy you asked some probing questions!
Have a great Sunday!!

Here is an example of plates from one week’s sampling last summer.
The positive controls have lots of colonies, the negative controls almost none, and the regional samples (from Lake Geneva around Montreux Bay) have varying amounts. To note, 0.5ml was put on the positive controls, and unknowns here had 4ml per plate inoculated. Again, in the end you make the numbers per 100ml (as in Alberto Rey’s Bagmati graphics…)!

Here is the summary I made already, with a few extra things:

4 Likes

Aurelian’s image number 2 shows real counts in a plate sector in progress, btw…

:blush:

colonies from la serre sink!!

(am I just replying to myself here, or do you see this, Alberto (and others?)?)

Great summary and explanations @rachel ! Thanks :slight_smile: This should serve as a good addendum to anyone wanting to try this again on their water. I know we will do it here locally!

I recently met someone working at the Flemish water governing body who wants to set up a citizen science project in her spare time. There’s not much room to do meaningful change inside the government, since in Belgium it’s quite a mess: multiple governing bodies, bureaucracy, strict rules, all land is taken and blocked.

It would be more than bacterial sampling, also bio indexing, inspecting river banks, turbidity, metals, … How much experience do you have with doing those DIY? Ping @albertorey

1 Like

could be fun to do more!! we’ve also done pool kit things for nitrates/sulfates etc, and I had two years of students doing the biotic index stuff on the banks of a river… (forms were posted in one part of this domain before…)

Sorry, @rachel, I still don’t get it (ignore me if I’m being too thick). You have described the many methodological challenges to obtain “well sampled” samples. Great. I also understood you are counting the number of bacteria per 100 ml of water. But I do not understand how you would count thousands of critters swimming around in a drop of water. Do you take a picture and then process the picture somehow?

And finally: your printout shows p-values. That means probabilities. But probabilities of what?

Hi, Alberto! You aren’t ‘thick’ in my opinion, and obviously I should be able to make a more coherent story for you (all). Indeed with the microbio ‘plating’ methods, we only can count the bugs that grow under the given conditions of nutrients and temperature and oxygen and pH etc… This is why we try to talk about ‘colony forming units’ in the stricter analyses. Never are we able to get a number of everything that was in our original water sample… Another project from Hackuarium, the Water Drop DNA project (that has the ‘explorer’ Mike Horn as a sponsor!) does try to find out all the things in a water sample -through DNA analyses - but that method doesn’t give a real number of how many of each bug is represented in the sample (and can also include things that aren’t even alive!) !
I don’t think, however, that there are any p-value probabilities on the sheet. Just the counts (usually gross estimates) and one average and standard deviation (that shows the variance) for the one sampling site for which we had 3 plates…
However, I will try attach a graph that shows 95%-iles for some similar analyses…
It is very worth talking about this though, because what the probability shows is only valid in comparison to the controls. You start out with the so called ‘null hypothesis’ (i.e. there is no difference in bacterial abundance between sampling sites and tap water) and if the P value when you compare the averages is very low, that means you can reject this null hypothesis, and say there is indeed a significant difference in bacterial abundance between sampling sites from these data.
So from the example graph, that I need to upload next, where these 95%iles all overlap, there is no significant difference in bacterial abundance, but (usually the rule of thumb is that significant diffs should be at least 2standard deviations away from each other - we can talk about normal error bars another time, if you want! :wink: ) the parts with a big peak not overlapping with others does differ significantly - at least statistically.
Which leads me to the next point:
The really crazy thing that is hard for people to grasp is that, even if your p<<0.01, there would still be a 1% chance that the difference you observed with your data is simply due to chance.
yep.
This is why there is a re-thinking of many old data based only on p=0.05 with low n numbers (this is why using 5 plates would be better than 3 plates, too, if you can manage it, to provide a concrete example of how to try to get around these problems).
This is also why really using the ‘control data’ is important!
In our case, we can ask, for instance, how many times does the tap water give no bacteria? In fact, we were basically really screwed because we had tons of colonies even from the tap water samples, and should have included non-inoculated plates in the DIY (box in the bathtub!) incubation! :joy:
There is a great quote I will find about this to include too!
ok, got, it - I actually took it from George Elliot’s book Daniel Deronda, but says that in Aristotle’s ‘poetics’ he wrote (also quoting someone else!):
''This too is probable, according to that saying of Agathon: ‘It is a part of probability that many improbable things will happen.’ ‘’

Just to re-iterate in terms of probabilities: the P value shows the probability that what you observe could have happened simply due to chance. If P values are low enough, you are allowed to reject that null hypothesis and say there does seem to be a real difference between the different samples. However, there is still another important issue: this whole exercise never ‘proves’ anything, in the way you can have some mathematical proof, or the way the media says - this study proves xyz!
never!
In fact, the true scientific method can only ‘disprove’ something (i.e. to say, these are not the same!)!
& a new experiment with better controls and more statistical power can sometimes turn all beliefs upside down.
I love the idea that in the last decade so many things are being realised as quite important - microbes are part of us (10^14 of them vs 10^13 of ‘ourselves’), our neurons aren’t forever and ‘baby’ ones come into our brains from stem cells, DNA is repaired (but better to avoid damage, still) - these are just 3 things that are game changers.
I started my serious academic work, working with retroviruses, that showed that an old dogma of molecular biology (DNA->RNA->protein) is wrong - RNA->DNA too! And now with microRNAs, and more (RNA helping repair DNA), the RNA life hypothesis isn’t just for explaining evolution, but is an important current thing in all living cells - crucial in my ideas about dynamic genomic integrity.
But I will try to get back to the point (though I could go on and on, and would love to hear other’s ideas and thoughts!!)!
I am sorry that because of our weak data, with smears and few replicates, we can’t say there is a real difference in bacterial populations from our water sampling!
Still, nonetheless, I am convinced that we had one good result - no E.coli observed in the tap water samples - so little likelihood that raw sewage was there, unlike for the Leopold park samples…
hip hip hooray! ?? :confounded:
I got a little deeper into statistics a couple of years ago in a MOOC course, and know that we would all benefit from more awareness of these issues.

Hope you have a great weekend!

2 Likes

I enjoy reading your explanations @rachel :slight_smile: I hope to delve into the topic a bit more myself soon as a water citizen science group starts here in Ghent!

1 Like

Yes, sorry: what I meant is that you have no p-values, so I don’t know how to read the stats. I get it now: if the standard deviation is more than twice the mean of the bug count, the bug count is not significantly (“significantly” => 0.05) different from zero. Gotcha, thanks!

actually for this case, we know the counts on those three plates are very much different from zero, particularly as the green shiny e.coli colonies grew.
those bugs were not, again, found in ‘tap’ water samples…
however, as we don’t have any comparison from the other samples that can be used for real stats, since in no other case did we have at least 3 plates to count, we can’t make much of a conclusion at all…
& indeed, having the standard deviation turn out to be more than twice the average count for the three plates that were ‘scored’ gives us little confidence in the only average value already!

the take-home is that we have to plan well and proceed correctly to be able to draw conclusions from citizen science.

hoping to help more people realise this and encouraging them to do more too!
:slight_smile:

I saw you did some water analyses recently. How did they go??

1 Like

It went well @rachel ! We did some analysis for E. coli and coliforms using Levine’s. We found a lot of them in some places of our city water doing tests in DIY context.

We still need to discuss some next steps, but doing the tests in a rigorous way again in those places is probably up next. There was a lot of worry from more classical scientists that we shouldn’t “claim” things from our analysis, citing of course the quality of our work. The opposition seems more ideological than practical though. But we’re looking to dispell that.

What’s your experience with claiming certain results?, have you done it?

glad you got some results.
did you do any replicates??
did you make sure to plate within a few hours (keeping the samples cool)??
those points (and standard devs) are very important for the ‘classical scientists’ - but who are the ones you talked to???
we are still working on our report for the ‘montreux clean beach project’ - somewhat sadly still awaiting the finalised python code from our colleague, to let people see the data in many ways… Of course it was always out and available as we were gathering it…
Still, after getting coopted by the WWF (not paid), to do what he does, stats and coding, around their ‘swiss litter report’ - which basically mirrored our colleagues’ great work, but offered him nada - we got very delayed… in the end he felt sorry for the (paid) intern, and did more than he should and is in serious danger of a burnout! then, I met the guy (at ECSA conf in Geneva the other week) who publishes the citizen science journal we thought we would be submitting to (before this summer - just a few days away!) and he was talking about how you can forget about the science in cit sci and I got bummed. But, yes, both on the public side (montreux authorities) and the rest (scientists), not to talk more about our publishing hopes (which also seem a bit weird to me as the data has already been ‘out’), it is not going to be simple .
but certainly interesting!
how are you sharing your open data?? claims are best when everyone can access the raw data and the processed summaries, I think. We hope to find out if this is really true, of course! :wink:

1 Like

Good point about the sharing openly, we should. So far it’s not worth sharing though, the tests we have done are more demonstrative to get things moving. A bit more rigorous than the demo at OpenVillage though :wink: we had real incubators this time round.

Now the group of enthusiasts is a lot bigger, so we’ll want to do some real sampling and data collection soon.

1 Like

sounds great!
I am so excited because the pea seeds are soaking now and the cultures half way there, for our first urban garden trial!!
keep up the good work!
:sunny:

Just in case, here is the Hackuarium wiki page about this trial!
http://wiki.hackuarium.ch/w/Urban_gardens_with_rhizobial_bacteria

2 Likes