Here are some of the questions we would like to discuss with you tomorrow:
-
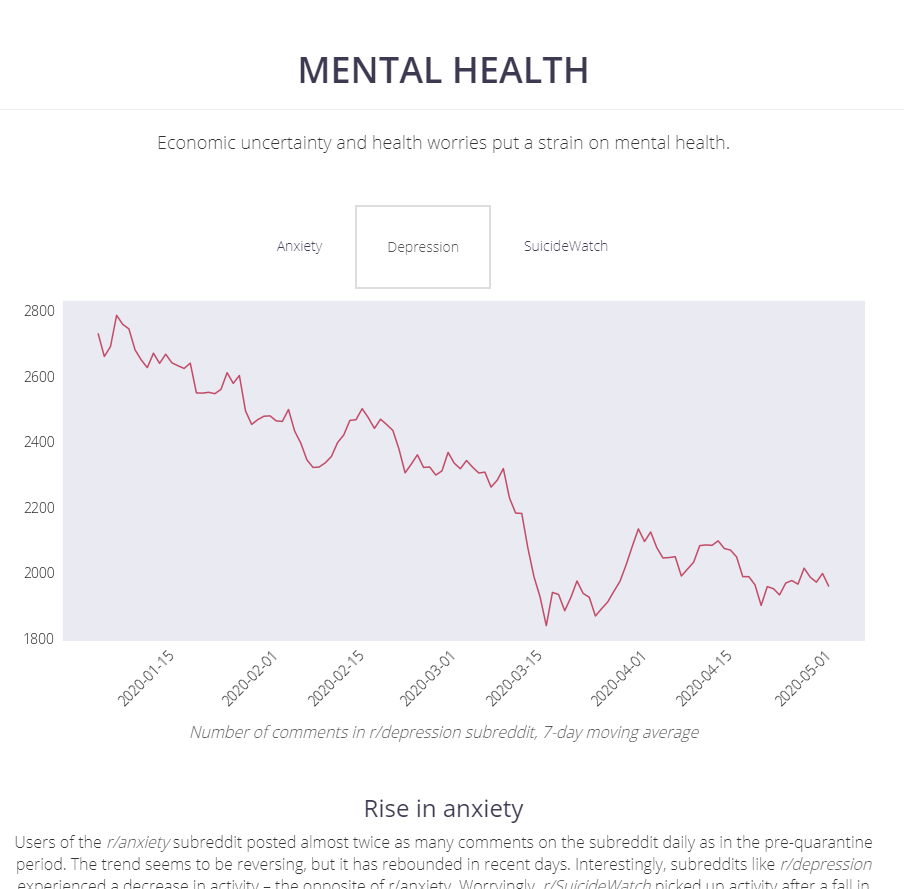
One of the things that stood out to @johncoate when looking at your data was that anxiety is up while reported depression seems to have gone down during the crisis.
How could we interpret that? What else other enquiries/studies would need to be made to understand this more?
Could we use the Mental health graph on https://covid.delabapps.eu/ to explore how to read and interpret such data - and how not to?
-
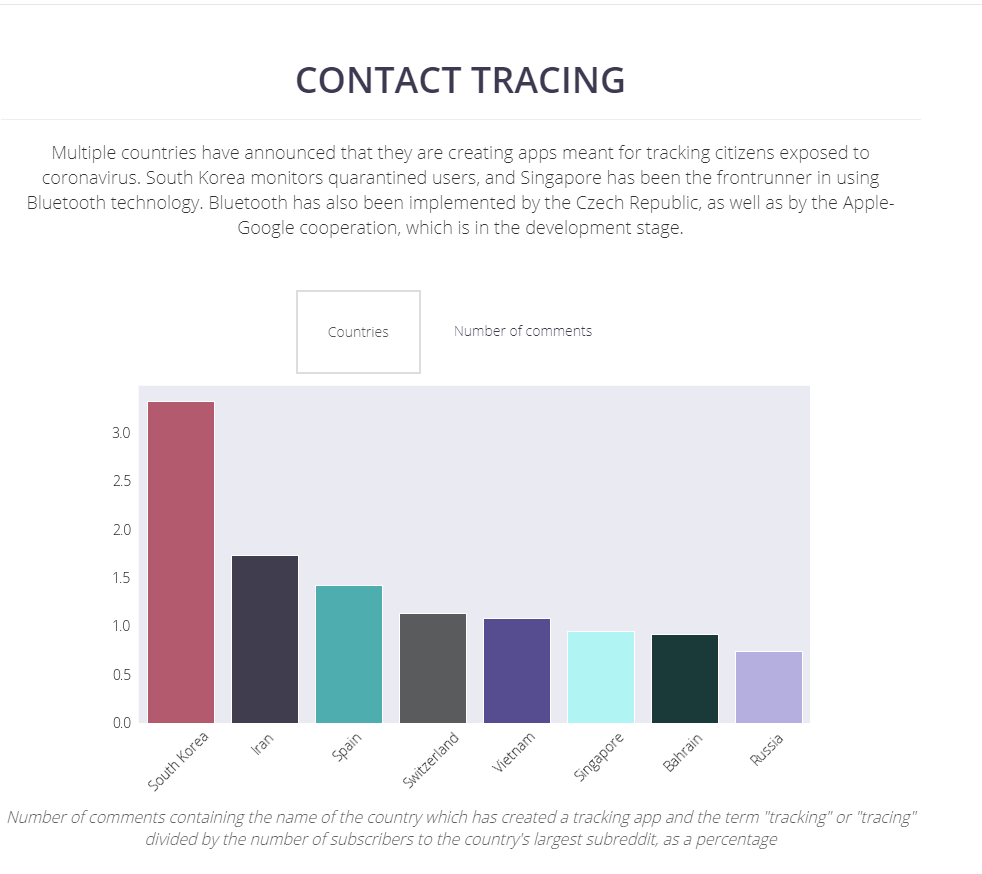
During the surveillance pandemic session, one of our results was that “Locational data are impossible to anonymize and of limited utility. Capacity for data governance is bad”. How do you source and deal with locational data? How do you evaluate it? You have graphs regarding contact tracing on https://covid.delabapps.eu/, maybe we can use that to focus the conversation.
-
Can you “find” data without searching? How did you set out to select what you would collect and display for COVID-19 NGI Forward
-
What has been the most striking (data)point pattern you have found in your COVID Data research?
-
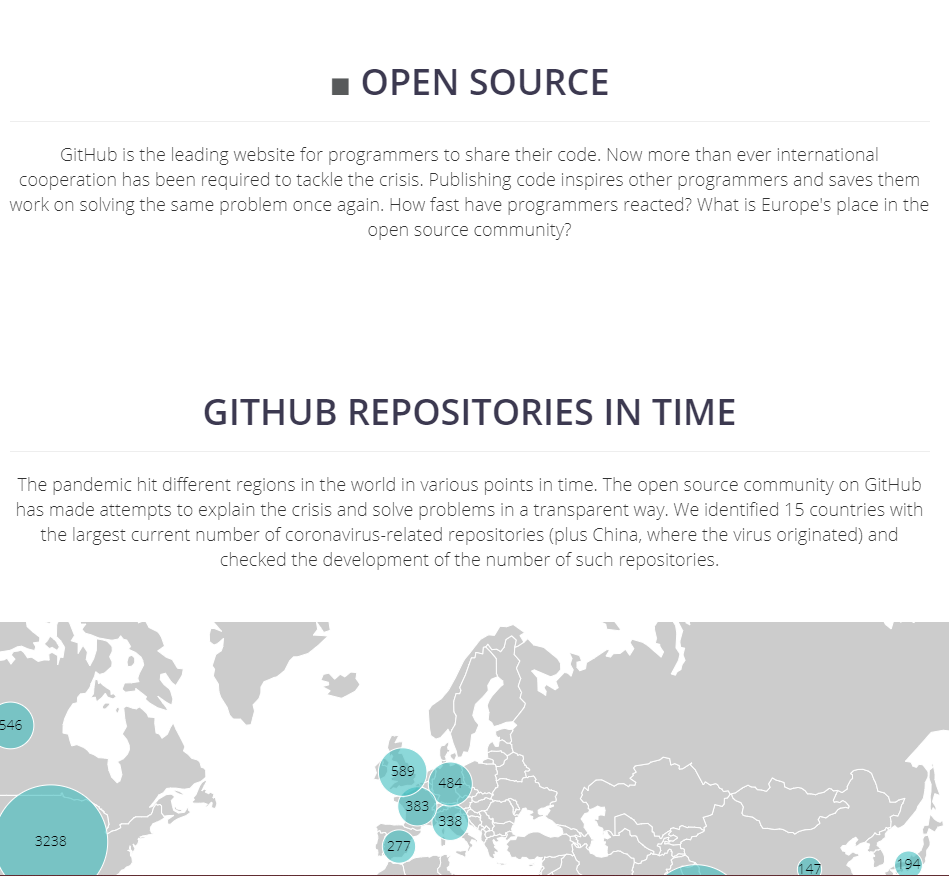
How would you “read” or interpret the GitHub Repository map you provide on your platform and what does that tell us about the international opensource communities?
-
How does a data scientist emotionally process what you learn? And how does everyone? We are dealing with large datasets which contain the lives and death of millions of people. How does one fasm that? Should one try to fasm that? Statistically feeling bad