Writing a paper on network reduction (landed on "Applied Network Science")

Calling on @Jan @Richard @amelia @bpinaud @melancon: we have cleared a bit of a milestone with this paper, and I think it is time we all meet again.

This is now done. In fact, I think I have done one better: thanks to the progress made by Bruno and Guy, I was able to finish section 5, and write section 6.1, of the paper. This means that all four techniques are now described and their result quantified (section 5). They are also compared against each other in a qualitative way. Section 6.2 is going to quantify the extent to which pairs of techniques converge to the same results; I will draft after Bruno has finished the computation.

Section 6.1 contains also a summary discussion in the form of Table 3 and Figure 5. Figure 5 is what you want (see below). The graphic stuff is coarse, we’ll polish it but I am prioritizing speed so we can have this discussion with you.

I suggest you read sections 5 and 6.1, then we have a discussion and you (Jan, Amelia, Richard) tell us what you see in these reduced networks, and well they satisfy you. I suggest Wednesday 17th (will be on the road on Thur and Fri).

Bruno, Guy, I also finally have some kind of answer to:

Yes. k is a granularity parameter. If you set it to a value k*, that value becomes the maximum possible redundancy that any edge can have. This is because redundancy is the numerosity of the union between the k strongest-tied neighbors of ego, and the k* strongest-tied neighbors of alter. At the very maximum, these can be… k*: complete overlap. So, if you remove all edges with redundancy < k* and your network is still too large, you can recompute redundancy usign a higher value for k. However, there is a catch: as you reduce more, your giant component dissolves into a number of dense connected components, making your reduction quite meaningless. So, in practice, I think it is not that important how you set your k.

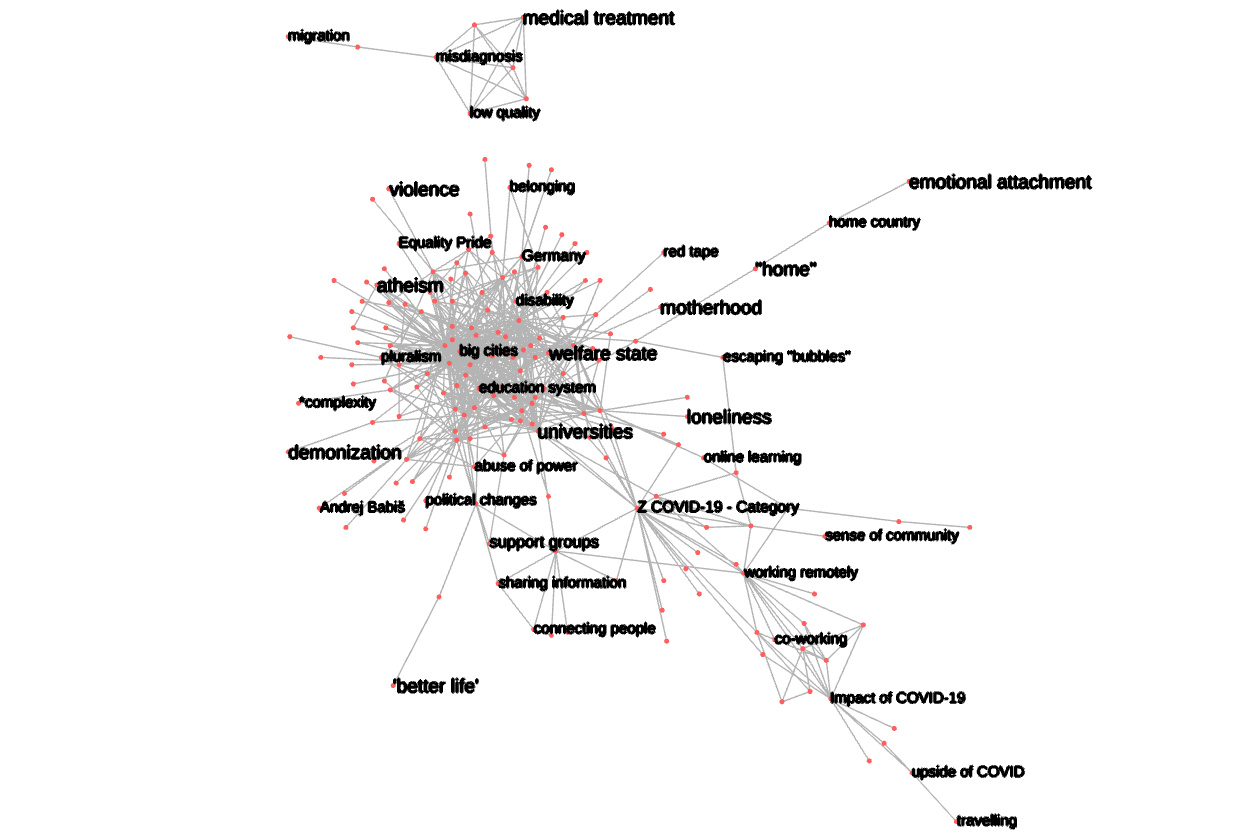
Here is POPREBEL reduced:

By association depth > 8

By association breadth > 2

By highest core values > 63 (highest possible for this dataset)

By Simmelian backbone, redundancy > 5:

1 Like

Hi @amelia, hope you are well. @Richard and I are going to meet in two hours, at my 14:00 (19 in London) today (Wednesday) to talk about the paper. Will you have a moment? If not, how can we get together to move forward this project? Warmly, Jan

@alberto @amelia and All, Richard and I had a very productive meeting today and now we are writing our thoughts down. Alberto: how many words do we have?

Two main ideas I have: I think that each of the four reduction techniques can be linked to a different school in sociology/anthropology. If we can pull this off, it will be very cool. We are in a dialogue not only with anthropological methods (ethnography) but also anthropological theory. Second, once we draft our ideas, we should run them through you, so you can tell us if it makes sense for you.

Here are the basic intuitions (but we need to study your draft more): (1) Association depth is about revealing the structure of thought or discourse, with its “central” points/nodes. (2) Association breadth is about revealing social structure behind the collective reproduction of culture/discourse, with its central actors. (3) “By the highest scores” is about identifying the focal points of a given cultural field/discourse. (4) Simmelian backbone is about identifying clusters of discourse or sub-cultures or sub-communities of discourse. (1) takes us to Levi-Strauss with his idea of the universal structure of culture. (2) takes to Jeremy Boissevain and his “network anthropology.” Observe that here: https://www.bebr.ufl.edu/sites/default/files/Boissevain%20-%201979%20-%20Network%20Analysis%20A%20Reappraisal.pdf, in footnote 1, he (an anthropologist/ethnographer) talks about giving a paper at a conference on “Mathematical Approaches in Social Network Analysis” in 1977! We are not inventing anything, surprise, surprise, but we are pushing it forward, I have little doubt. (3) is perhaps most clearly about the theory of hegemony, but also about all those theories that focus on the centrality of certain symbols (focal symbols) or metaphors (root metaphors). Finally, (4) is about the fact that cultures are as much unifying as they are about dividing (it seems). I think the Comaroffs are our authors here. Basically, centrifugal and centripetal forces operating simultaneously.

So, at some point we need to talk. It is a lot of fun. BTW, the parts of the paper that we already have are well written and the argument is powerful and clear.

1 Like

Wooow! That sounds really really interesting, far beyond my expectations.

Again, powerful intuiting work, @Jan and @Richard! I am not sure I understand point 3, but I will at some point.

The paper has a limit of 9,000 words. Overleaf now counts 4,124. We should be a bit conservative because the LaTEX tools for word counting sometimes do not fully take into account figures captions etc., but still there is space for making your argument.

Eager to do so at the earliest occasion!

Do you refer to the parts written by @melancon, @bpinaud and me on Overleaf or to your own work document? Can I have a link to your G Doc?

Hi Alberto

Here is the link to the Google Doc. Apologies, I now remember that you asked for this link before.
I’ve done a first draft of Jan’s first point (‘Association depth is about revealing the structure of thought or discourse, with its “central” points/nodes.’) I’ll move on to the second point about social structures and actors next.

R

1 Like

@alberto, @melancon, and @bpinaud - I referred to the part written by you guys. We (@amelia and @Richard) will send you a link to our working draft very soon - we want to get it into a better shape before you can sink your teeth into it. Last night I studied, sentence by sentence, you part and have several comments and questions. I still cannot fully get the more technical part explaining the operation behind the Simmelian backbone reduction, but I get what it is (only now I absorbed that it is based on Simmel’s concept of primary group!). So, I am reading this: https://ieeexplore.ieee.org/stamp/stamp.jsp?tp=&arnumber=6785754. We may want to indicate that while the concept originally was invented in the study of human relations and networks (for example, Granovetter’s weak and strong ties), we apply it to concepts and representations, and the structures of connections that emerge among them. In this case we are looking for semantic equivalents of Simmellian triads. After reading the above article (well, some of it) I am more confident that this methods allows us to isolate and visualize “strong” clusters of concepts, equivalents of Simmel’s social triads, i.e. something close to Cooley’s primary groups. But we have to be thoughtful here: inter-human triads are not the same as triads of concepts/representations. There is no “exchange” among them, in the sociological sense, but there is - I think - strong modification/trannsformation (for the lack of better term) of meaning. The image of “Father” in the arguably most famous triad (Father-Son-the Holy Ghost) is different than the meaning of “Father” in a diad “Father-Son.” But that “added” meaning results not just from the more “complex” structure (now 3 elements), but from the semantic field/meaning of “Ghost.” Thus, once we identify those “Simmelian” clusters, we will have a lot of fun doing “old fashioned” interpretation of the meaning modifications/transformations due to the heightened strength of the “triadic” inter-concept ties - a feature that we will discover and visualize!

2 Likes

Yes. This, in fact, was the source of my hesitancy when Guy suggested we apply this method to non-social networks, but he convinced me that the argument made by Nick (the inventor of the method) generalizes. The main idea is that, if code A and code B have many common neighbors, their connection is somehow “implicit” in the local topology. Even if the edge (A <=> B) were somehow lost, A and B would always end up in the same cluster, pulled close to one another by all these common neighbors.

Of course, these clusters are not social groups in our case. They are semantic, clusters of association. But the argument still holds.

I will make this addition as you ask, it’s a good point.

Meanwhile pinging @bpinaud: how fares the computation of the Jaccard indices?

I think, you mean how far ? Next week…
I would also like to search for a new index. I am sure there is one.

1 Like

“How fares”, how does it go? :slight_smile:

hey,
To compute the Jaccard index, I will add the number of common edges and nodes to the google sheet between the most legible graph for each reduction method. We will do the computation directly inside the google sheet. It will be easier (I think).
So about the graph to choose, there is no clear answer in vis (I asked Stephen Kobourov, Stephen Kobourov's Homepage). It depends on what we mean by having a graph visually interpretable. Quoting Stephen:
“one direction (that i am interested in) is to look at human perception: is it possible to “see” some graph property, or better yet, to tell the difference between the drawings of two graphs that differ in that property. we started to look into this a little bit:
Soni, U., Lu, Y., Hansen, B., Purchase, H. C., Kobourov, S., & Maciejewski, R. (2018, June). The perception of graph properties in graph layouts. In Computer Graphics Forum (Vol. 37, No. 3, pp. 169-181).” (tell me if you do not find the paper)

So first, can you tell me what graph to choose ? About the Simmelian’s backbone, any update on k?

Hello Bruno, if you want I am available to talk today.

Meanwhile: we have not gotten around to writing down the definition of a Maximal Interpretable Graph (MIG), pending this investigation in the literature. I have been thinking a bit about that, and I think our elements are the following:

  1. Density and size (order) reduce interpretability. A rule of thumb for a human-interpretable graph is of about 100 nodes and (#edges / #nodes) < 4 (Ghaniem, Melançon, Munzner).
  2. However, this is true of random graphs.
  3. Further, neither highest core value reduction nor Simmelian backbone extraction lead to such low-density subnetworks.
  4. Simmelian backbone extraction has another problem: as you crank up the reduction parameter, it breaks down into many separated components, destroying valuable information about the structure of the corpus.

I think we need to have three different criteria to select the MIG.

  1. For association depth and breadth, we follow Ghaniem, Melançon and Munzner. We filter edges out for d(e) and b(e) until the density drops below 4. This leaves us with a number of nodes between 100 and 500.

  2. For highest value core, we simply take the maximum found by the algorithm. This technique reduces the network to its largest subnetwork, such that no further node can be removed without the subnetwork breaking down.

  3. For Simmelian backbone, we reduce until we lose the giant component. I am not too clear on the formal definition of giant component, but we could impose that the largest component contain 80% of the nodes, or something like that. The backbone metaphor is telling here: we use this technique to reduce the network to its skeleton, but a skeleton is not the same thing as a heap of bones. Both size and density are going to be high, but the network is still legible because of high modularity. Does a literature-supported operational definition of giant component exist?

I will start writing this part now.

Finally:

I skimmed this paper, but I do not see what we can use. I would quote it in the related work to highlight the point that the literature on visually interpretable graphs is still in its infancy.

This is now done, in the Overleaf file:

Another way to exploit the network’s topology to identify its most important edges is to extract its Simmelian backbone. A network’s Simmelian backbone is the subset of its edges which display the highest values of a property called redundancy \cite{Nick2013}. An edge is redundant if it is part of multiple triangles. The idea is that, if two nodes have many common neighbors, the connection between the two is structural. This method was invented in the context of the analysis of social networks (hence the reference to Simmel). CCNs are not social networks, and no “exchange” in the Simmelian sense can happen between co-occurring codes. However, co-occurrence induces a modification of meaning, so that CCNs have what can be considered the semantic equivalent of Simmelian triads. This method. applies best to weighted graphs. Both association depth and association breadth are natural measures of edge weight in CCNs. In what follows, we use the former, as it varies over a larger interval and therefore allows for more granularity in the reduction process.

Yes, very good points.
Sorry, I see your message only now. I will be available tomorrow and Friday at 17:00. I may be available in the mornings but I do not really know when.
I already have some nice information to try some computations.

I will need to go to the gym shortly after 17.00, but let’s maybe quickly connect on the matter of the graphs to compare via Jaccard.

I noticed that you might need to reduce further by association depth in NGI, because no reduced graph reaches the threshold density value of 4.

Hello all, I have added to the Overleaf paper a section 6.2 where I discuss the different definitions of Maximal Interpretable Network for the different techniques.

@bpinaud, this should be enough to compute the Jaccards.

@melancon and Bruno, did you find a more formal definition of giant component? Or do we go with “70% of the nodes”?

@Jan and @Richard, I will now move to re-reading your Google Doc. Is there any part of it that can be transferred onto the Overleaf?

@alberto Now that the review meeting is out of the way, Jan and I will catch after today’s coding meeting to finalise our input to the discussion section. Sorry that it’s dragged on; the preparations for the review ate up all our time.

I know, it was a mighty effort

Hi Alberto

Jan and I have finished adding our bits of the article. We’ve left everything in Edit, so you can see the changes and accept the ones you are happy with.

1 Like

Wonderful news, you rock!

I propose:

  • @bpinaud produces the computation of the Jaccard indexes.
  • I incorporate both the part of @Jan and @Richard and that computation into the Overleaf, then re-read and start the polish.
  • I share a final draft with you all
  • We do a call to discuss it (Monday?)
  • I do another pass, then upload.

Works?

Also, I will need your ORCID numbers.

Also, a stupid question. Some journals, including Ethnography, allow for first versions of the articles submitted to be published on repositories like ar.xiv. But then what happens to the double bind review? Reviewers could google the text, and discover who the authors are. @melancon, @bpinaud, you must have some experience here…