Some (admittedly fragmented) notes from the call yesterday:
Attending:
@alberto, @noemi, @amelia, @brunoconte, @woodbinehealth, @gehan, @melancon, @hazem, @jason_vallet, @natalia_skoczylas
Discussion on how you might use this tool if you were trying to figure out what to use this data for.
Amelia: As a policy maker this is something we have been talking about quite bit.
Alberto: Example connecting legality, existing system failure, and safety and regulation. We make a hypothesis on the basis of the graph, confirmed by reading the conversation. Many people blocked by regulation trying to do something beneficial, but there is also a recognition of the issue of safety - this contradiction plays out in sophisticated ways in the OpenCare community. The way you dig deeper into this is by reading the text, but at a higher level you can already read it in the graph.
Amelia: You couldn’t read all the stories, there are too many. Graphryder enables you to pick out the stories, and dig deeper.
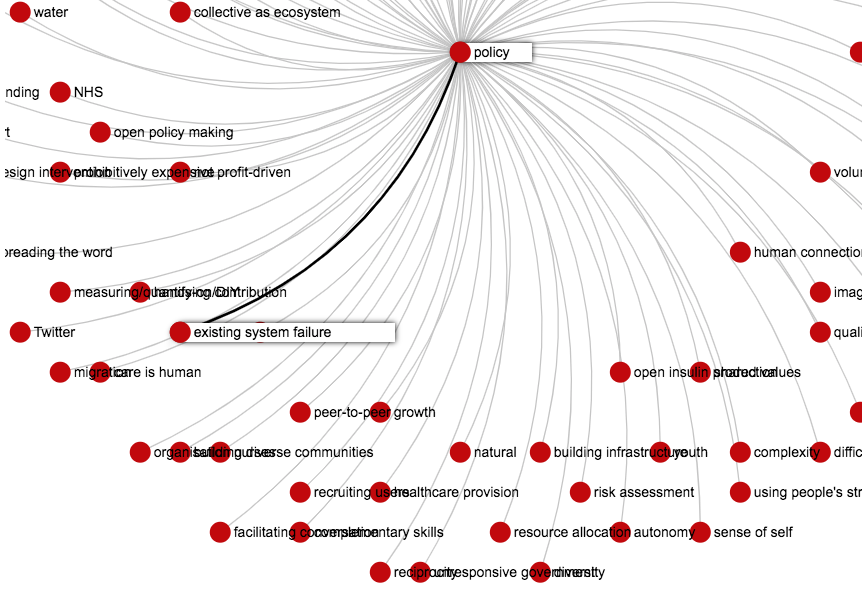
Start with the tag view. For example: I’m interested in ‘policy’.
One of the things I’m noticing is there is an interesting link between policy and existing system failure:
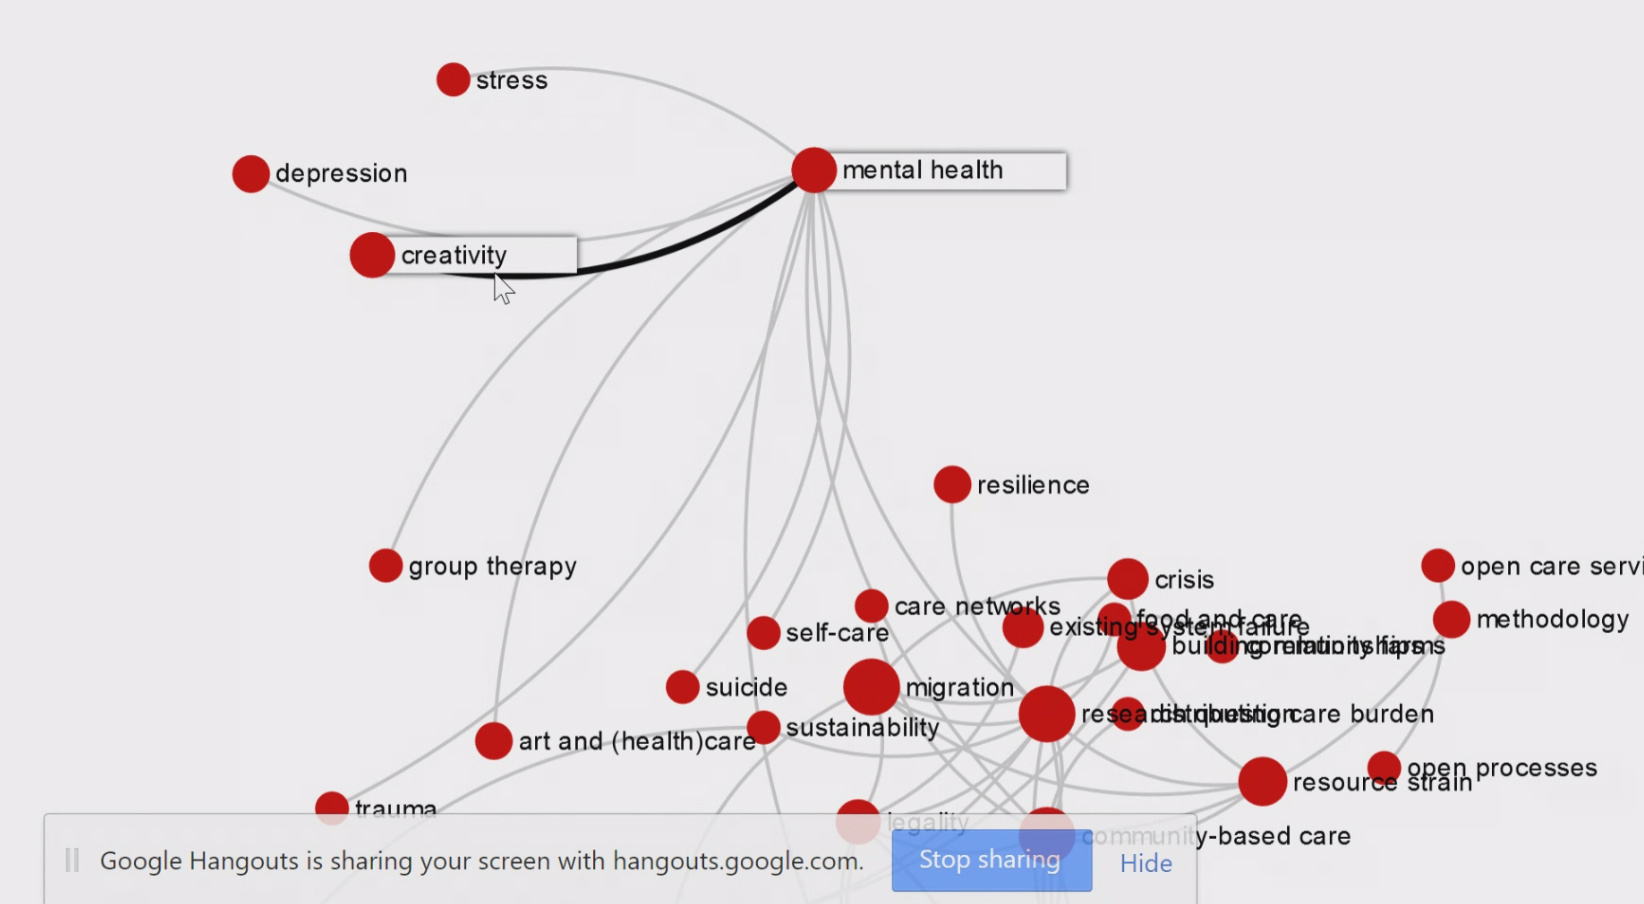
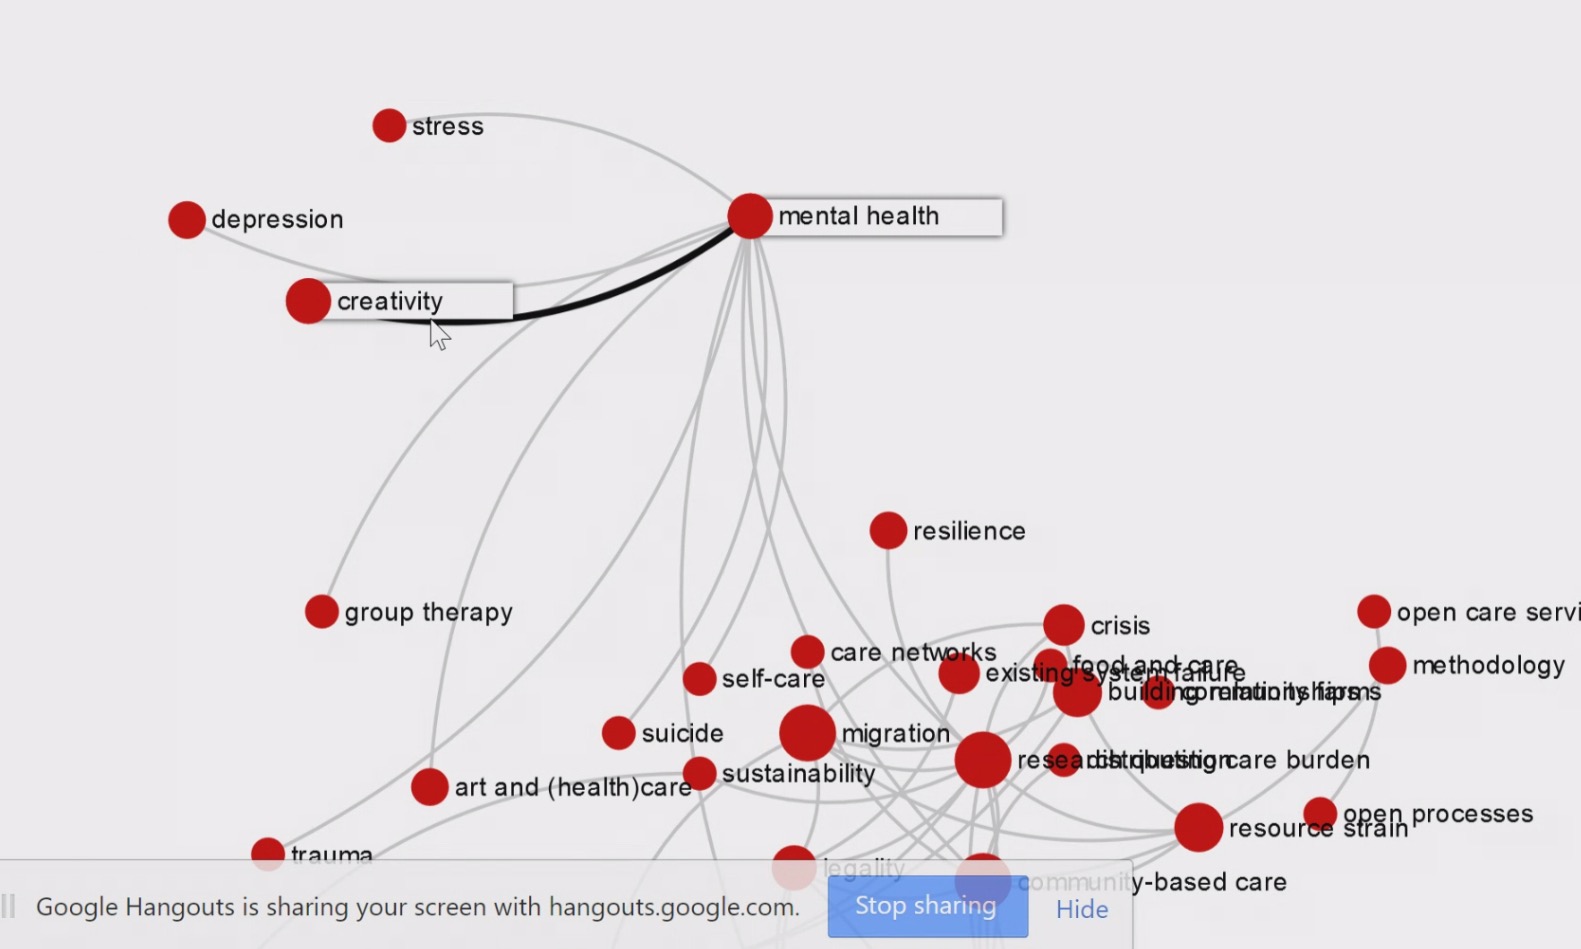
If I were a mental health professional, I could look at all the related topics. For example: mental health and creativity - what’s going on between the two, that might not be clear? I might not know the link between the two, but Graphryder provides a link between the two that exists. People feel they have more mental health concerns when they are in creative professions.
Now we get an overview of content that relates to both of these issues.
3000+ contributions in all on Edgeryders, very hard to filter through - Graphryder gives us an ethnological perspective: I would miss some of these connections if I didn’t get this zoomed out view - instead of relying on individual memory, I can see how strong the link between these different concepts are, that I may not have known about.
Looking at the graph - there’s a crucial link with safety and system failure - even though legal frameworks get in the way of DIY initiatives, there are existing regulatory frameworks to work within, which from an anthropological point of view is interesting.
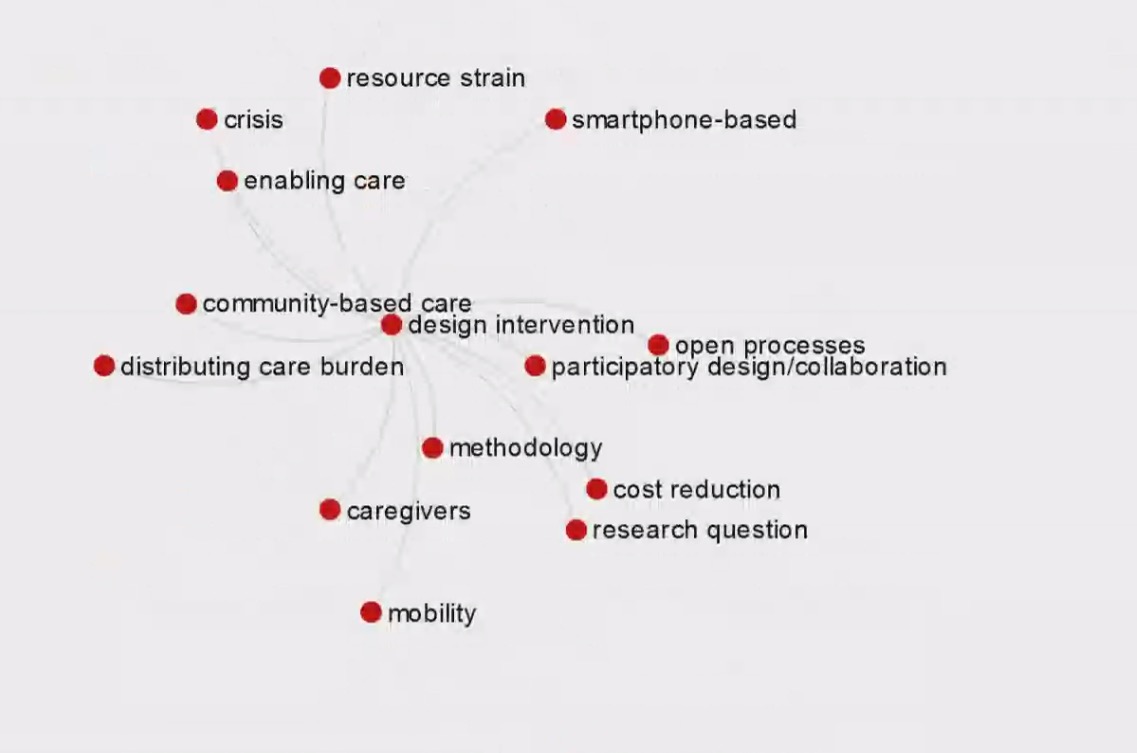
The tag view is really useful for seeing relations between nodes. By digging into care we can find a different angle of discussion on health, the design interventions node points us to smartphone based healthcare apps:
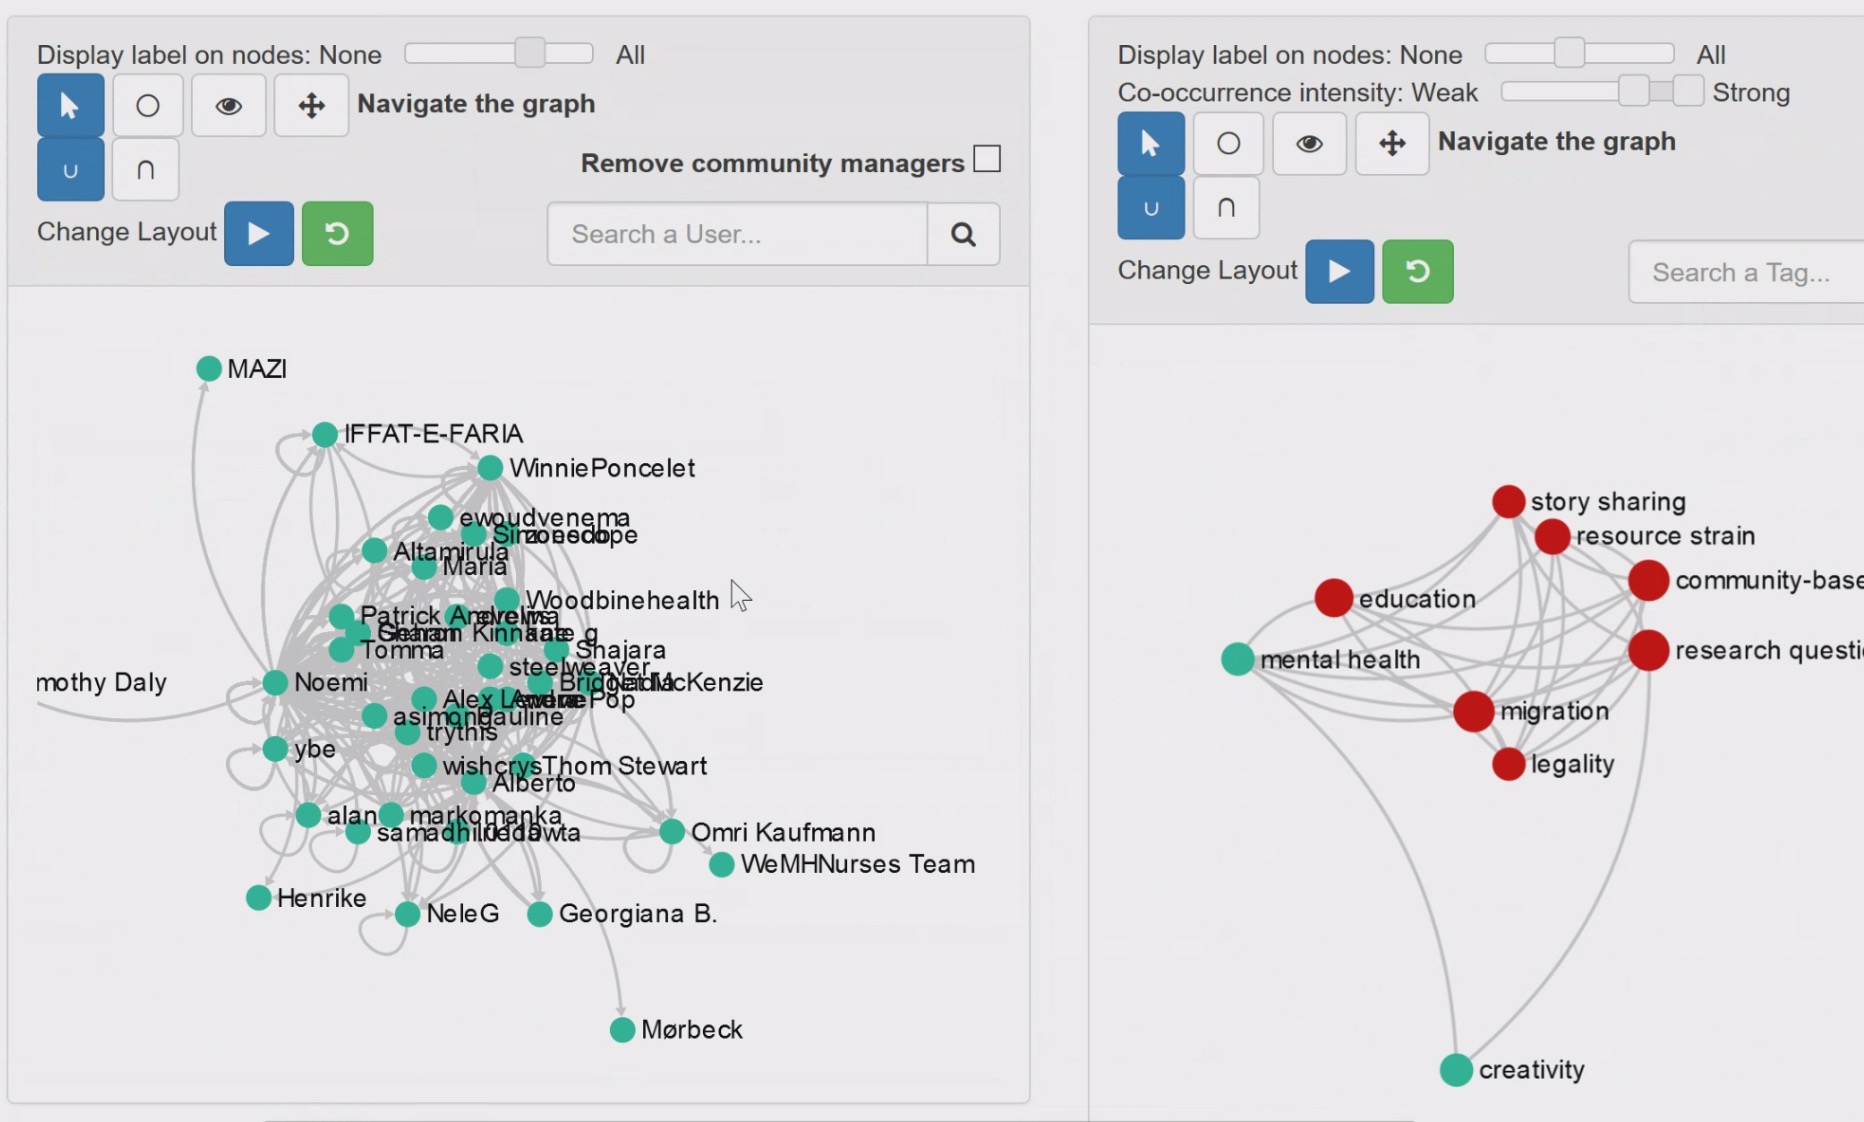
There are three different views: one for users, one for content, one for tags.
The Detangler view lets you see the intensity of the conversation around subjects.
Alberto: Benefit to local network analysis in ethnography - my instinct is to try and get information on the network as a whole - that’s what humans can’t do. Anyone can keep track of a local track of ten nodes or so - what is unique is the global connectivity pattern - a pretty close call for collective intelligence. My problem with the detangler view: hints at regularities, but stops ahead of the finishing line, which would be to say, these connections between nodes correspond to a social network, then you compute the social network metrics which has something to say about the connectivity. Ex: validation to interaction, if the social network is connected, we can hope, people have been debunking the connections between the two nodes, therefore we know the network is solid. You use it to calculate a reliability score of the reliability between the nodes on the social network.
Amelia: There are different kinds of interactions that are valuable. A few people discussing a topic might be more valuable, if they have a deep and intense knowledge of the topic, we wouldn’t want to discard them just because they are a small group talking about insulin and open research. Allowing for a way to display that importance is pretty important to me from an ethnographic perspective.
For example: mental health and creativity are closely looped - it seems a lot of people are talking about it. Is it an intensive or distributed conversation?
From an approximation: it’s a very diversified social network, looks like the link between mental health and creativity has been discussed and debunked quite a bit. Whatever the results: you can fall back on what people are actually talking about.