Edgeryders (ER) Spot The Future (STF) is a community of people and like any community we can have a look at it with the help of Social Network Analysis.
What network are we looking at?
First of all, the main network on which we are focusing is the conversation network. It consists of post and comments that people have published on the ER platform.
How do we create such networks?
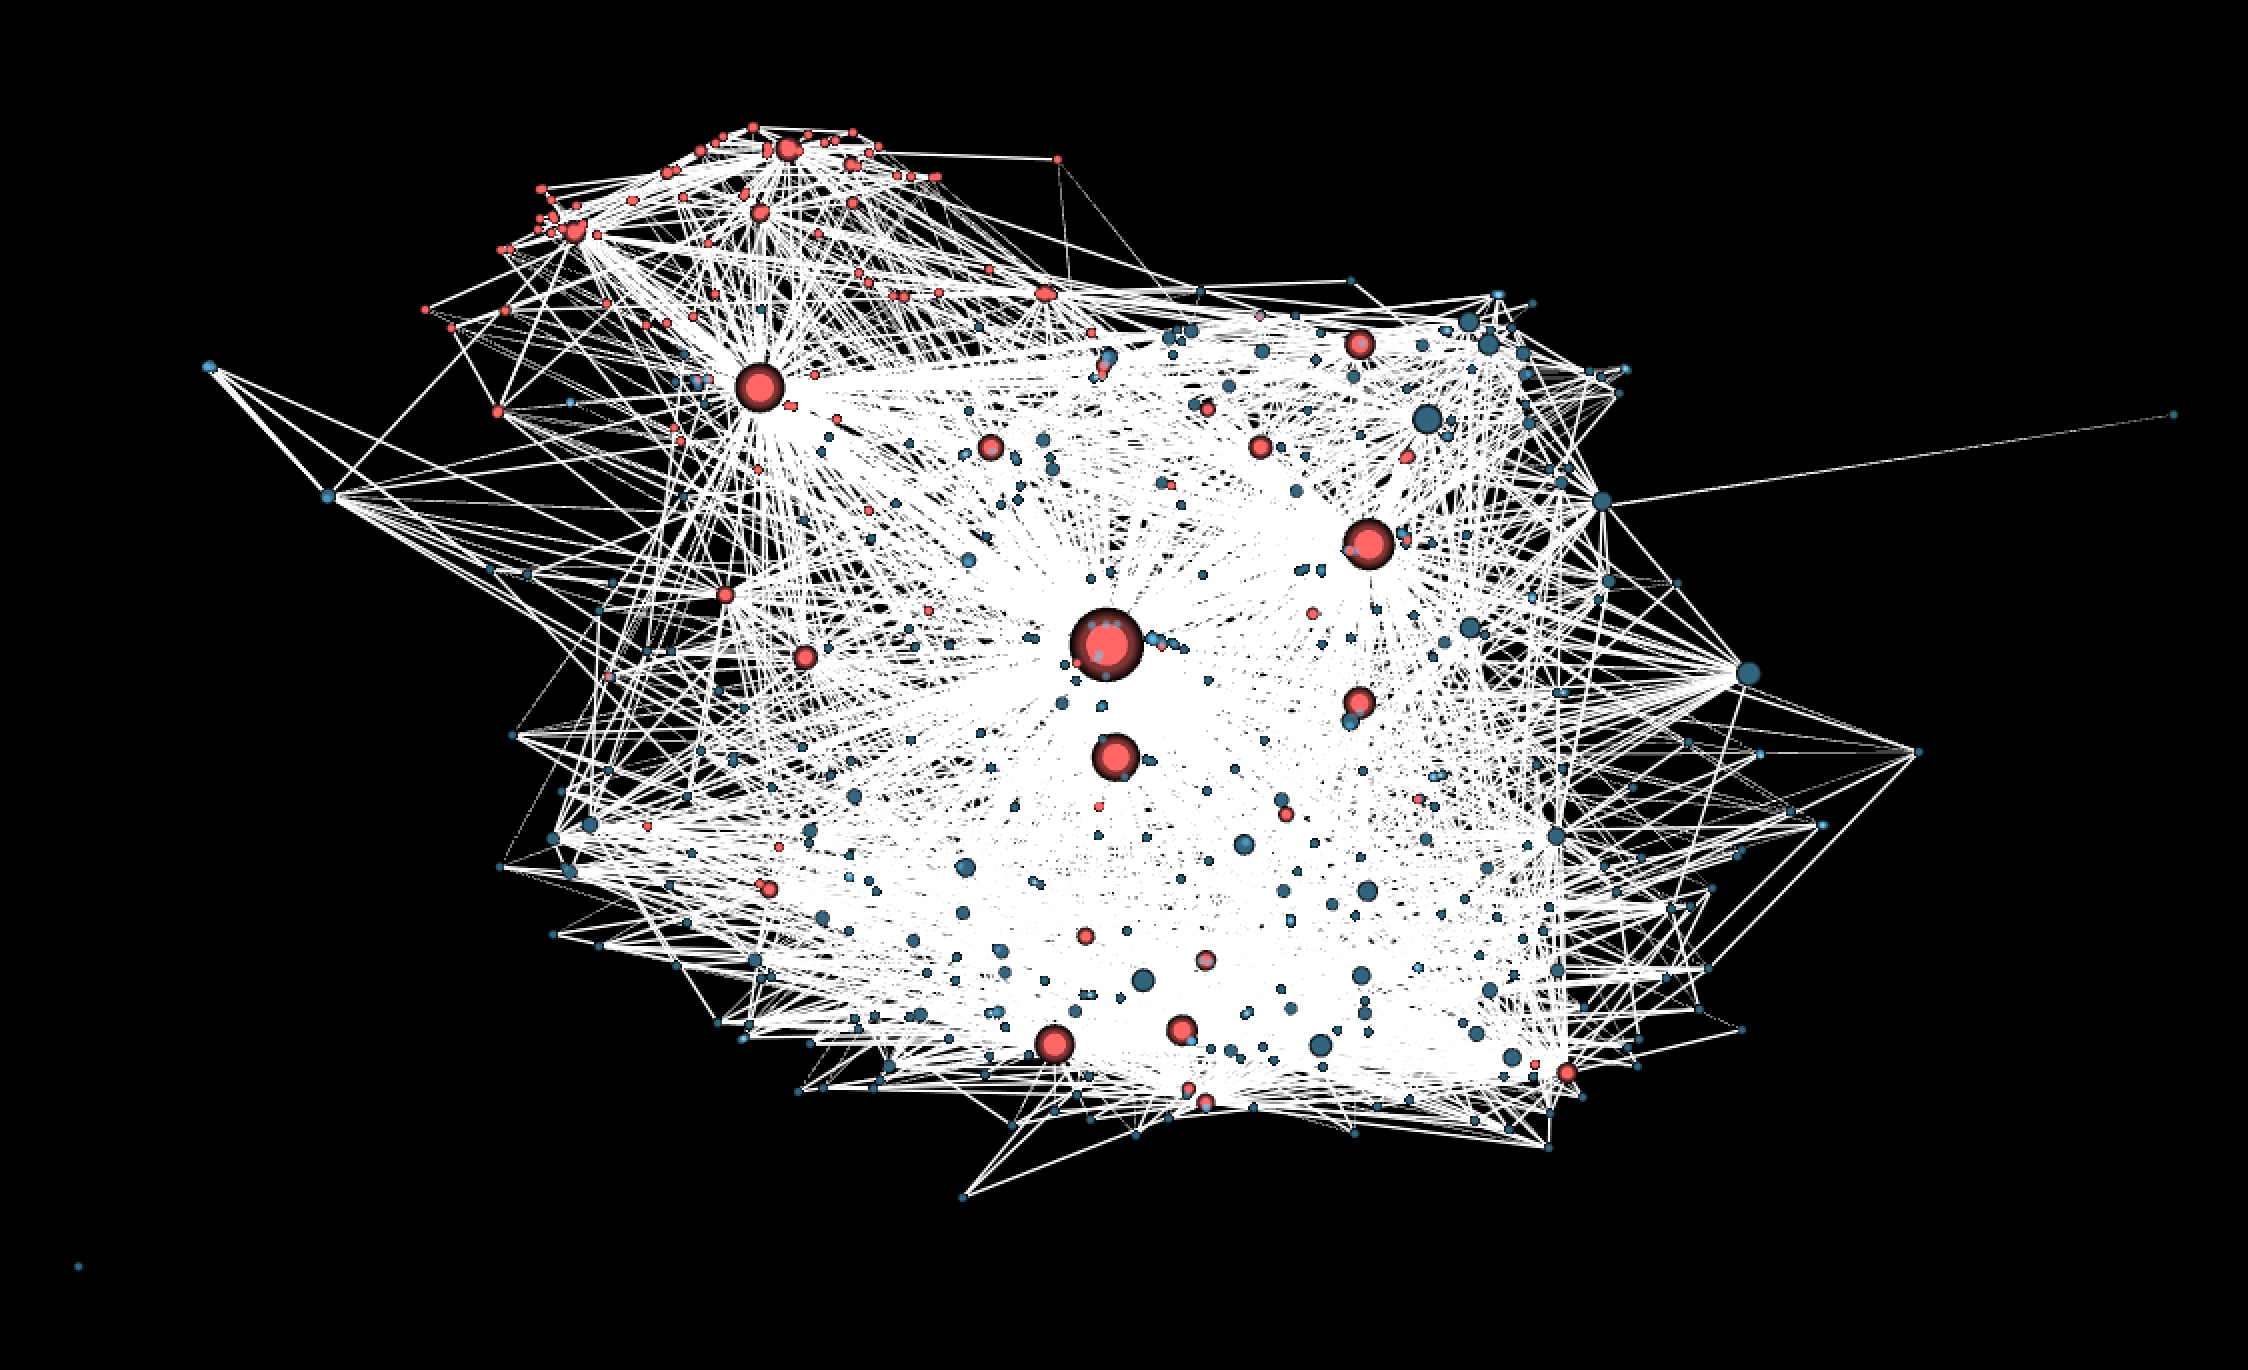
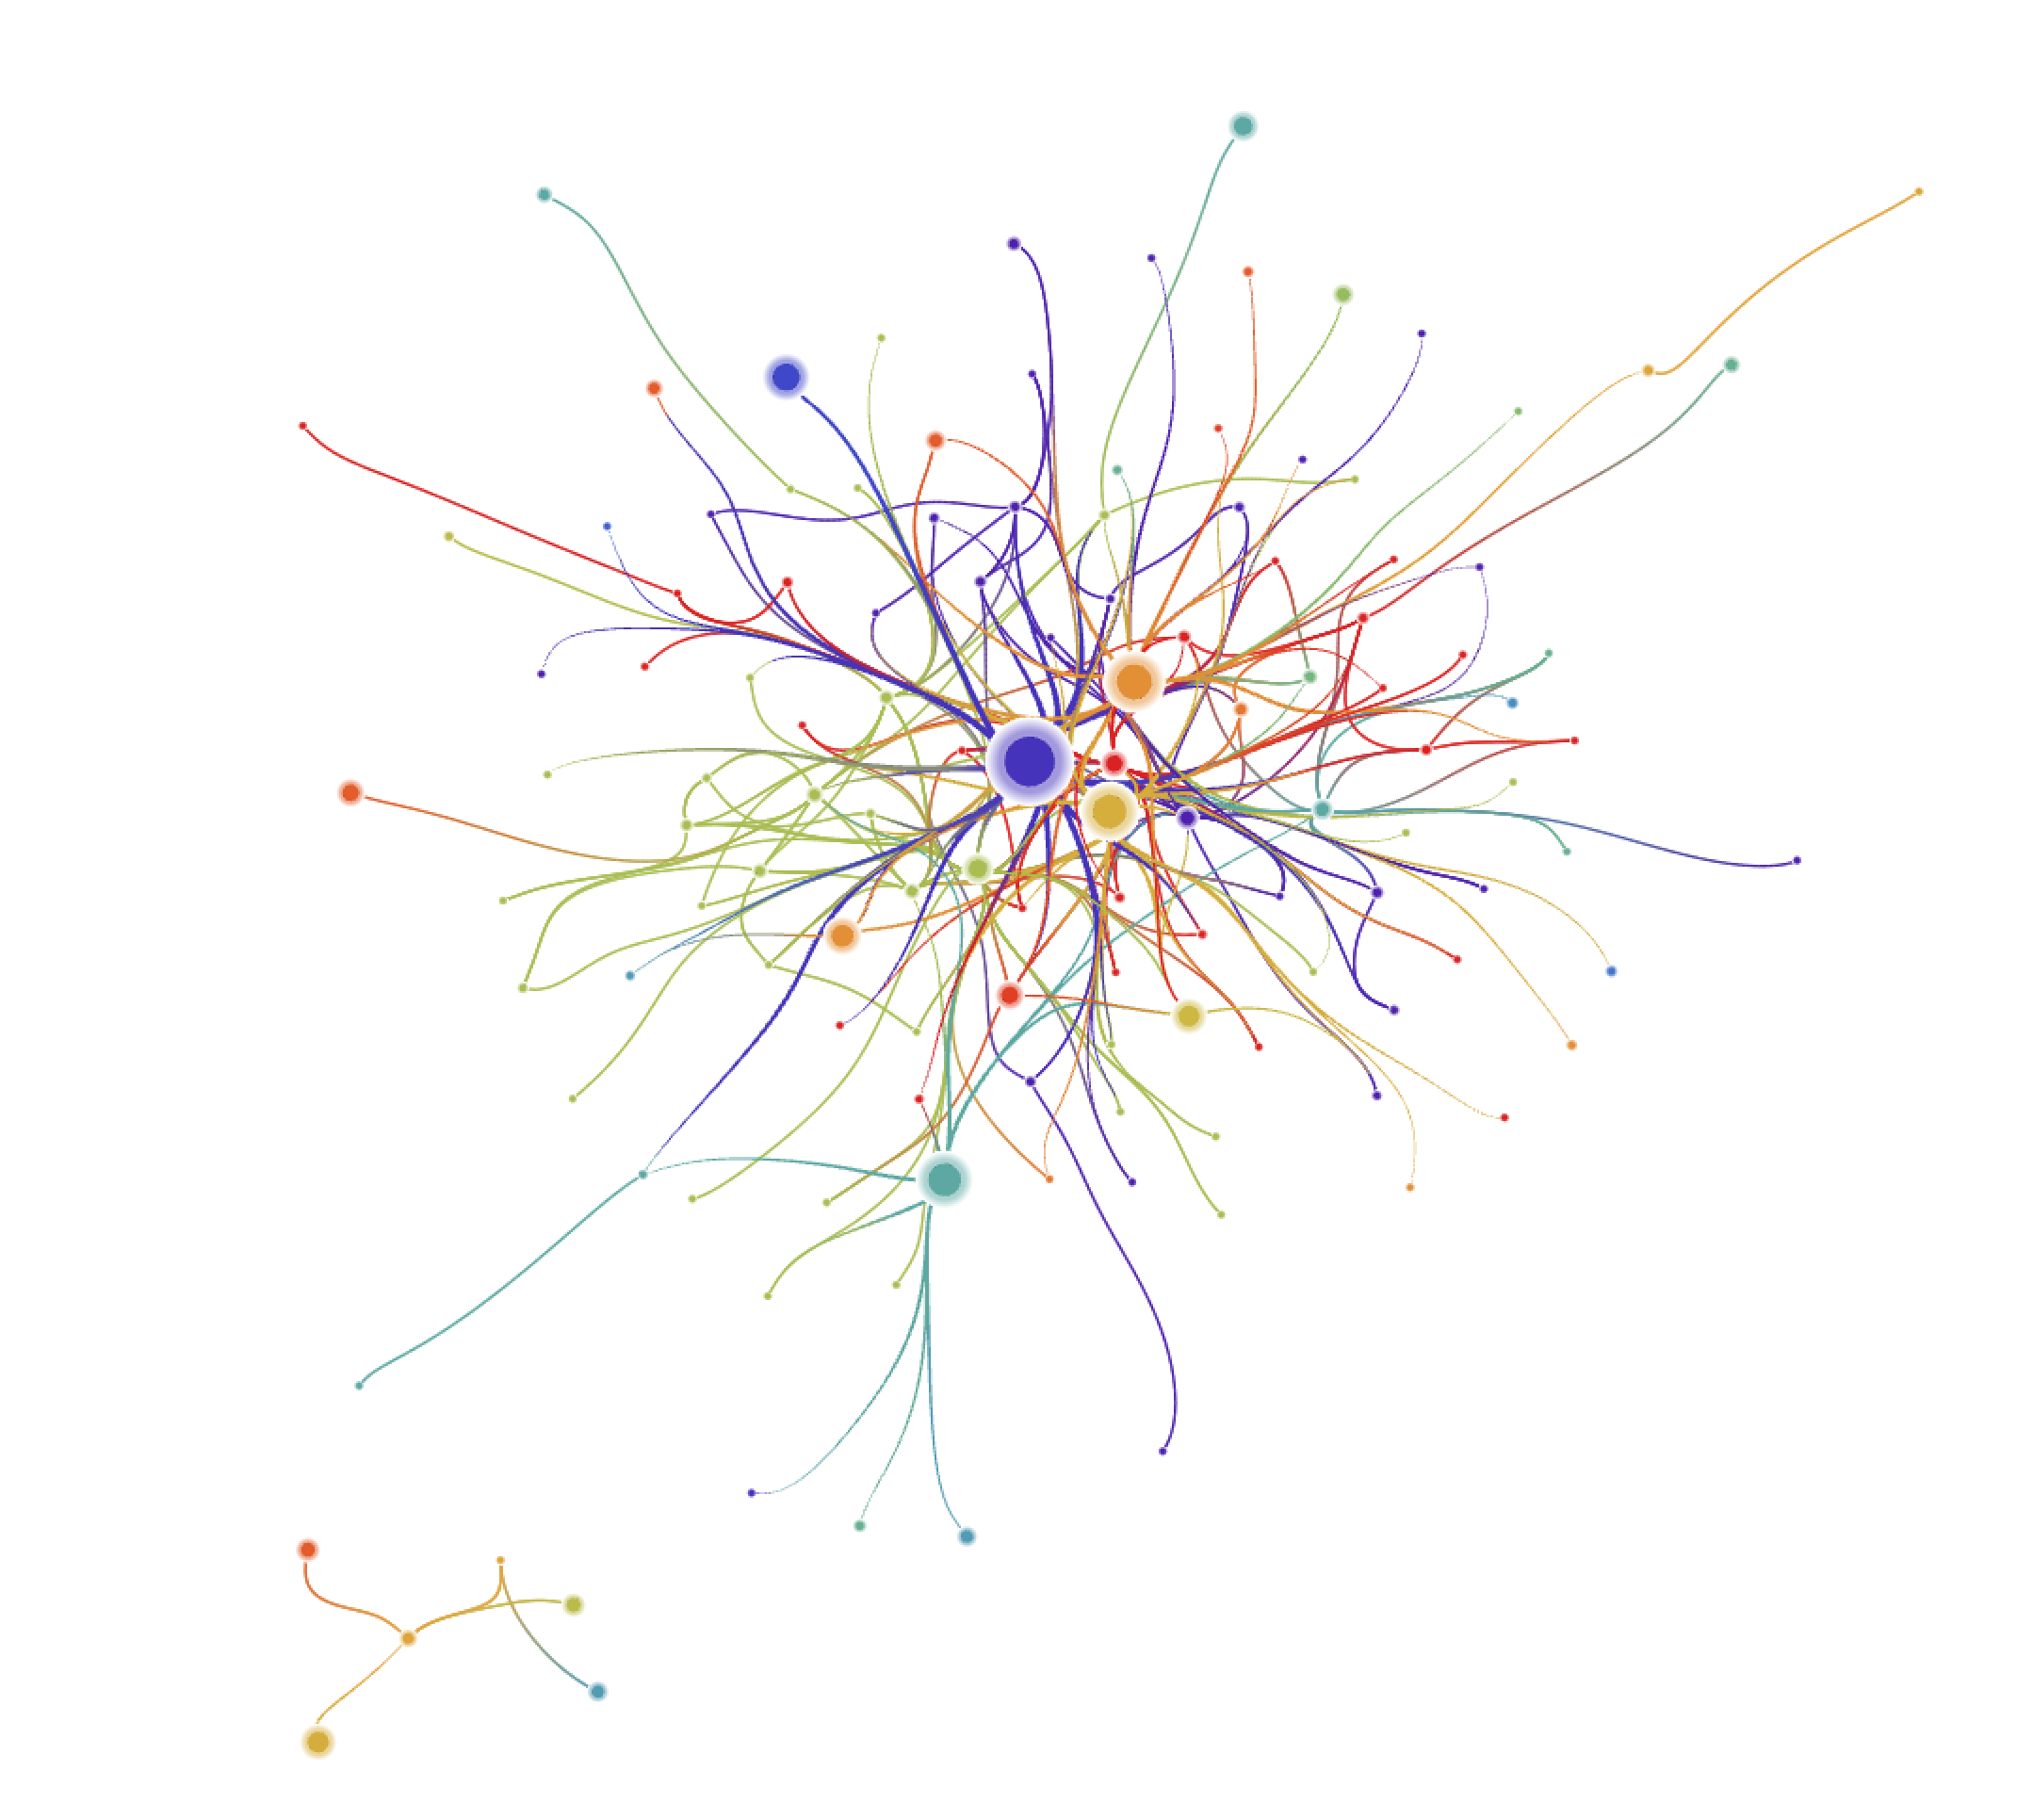
The structure of ER is as follows: users publish posts or comments. A comment then traces the flow of a conversation. Therefore the exists a conversational interaction when any user writes a comment, which is an answer either to a post, or to another comment. We can then build a network of users having conversations from their given comments. In SNA words, users will be nodes and there is a link between two nodes when a user has written a comment to another user. Some users may have produced more comments than others and that’s what we can use to set the size of nodes.
This is the network we finally may obtain:
How about STF?
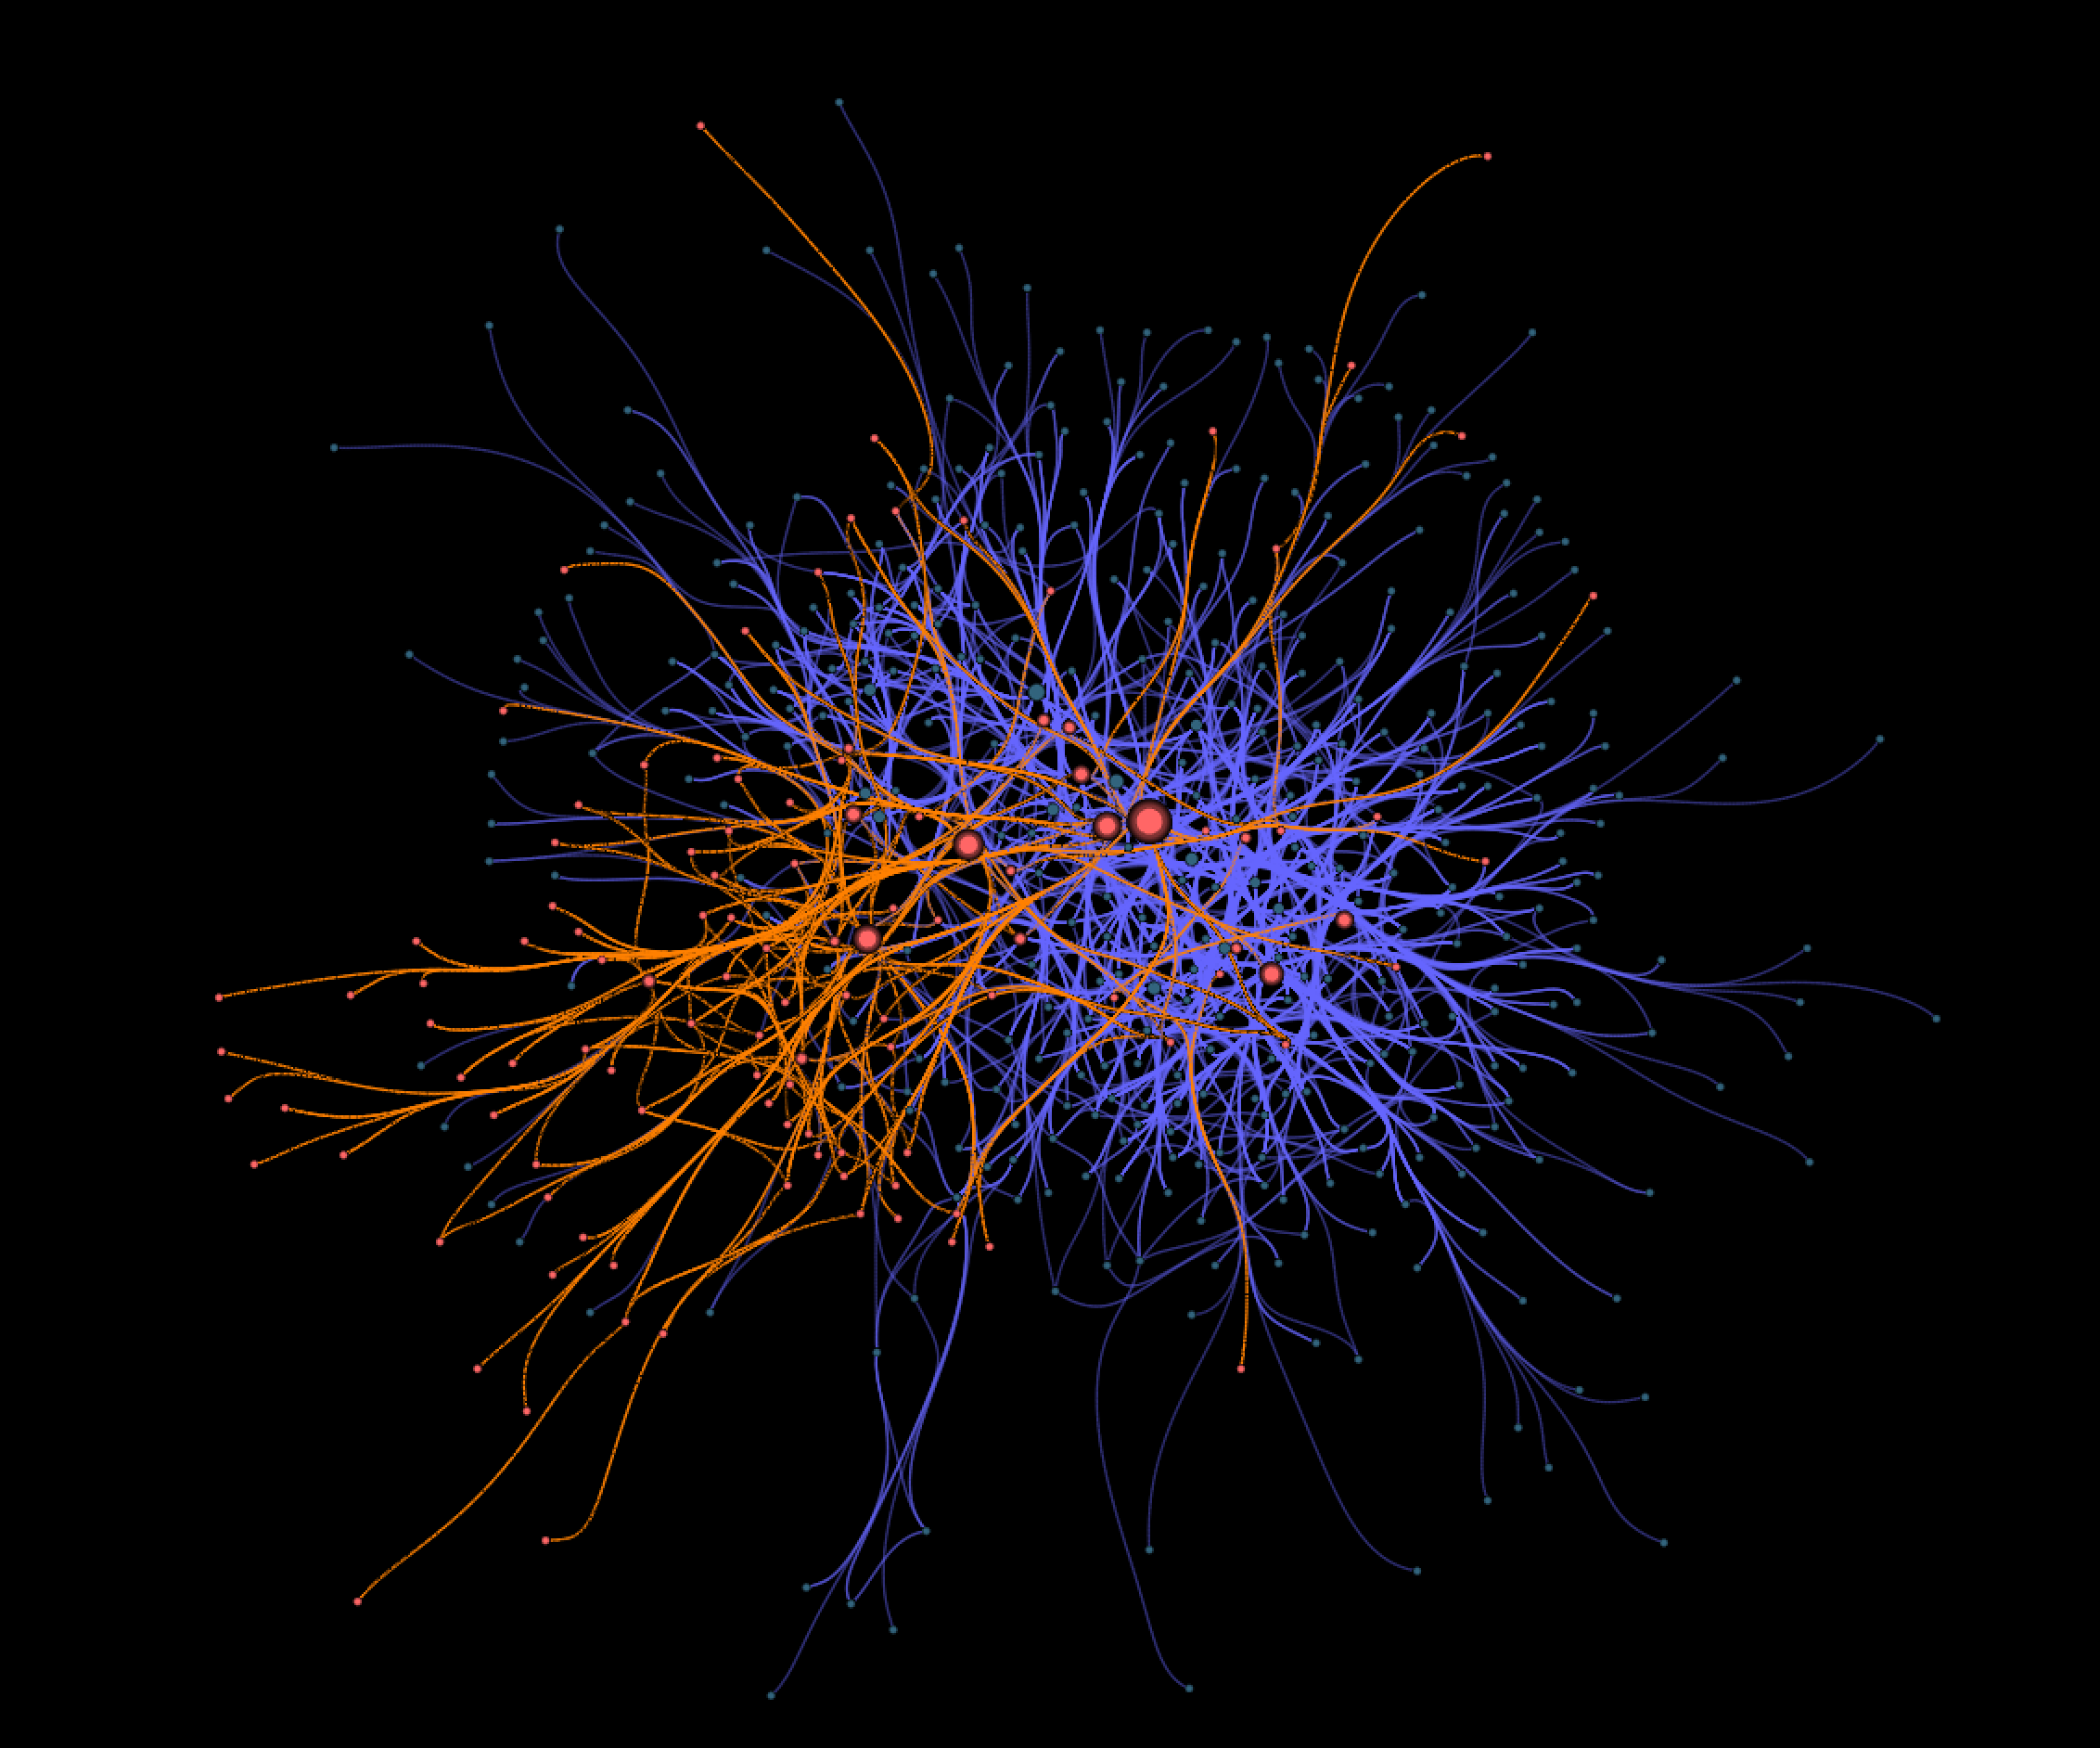
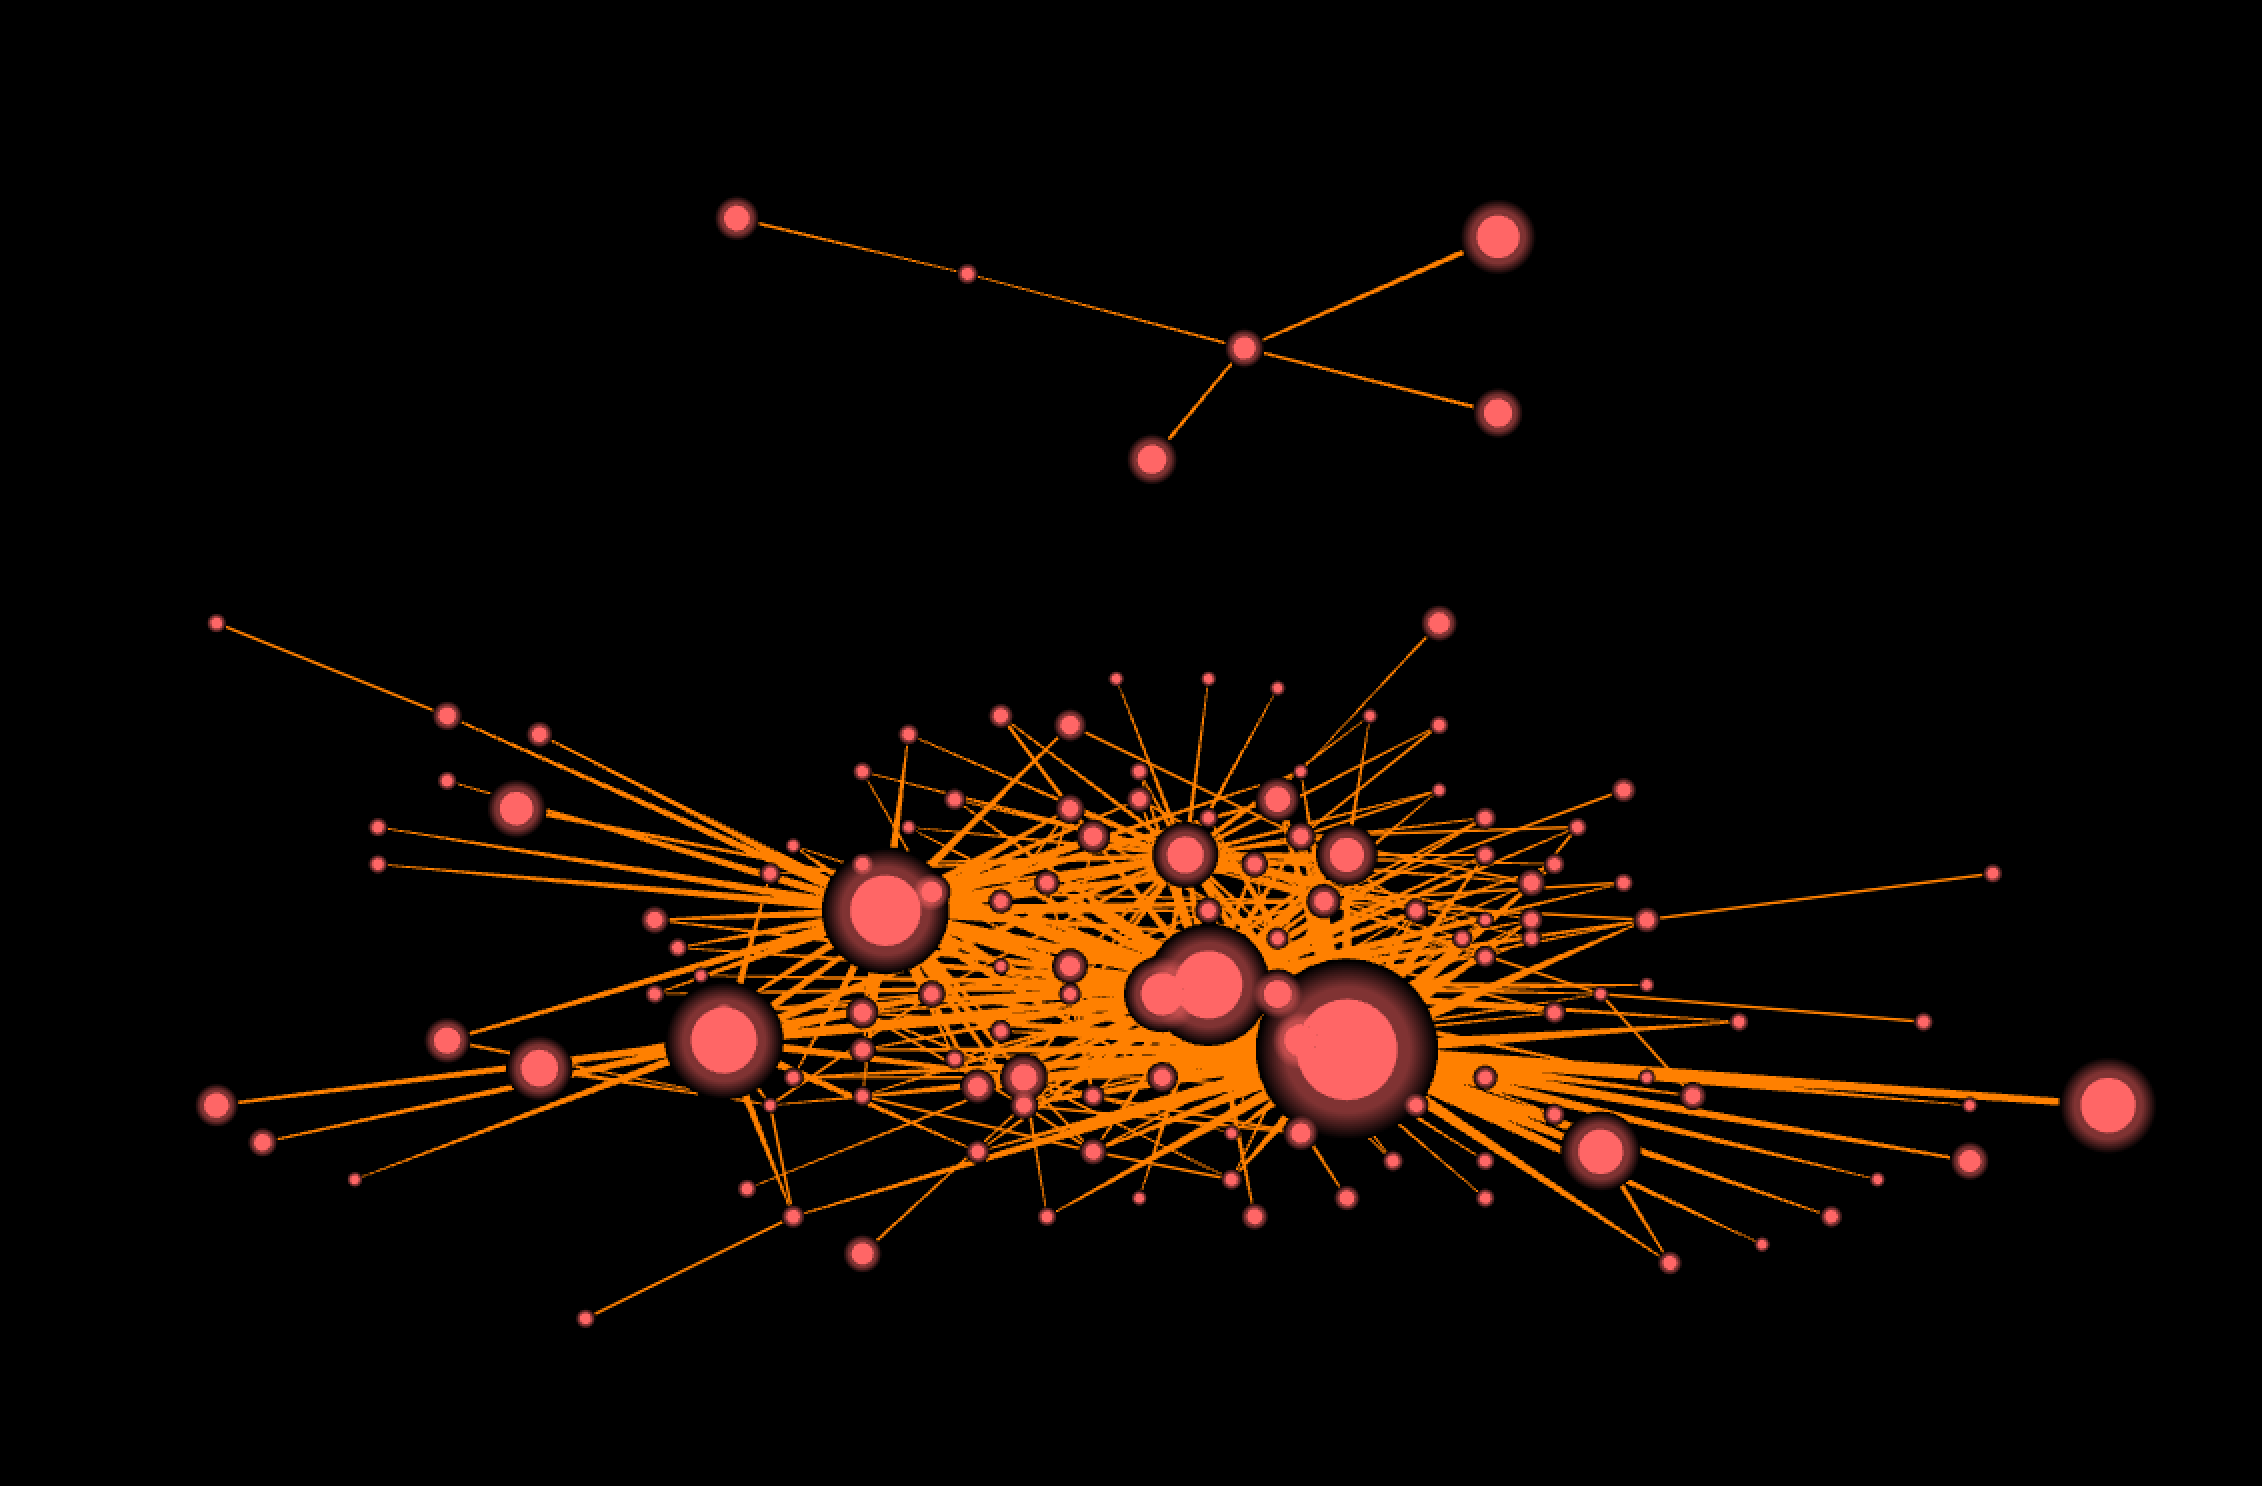
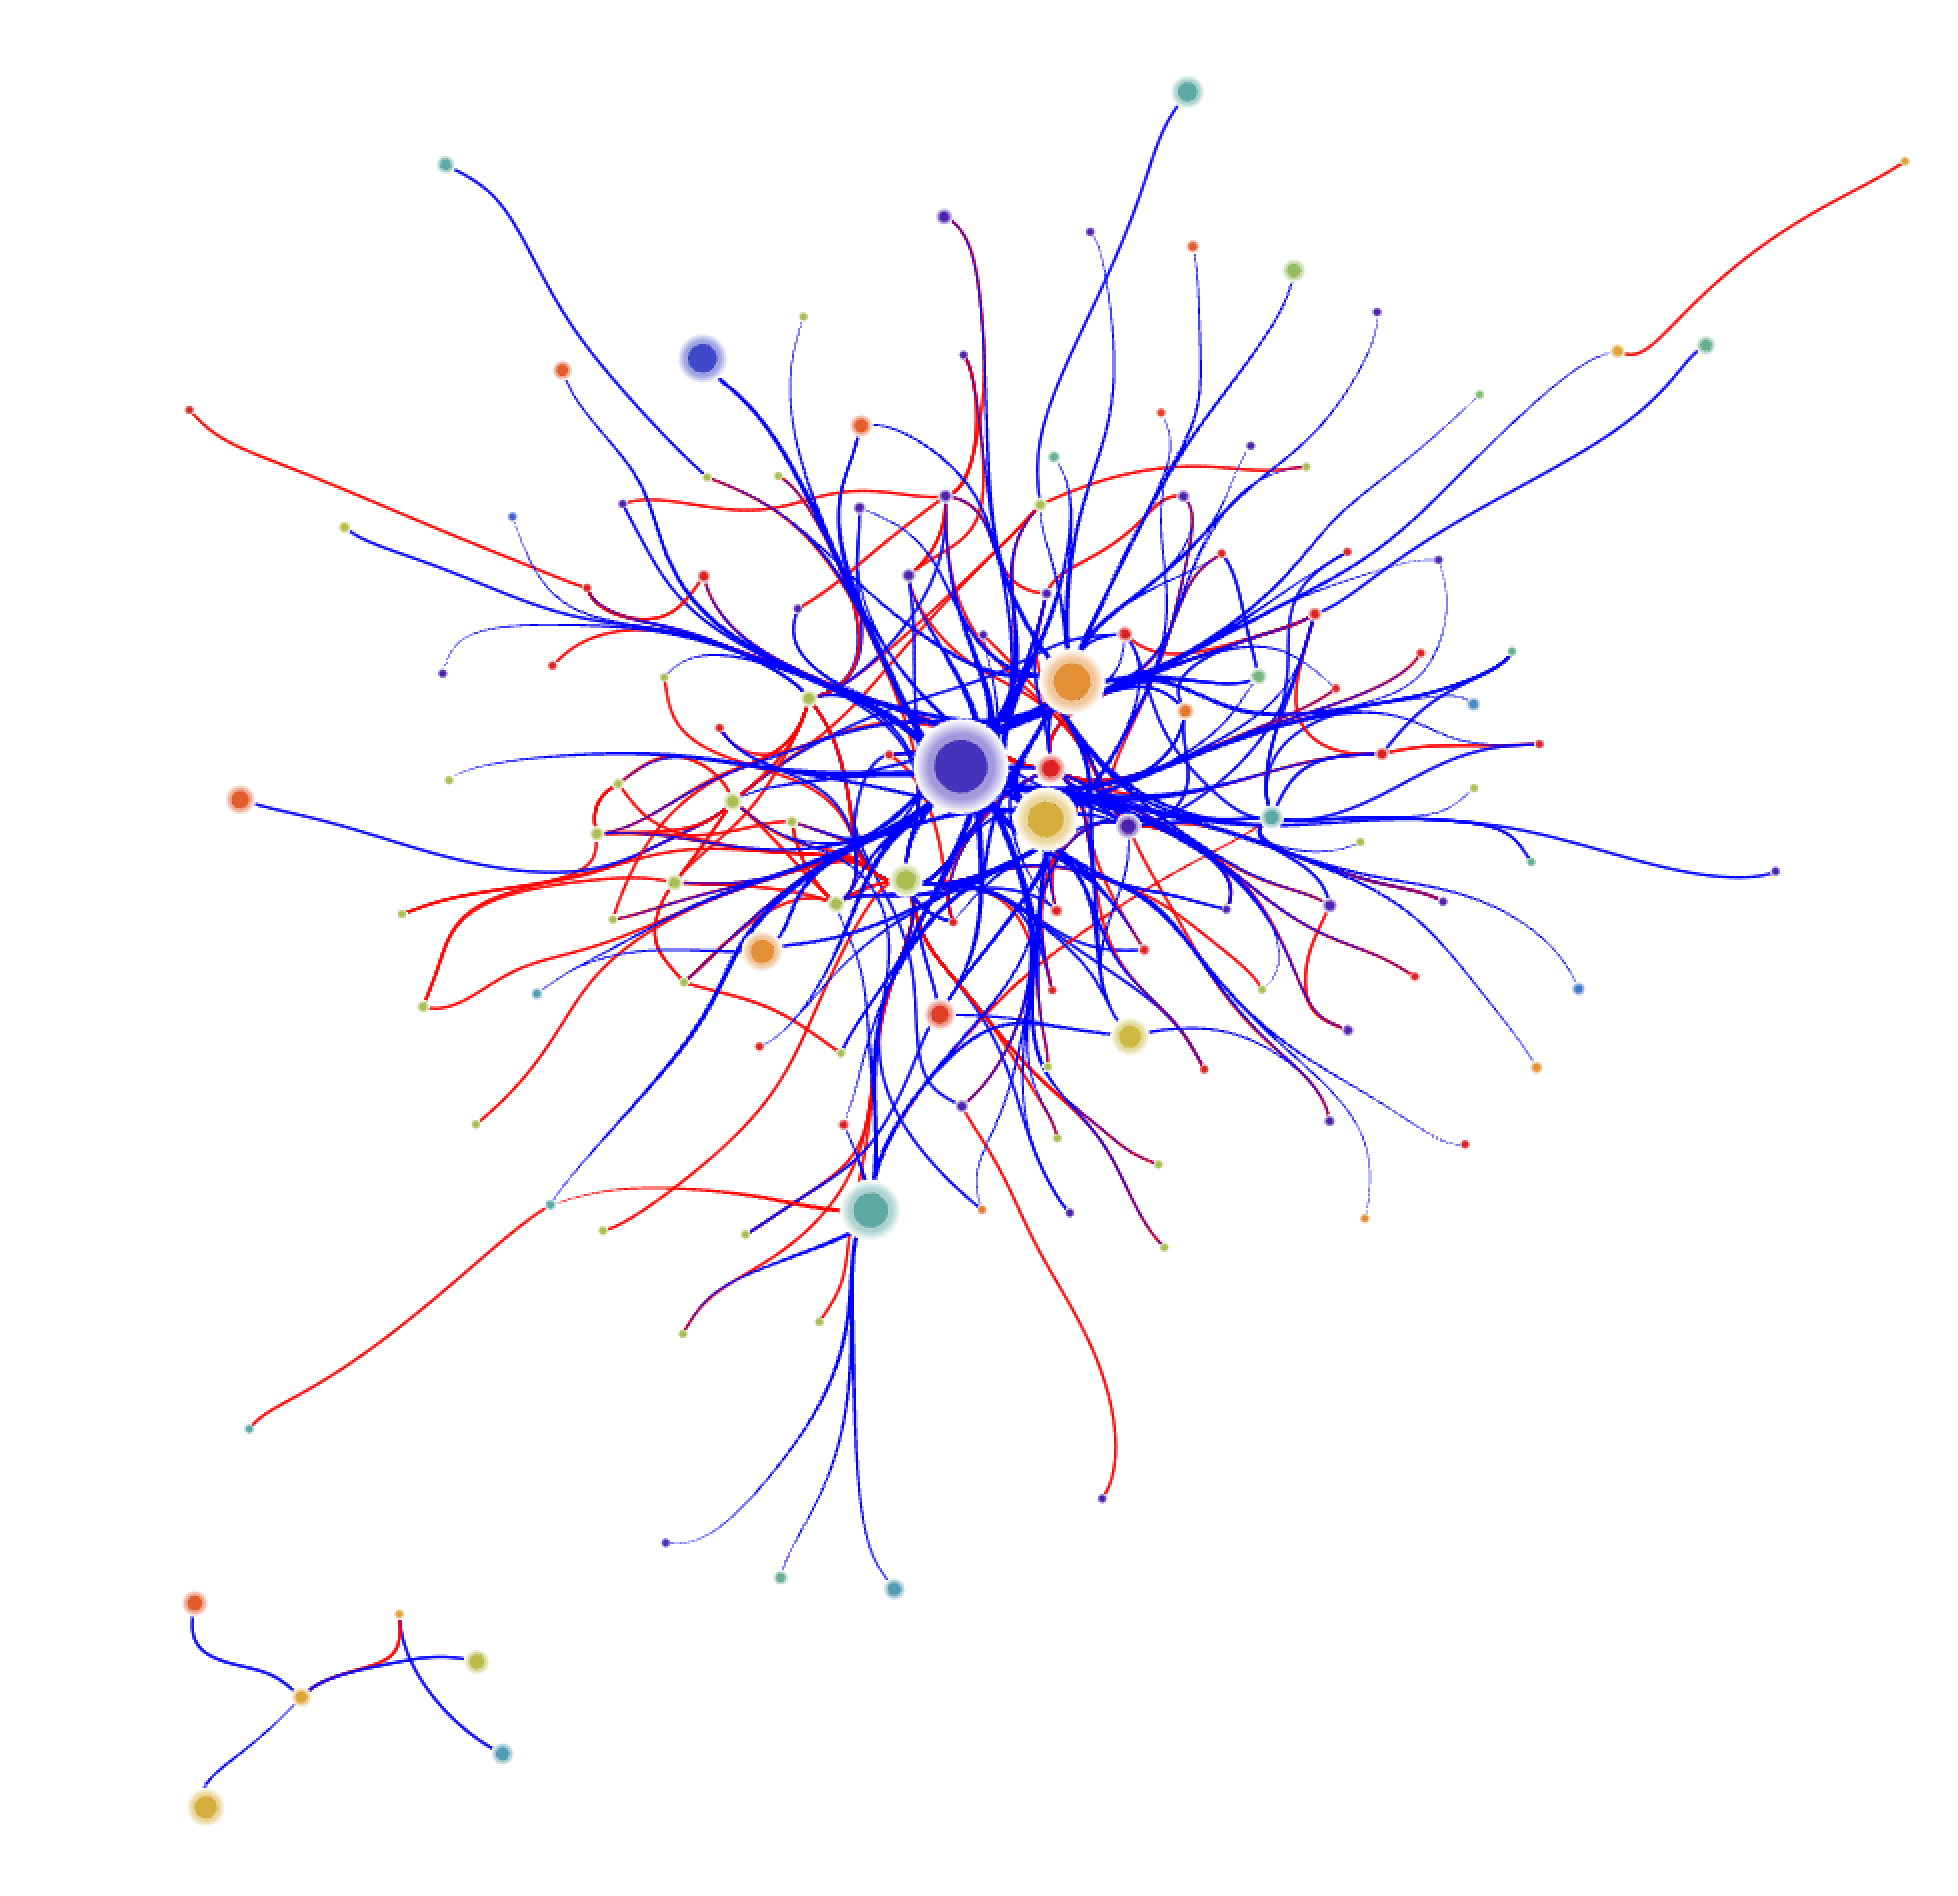
Among these comments, we know that some concern STF, so we can identify them (then the users who are active in STF alongside). If we color the edges in two different ways as follows we can see how the STF the community (in orange) is embedded in the whole ER community (in blue), with rippling conversations that are not in STF but still across STF users.

We can clearly see here how the STF community forms its own group but also, almost organically, takes root in the ER community. More elegantly drawn we get this representation:
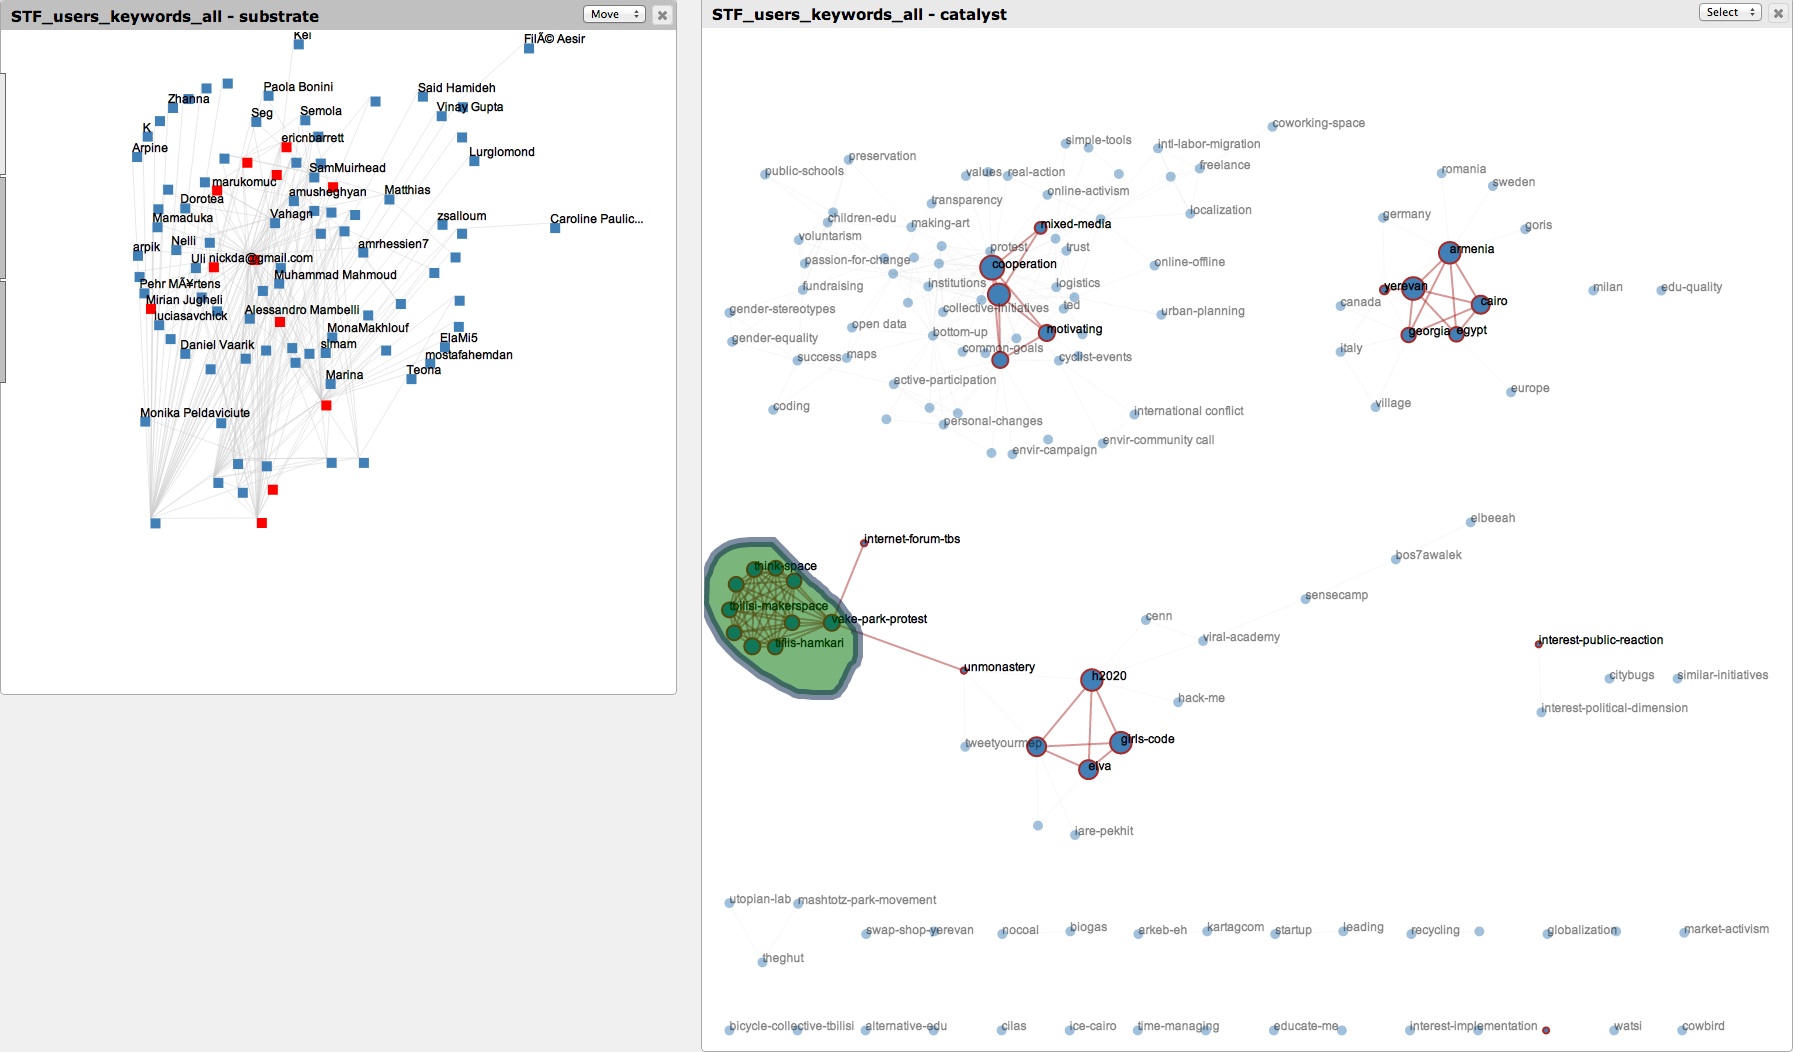
Let’s focus on the STF community
So here is the focus on the STF community
Interestingly, it is divided into two group, the one on top only being about arrivals…
Let’s talk figures
This analysis is built on top of 11119 comments and 2415 posts, the final network draws 501 users with 2797 conversational exchanges. 128 users are involved in STF related conversations, with 384 interactions (35 of which are actual replies to themselves), producing altogether 2791 comments, among which 1319 have been produced since, and 910 are STF-related content. That means 1319 comments are pre- or post-STF exchanges. Now, in the STF community 33 participants have only exchanged discussions with one and only one other participant (most probably a community manager).
Going deeper: ethno tagging
At STF, we are very very lucky to have an expert Ethnographer, @(Inga Popovaite)! Inga’s amazing work enables us to go even deeper into the analysis. Through ethnographic tagging, we can detail the content of conversations. It is a bit like if until now we were looking only at the infrastructure of the conversations (like highways) and Inga’s work helps us to identify which information circulates through these highways, in the semantically most dense way with less ambiguous possible terms.
Just to give a glimpse, this ethnographic tagging takes the shape of a tree for which each leaf helps in characterizing a comment. We have a total of 243 unique tags, across 6 relevant categories (+ the ER category).
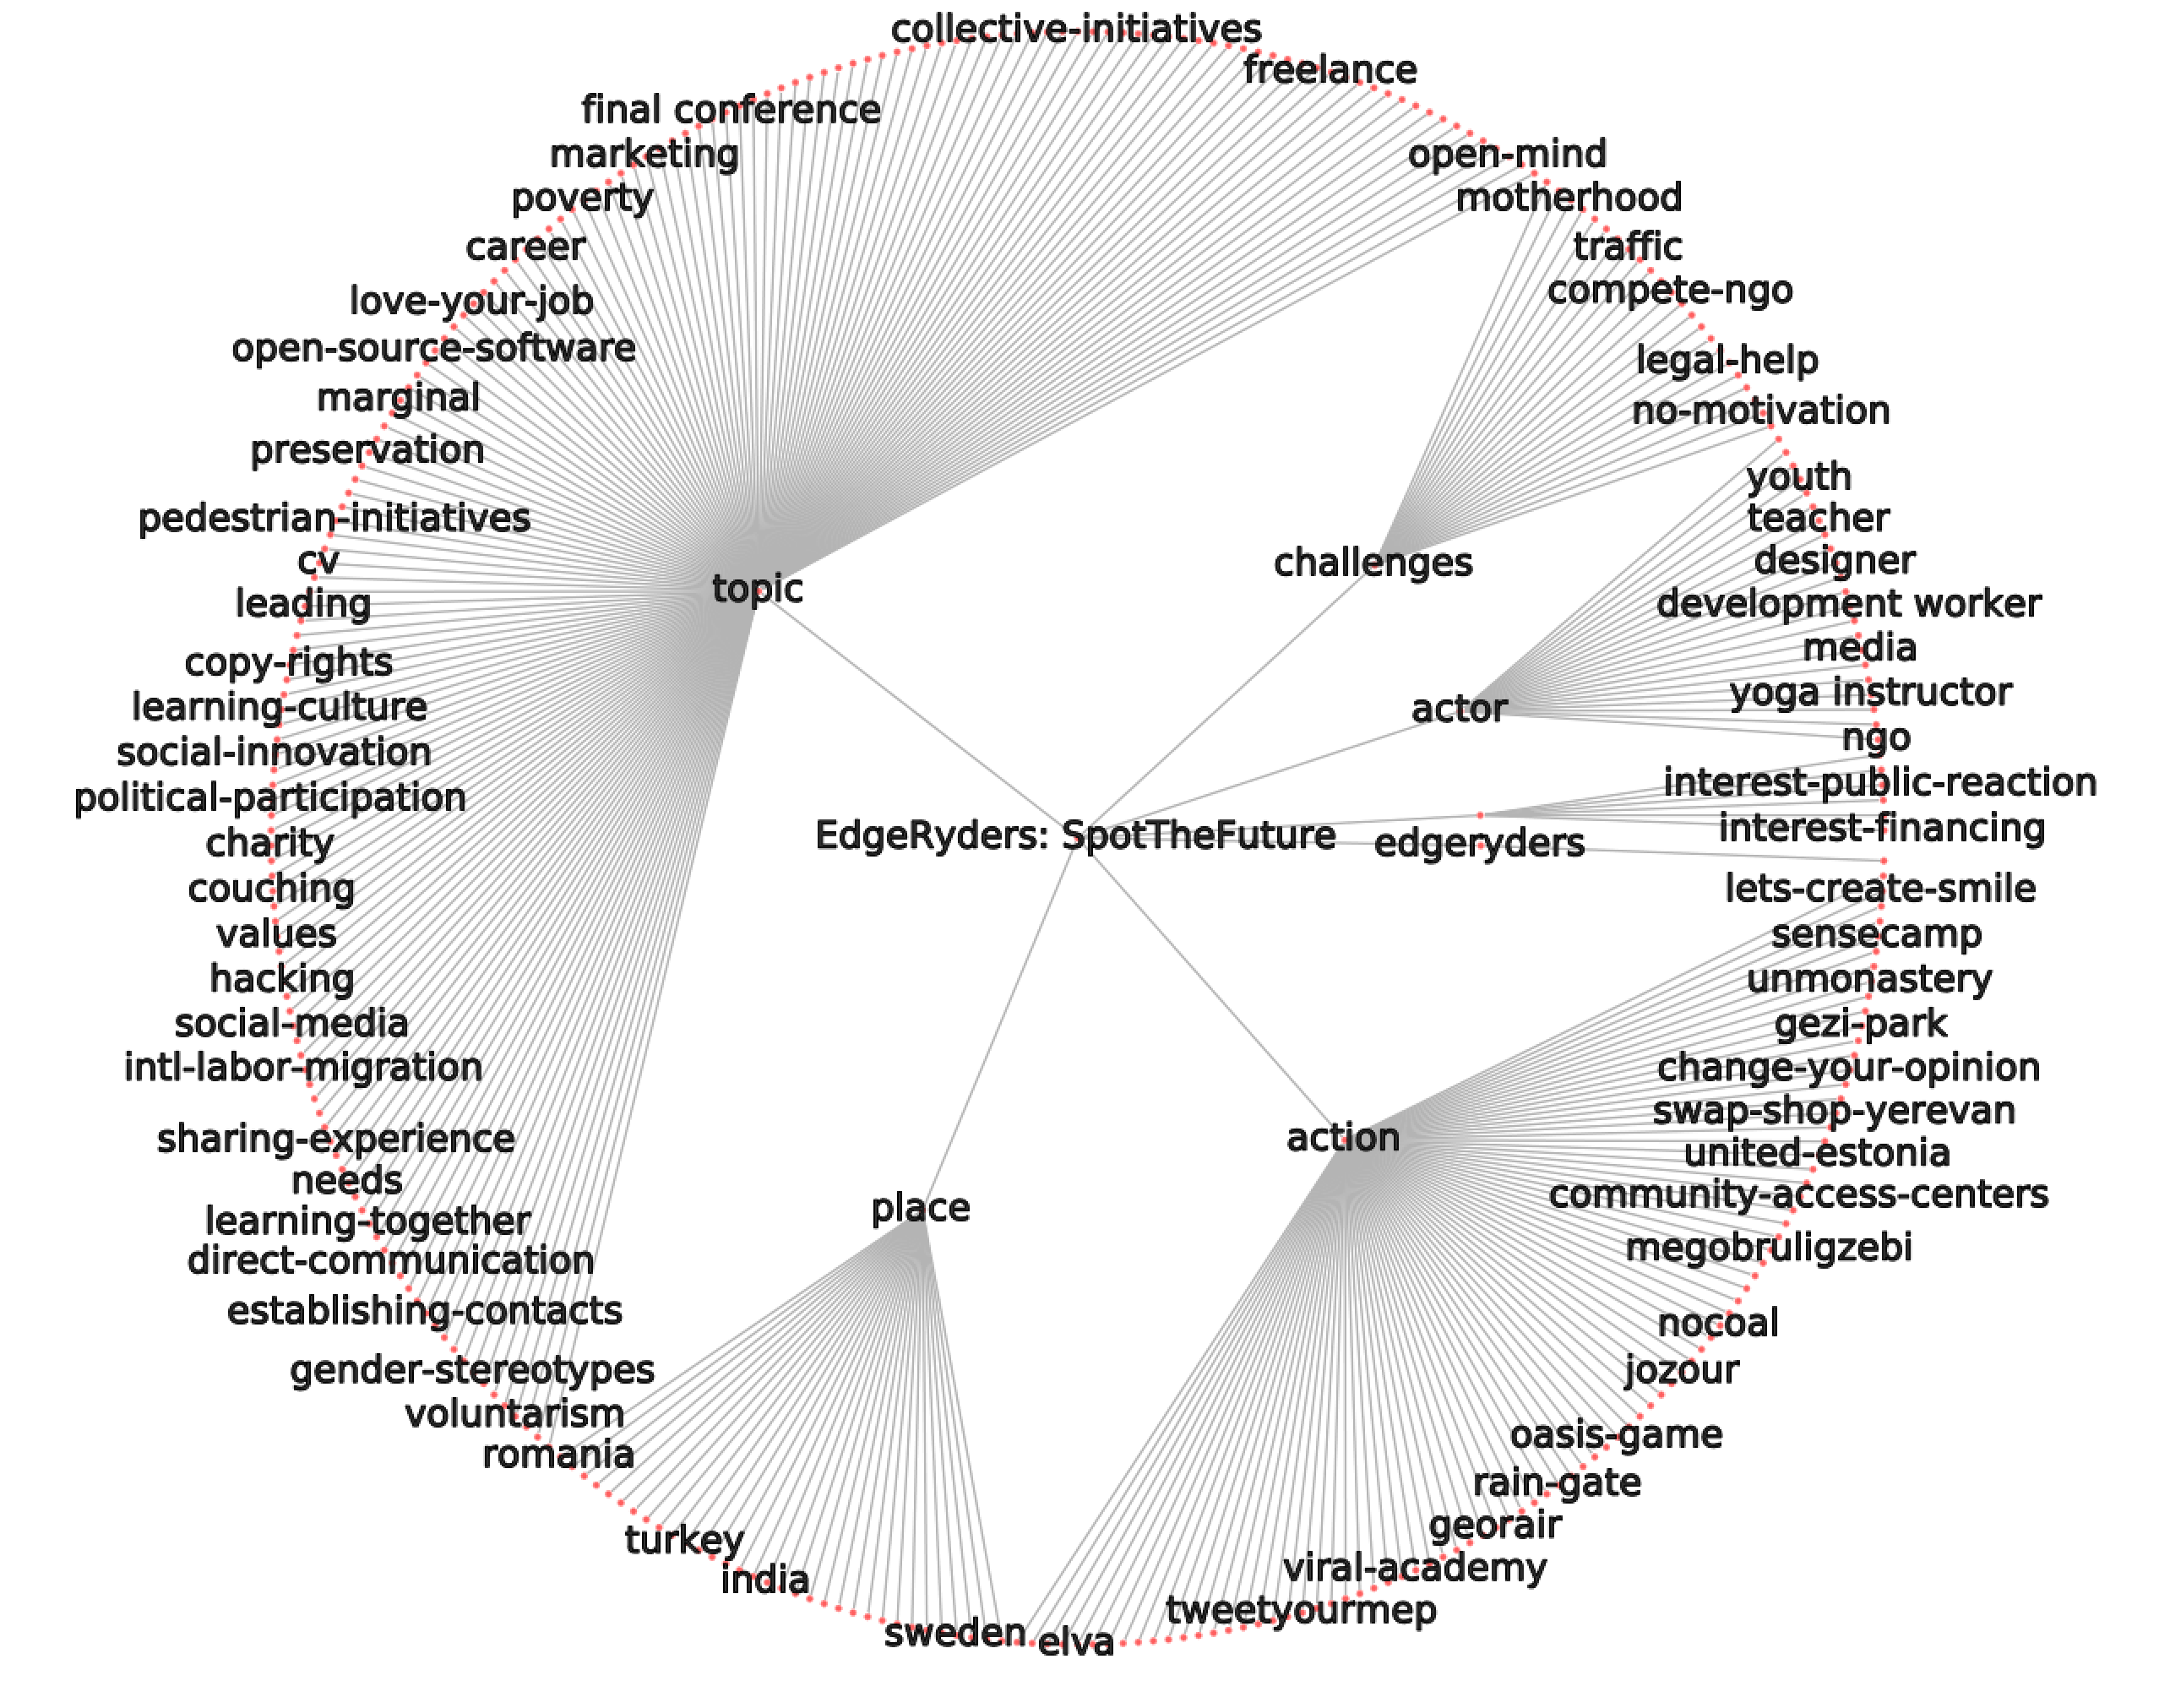
Ethnographically identified, the conversations we can extract will be the real core of the STF activity. And here is the shape of this core interesting network:
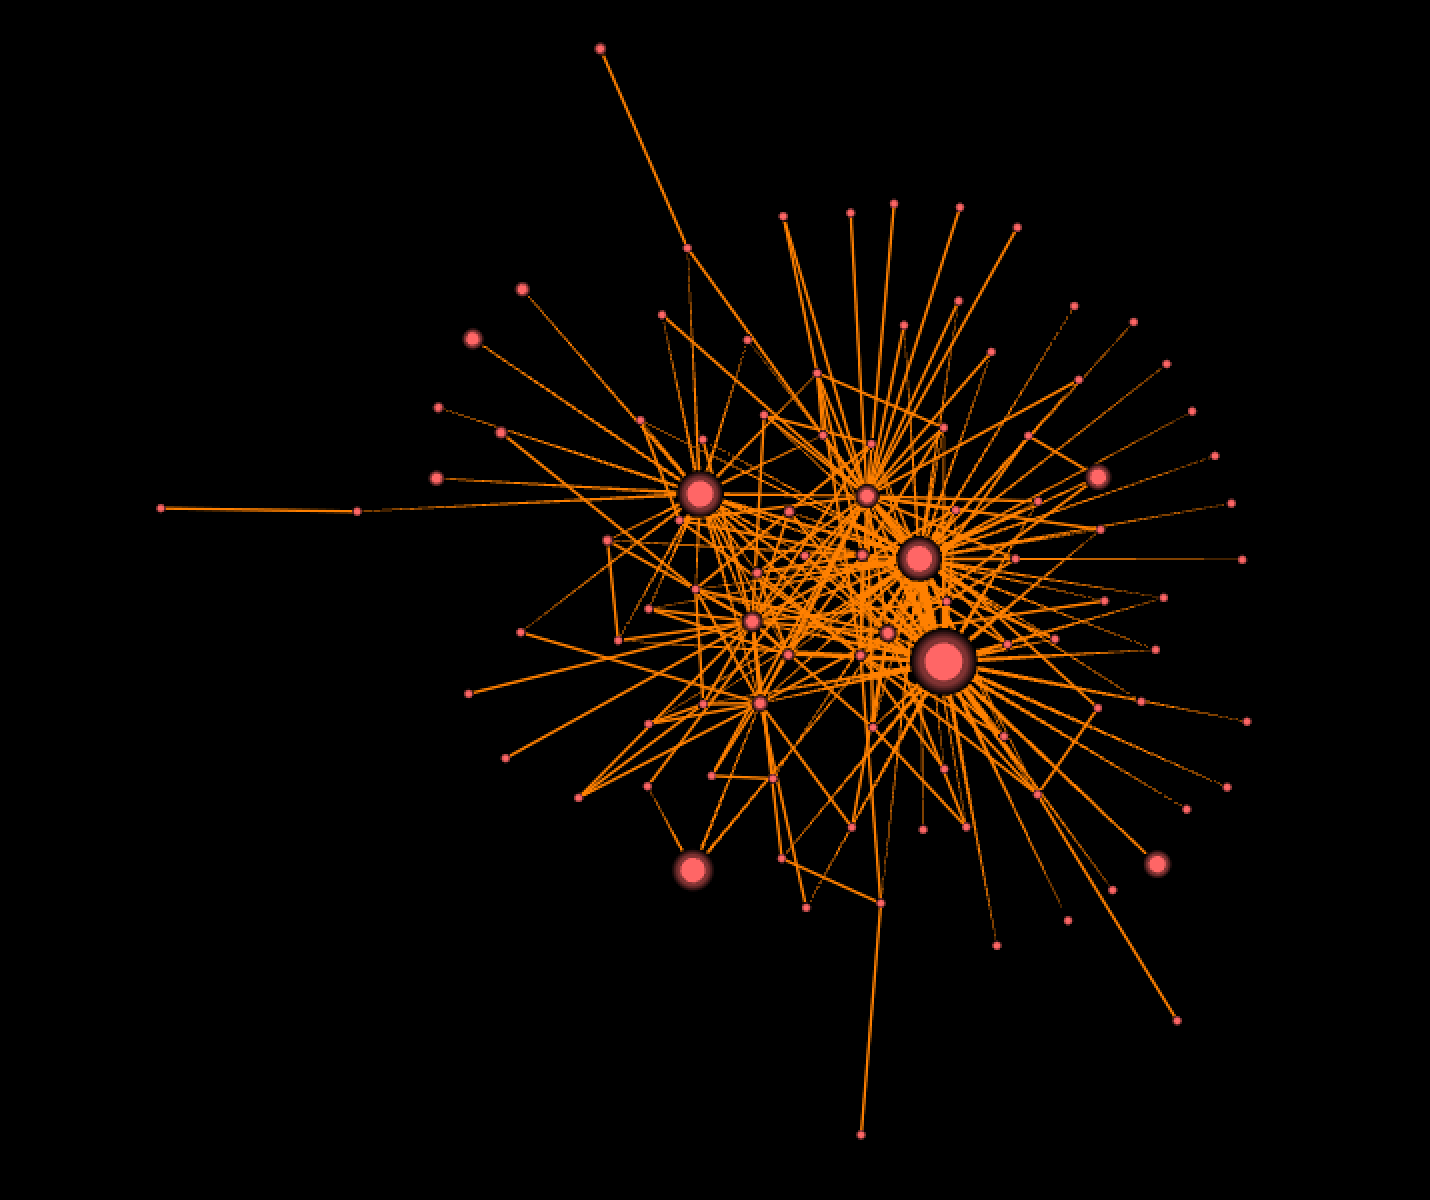
So what are people talking about?
We count in this core activity 95 users, around 255 conversational links, and 718 of the STF comments, of which 22 are self-addressed comments, but surely relevant.
Here is the distribution of the main topics and their occurrence in conversations:
| cooperation | 77 |
| offline-meeting | 47 |
| egypt | 30 |
| armenia | 30 |
| storytelling | 28 |
| georgia | 21 |
| stf-approach | 20 |
| interest-implementation | 20 |
| yerevan | 19 |
| tbilisi | 18 |
| social-media | 17 |
| logistics | 17 |
| cairo | 17 |
| similar-initiatives | 16 |
| govenrmental-institutions | 14 |
| maps | 13 |
| open-source-software | 12 |
| bottom-up | 12 |
| fundraising | 11 |
| active-participation | 11 |
| sharing-experience | 11 |
| unmonastery | 10 |
| challenges | 10 |

and we can also draw the network of overlapping topics:
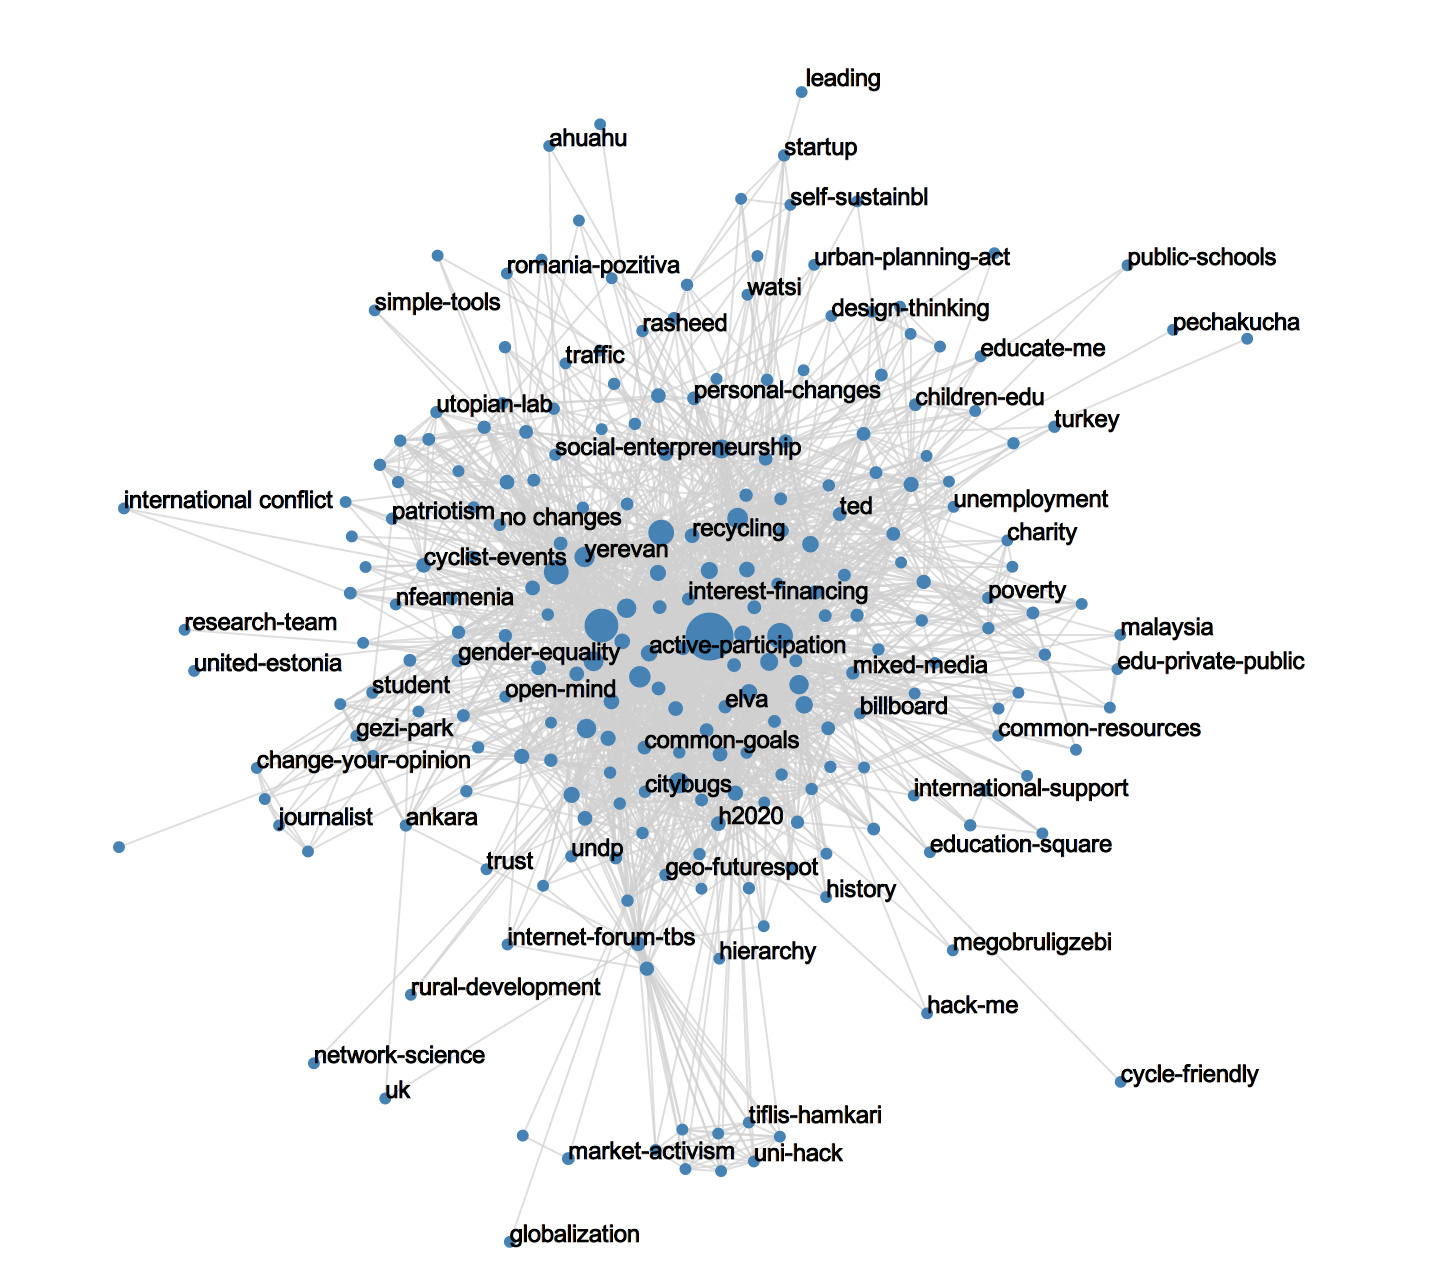
In this network, 2 topics (nodes) are connected when they have been the subject of conversation between at least a pair of users.
Future work in preparation is the analysis of the topic overlaps category by category, for detailed observation. This data also concerns the conversations before the event at Tbilisi and new topics may have risen up since. Identifying key events and studying the different networks before and after are also very promising research leads.
But we want to know more, who are our community’s brilliant minds?
Now that we know what conversations are relevant, we may have a look at the brilliant minds behind them, especially: Where are they from? How does the mediation work? And STF concerns mostly Georgia, Egypt, and Armenia, how does it impact the network? Is it more impacting the youth or the elders?
To do so, we had to enrich the users’ information thanks to participation of the whole community. Here is a very quick analysis of the age distribution.
Localization of participants
In this part, we have enriched (mostly with semi-auto and manual annotations) countries because software are very sensitive to the way we write things. In the end, we have for each participant, a country that represent their participation main localization. Now when two users interact together, we can assume that their respective countries interact together as well.
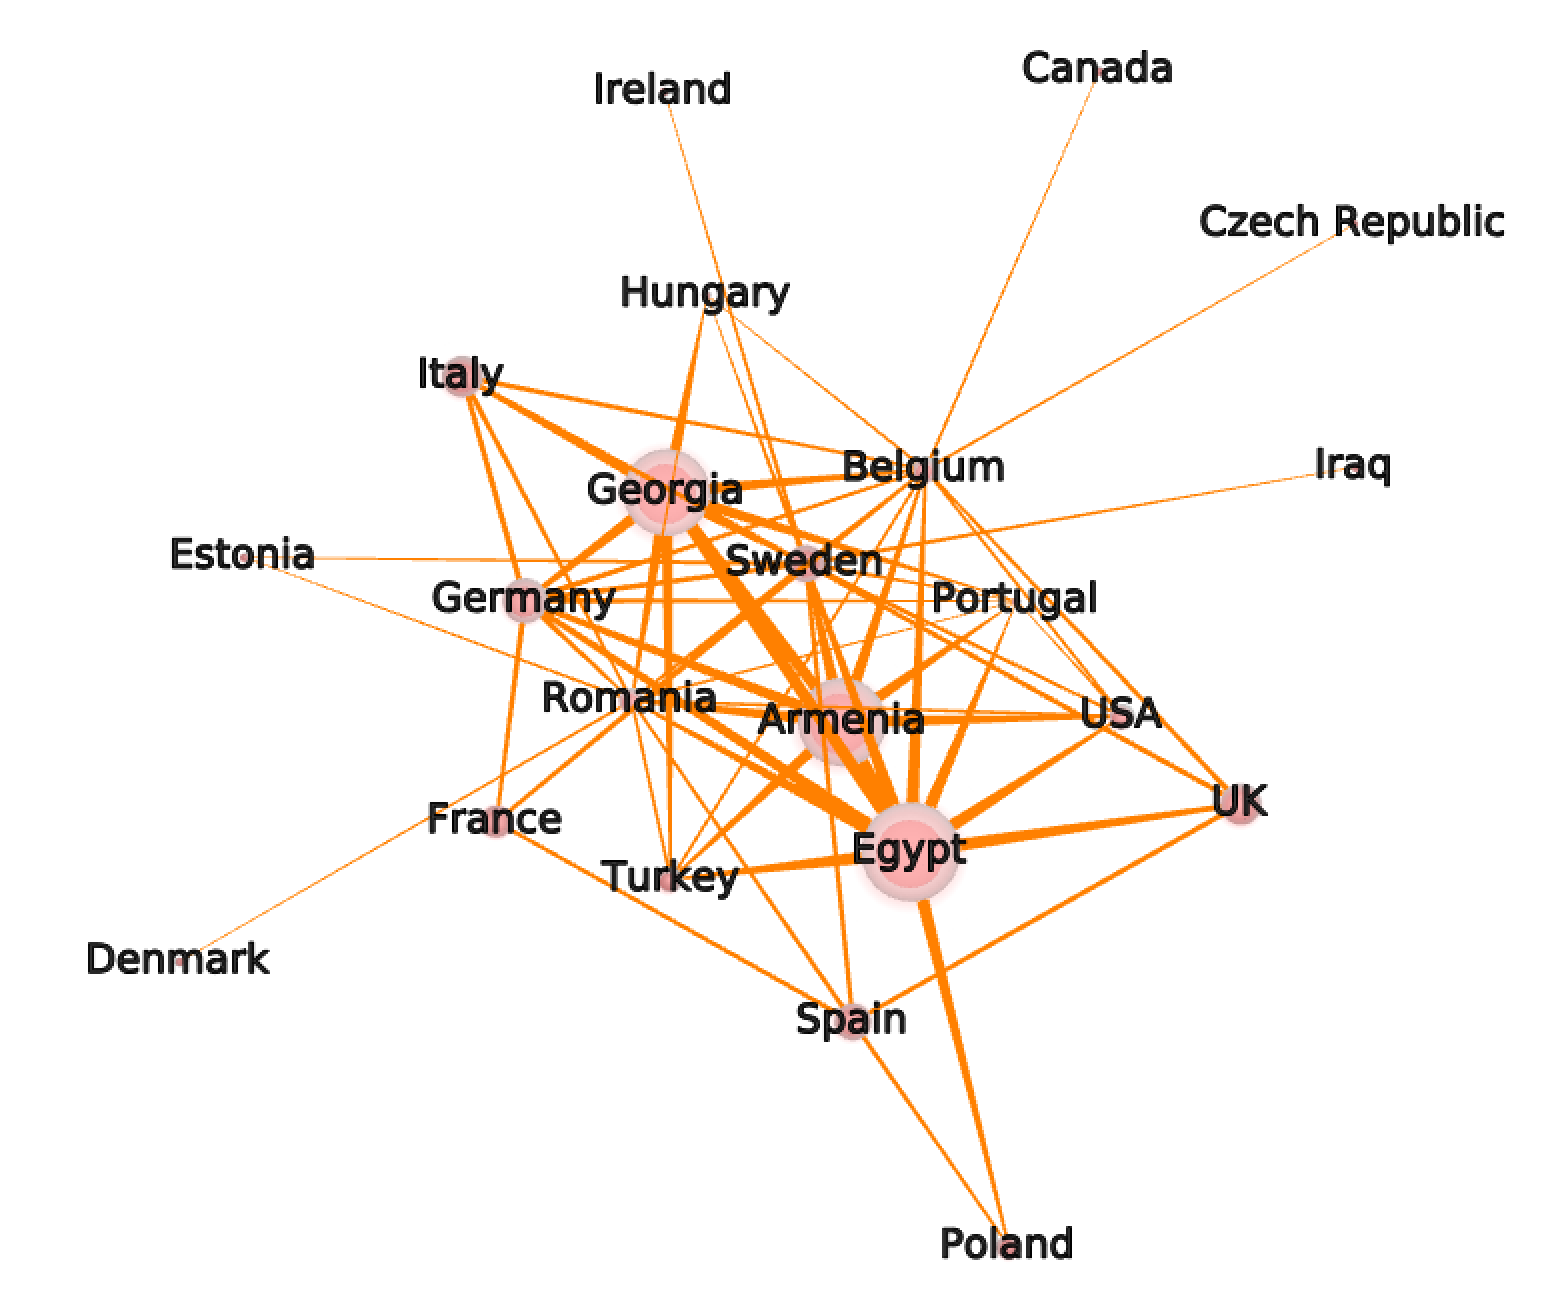
So here is the network of countries conversations, the size representing the number of participant for each country. Without surprise, we see how productive are Egypt, Armenia, and Georgia in STF.
But the beauty of geo-localization is that is can be mapped… on a geo-map! Let’s see the worldwide impact of STF:
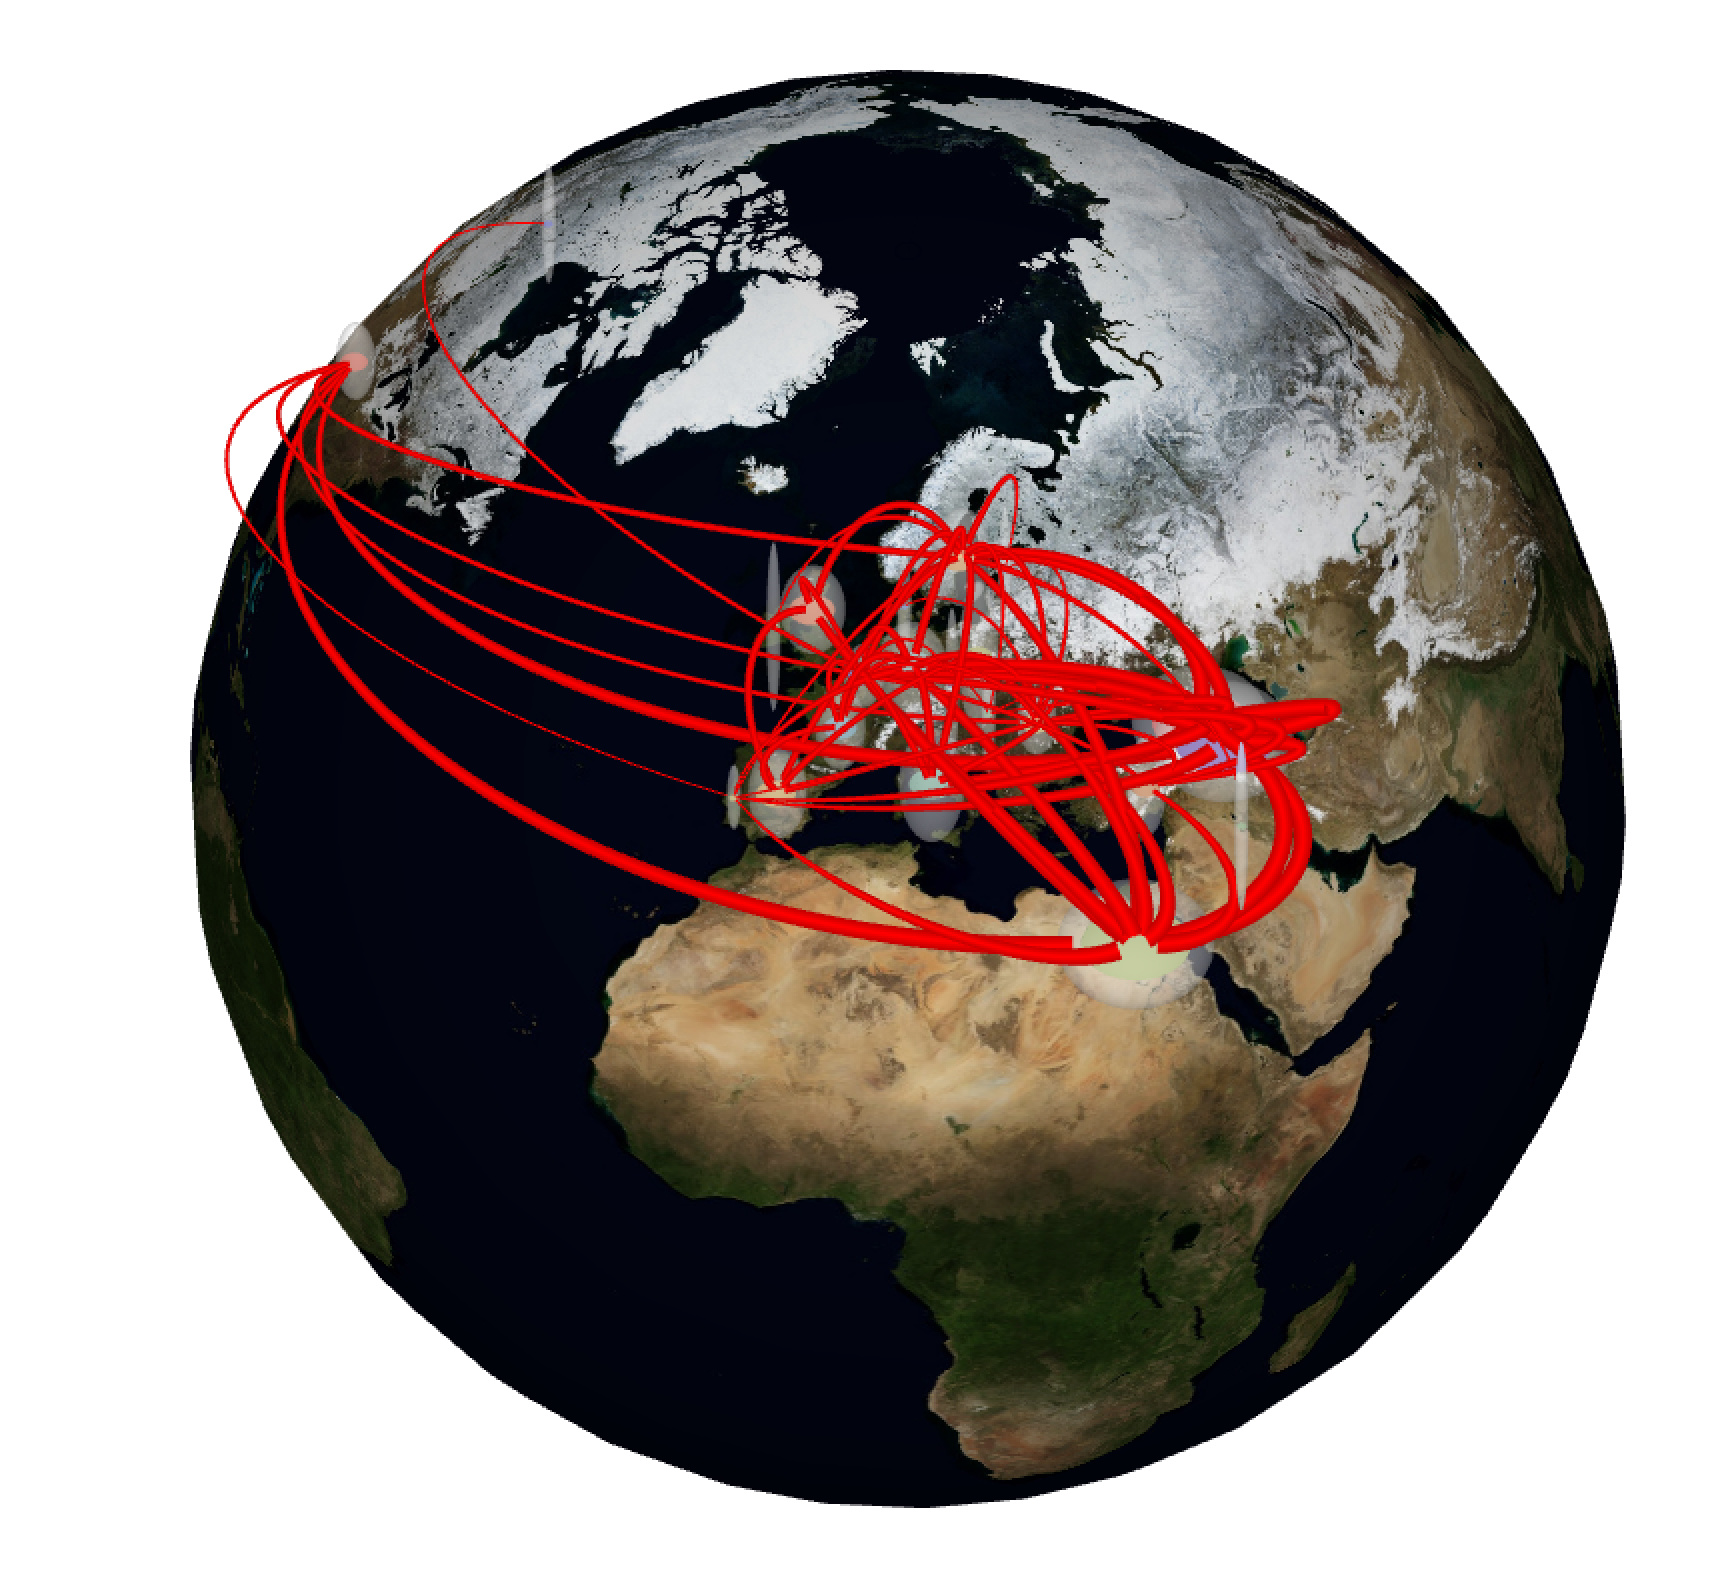
or on a flat map, and focused on the East-most part


Now just imagine if we had actual city locations, the representation may be much much richer, we can see for example how, within a specific country, people interact together (!)
Ok, but is STF a melting pot, or a salad bowl?
To answer that question we need to see how and who interact within each country and between each country. We can for example color code each user according to their country, the links can be colored according to each end user’s country, and maybe reveal some local cluster.
So we actually see some local clustering (especially the green one representing Egypt), but not too much either, color coding doesn’t really really work with that many different countries. However, we can combine different view: the STF community links that involves within country (next in RED) or between countries (next in BLUE) links, and the actual figures.
Which at this point confirms the important role of community managers (mostly the biggest nodes) in collaboration with everybody in the network. That may induce more within countries discussions we see in red, that are less central and more transversal. The only thing we can state for sure, is that the more an STF user is productive, the more (s)he discuss with people from different countries.
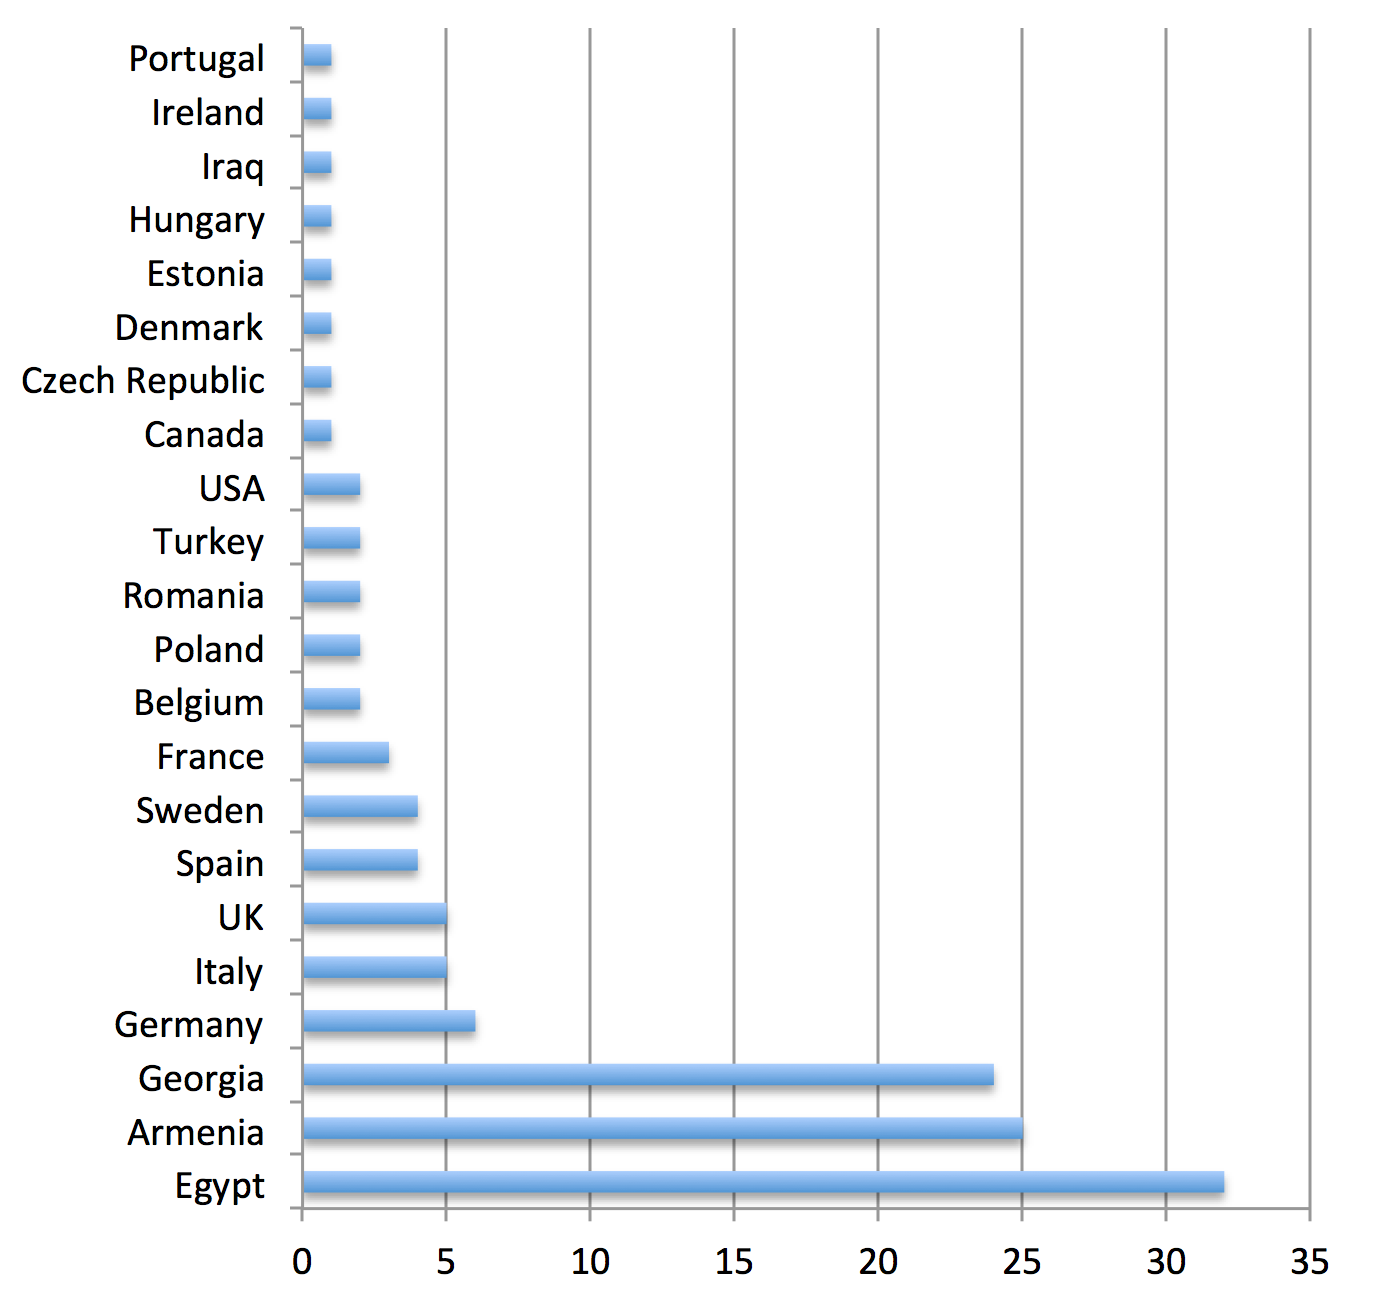
To get more details, let’s have a look at the figures:
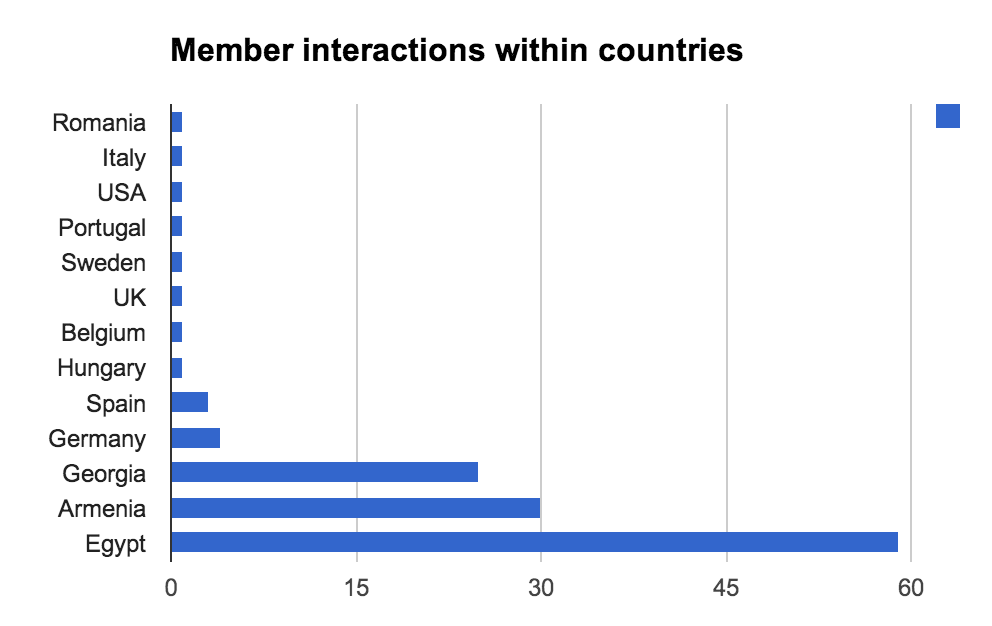
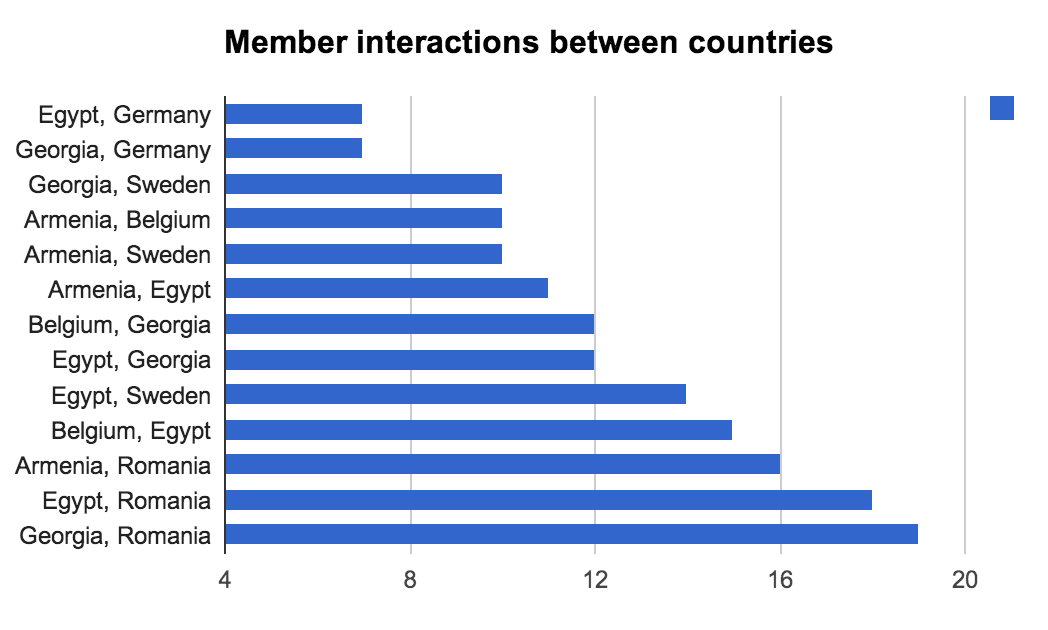
Interestingly we can notice that Romania has an extremely strong influence in the production of inter-countries discussions. The field knowledge of the ER-STF community tells us that @Noemi is the main actor in this production and does an amazing job binding everyone together !
Finally a quick look at the age distribution on the information we have, may state that most of the STF users agreeing to mention their age group are between 21 and 30. (By the way, no answer means the user was not willing to give an answer, and blank means the user has not answer).

The following table states the number of user interactions within an age class, but it does not really help us conclude on this dataset, maybe just stating that for a fairly comparable amount of user between 21-25 and 26-30, the 26-30 class seems to interact even more together.
| no answer | 0 |
| 51 and over | 1 |
| 46-50 | 1 |
| 41-45 | 0 |
| 36-40 | 4 |
| 31-35 | 1 |
| 26-30 | 42 |
| 21-25 | 20 |
| 20 and under | 3 |
| blank | 33 |
Finally…
The perspectives of such a network analysis are very wide. We have presented different approaches that help bring an overview of the community’s activities in a blink of an eye, but we always want to explore deeply this potential. We have open new perspectives on link characterization (ethno tagging), on node characterization (age/country information), and a full knowledge of the community’s behavior will raise through observation of these evolutions over different events in time, and of course at finer granularities!
Some technical extra
So now we can enter the technical details!
All the data have been produced thanks to @Matthias efforts on the ER platform (I’m not sur I’m allowed to list the different views I have used that produced the exploitable JSON files here). The data has mostly been processed using Tulip (tulip.labri.fr) a research software that enables network processing and visualization in Python. I have used in it some geo views, node link diagram views, and mostly python processing. Classical spreadsheet tools such as Ms Excel and Google Spreadsheets are also always useful and handy tools. Further analysis has been developed on support of the tool DataDetangler available online at tulipposy.labri.fr:31497 (contributions welcome !).
Many images extracted can be found here (because of size it’s an outside link): https://github.com/renoust/ER-STF/raw/master/screenshots.zip
Here is the tulip files of the different STF networks (overall data + with countries): stf.initialGraph.tlpx
Here is the tulip file of the ethno tagging hierarchy: EthnoTree.tlpx
Here is a tulip file that stored all the bipartite associations (including groups etc.): stf.bipartiteGraphs.tlpx
Here is a set of DataDetangler files that stores all the multiple associations: datadetangler.zip
A bunch of spreadsheets: STF - Member interactions.xlsx, tags.xlsx
All the code within the tulip files is also stored under an MIT license at: https://github.com/renoust/ER-STF
To know more about network processing and all we can do about it, you can always visit my website (http://www.labri.fr/perso/renoust/)