(pictures album here)
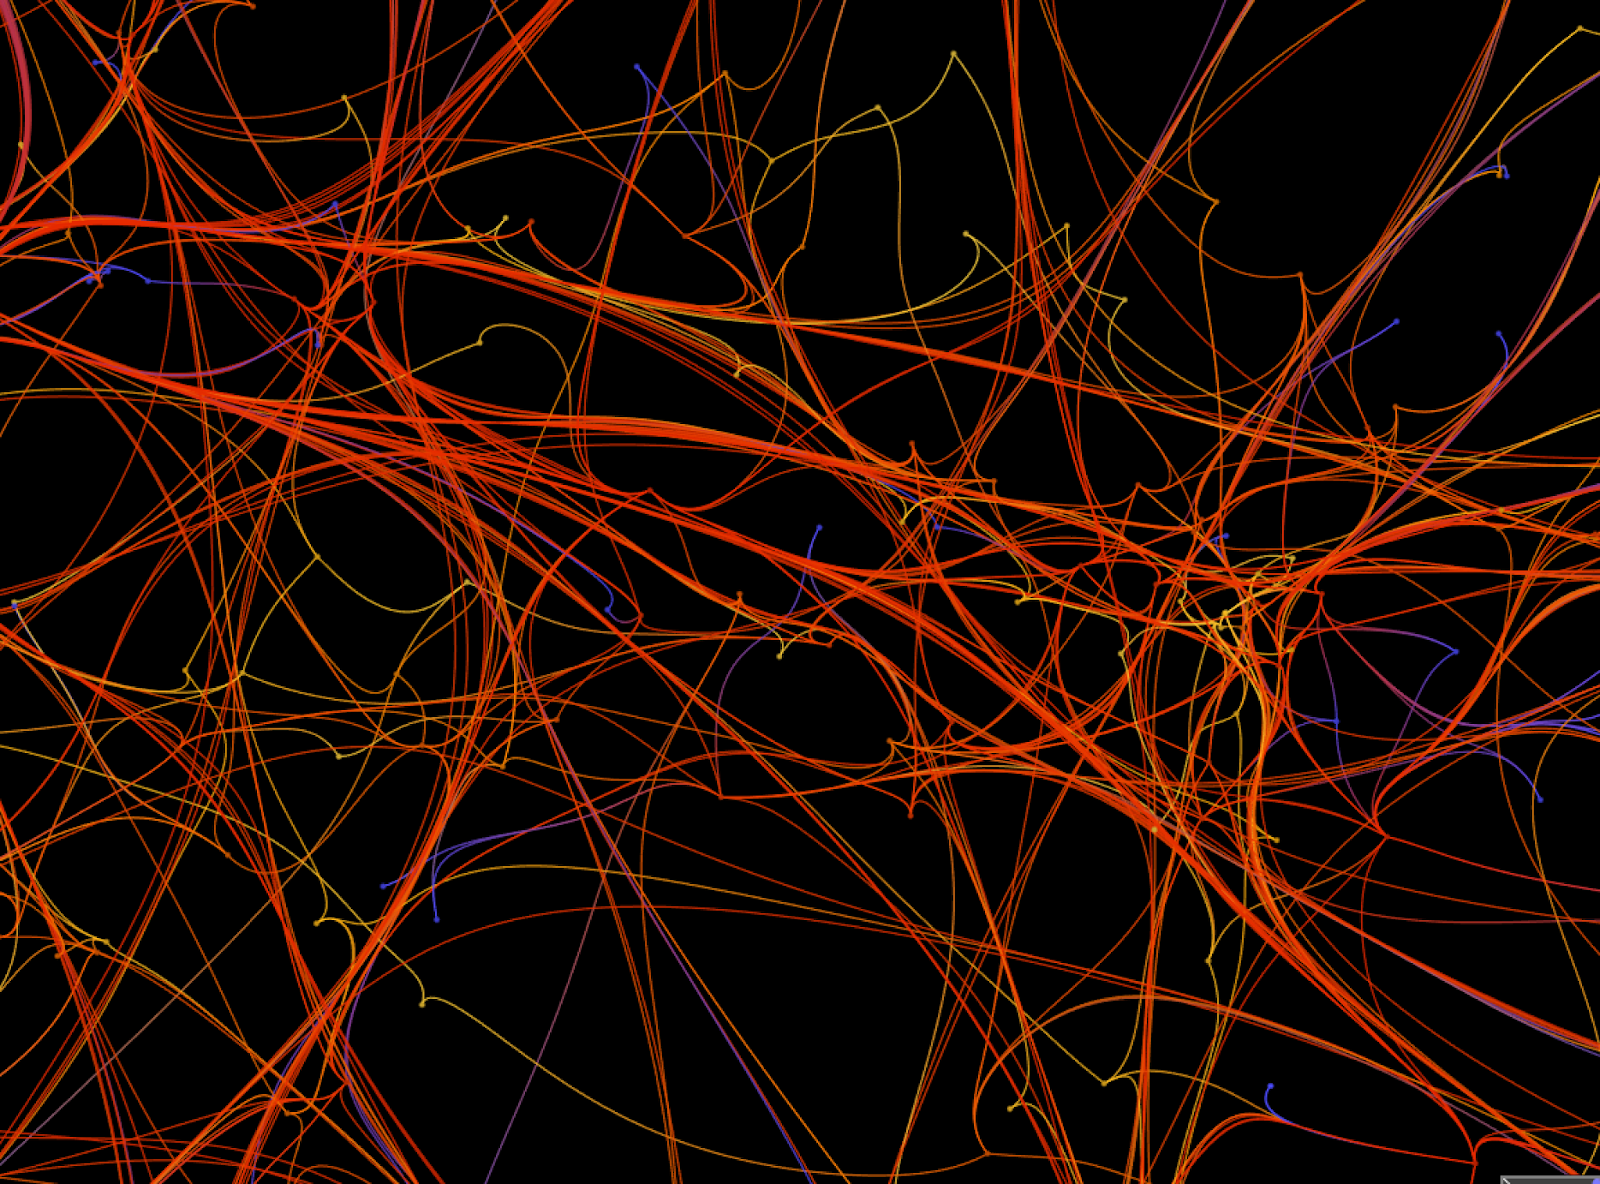
Figure 1 - A view at heart of the twitter nebula
When organizing an event, we can reach out using Twitter, but what is at the heart of these Twitter discussions and on what’s the (new?) definition of a community in the twitter space?
We try to describe in this document a study of an analysis of Twitter, with a top-to-bottom approach: from the top-level general questions around the idea of a community we drill down to the bottom-level data gathering, analysis, and finish with visualization of the data.
Through this document, discussions with experts has redefined the notion of community along three different axes and analyse our twitter communities around these axes.
The document presents first the highest level questions we have wondered on this Twitter community, then the data gathered, followed by the ground baselines on which we’ve looked at communities, and finally the analysis.
The question
So we’ve gathered many experts, our Masters of Networks (Community Managers Lee-Sean Huang, Noemi Salantiu, Laura Manconi, Rosa Strube and Collective Intelligence Researchers Marta Arniani, Yannis Treffot, Benoit Gregoire and Network Scientist Benjamin Renoust).
The first idea was to find the many questions that we can build around the Lote4 twitter community. The main idea was to identify first if and how a Twitter “conversation” around a hashtag can form a community?
One of our assumptions is that we can find that there are lots of isolated components in a Twitter hashtag stream, with people not really calling out to each other, whereas “tight” online community gives rise to a giant component that most of the nodes are connected to. Can we confirm that from a data perspective?
Another assumption is that people could easily form subgroups investigating specifics, and how we can find traces of, or understand the content gathering these subgroups?
The data & context
To that purpose, we have analyzed twitter data made available during the MoN3 event.
But before talking about the data itself, we may mention some contextual information on how this data has been captured.
This data represents Tweets collected between 18/10/2014 and 23/02/2015, this data has been gathered from the search query “lote4 OR edgeryders OR unmonastery OR Matera” by @piersoft using TAGSExplorer.
Lote4 stands for Living On The Edge, a conference organised by the Edgeryders global community which took place in Matera (Italy) between the 23rd and the 26th of October 2014. The unMonastery was an artist and hacker residency program that Edgeryders ran in Matera during most of 2014; the Lote4 conference happened in the unMonastery building and with the help of the unMonastery events. The search string was expected to catch all tweets around the event taking place in Matera and their follow up over subsequent months.
Organizing the event, we expect authors such as Edgeryders and Matera2019 to be sort of moderators of the event, and to engage other twitter users from their own networks in driving conversations among the different participants.
The collection is composed of about 20k Tweets written by 7000 people involving another 1000 additional people (via mentions or RTs).
The data has information on who sends a Tweet, eventually whom the Tweet is sent to, who is mentioned in the Tweet, the date and which hashtag has been used.
The notion of community
We need to step back a bit here and question ourselves on what makes a community a community. Social network scientists such as myself have preconceived established notions of what makes a community in terms of data analysis, but they all end up being empirical and somewhat fitting well in the boots of data analysis. Two main definitions might be recalled, the first one would come from Manski, for whom the group effect builds from gathering people alike (translated in data processing this would mean similarity of attributes). The second definition is used as a support to compute the Newman’s modularity, states that a community has much more relationships between members within itself than with other members from outside the community. Discussions led by our panel of experts has pushed even further the different definitions of the notion of community.
We’ve tried to bring different perspectives on the notion of community, by asking these questions “what does it mean to be a community? what does it mean to belong to a community? what does it mean to look at a community?”.
We gathered many answers which faceted a bit the notion of “community”, into three main categories, and we’ve also discussed some other interesting characteristics of communities.
|
Awareness |
Exchanging/discussion |
Action |
|
Sense of belonging/endeavor inner sense of belonging sharing of interest some commonalities publish on similar twitter hashtag gather around specific goal share content |
People talking to one another exchange in the community (both ways) |
follow the same people / sign petition actually meet / community of practice people who do more than what they need to/have to behavior, can be negative engagement |
|
Other characteristics |
||
|
groups = set of people transversal to existing organization classes of communities hierarchical over time can fuse or divide somebody who’s not in the community (the rest of the world) |
Table 1 - Summary of different characteristics a community can have
Our experts have extracted 3 levels that define a community from this point:
- the awareness
- the exchanges/discussions
- the action/actual engagement
Community in Twitter
The next step is to reconnect these notions of a community with evidences we can find in the data. In other words, what does “awareness”, “exchanges” and “engagement” mean in the context of Twitter publications?
In the world of Twitter, someone’s awareness can be measured by the semantics these people use, i.e. the hashtags they use in publishing so we can measure how often these keywords appear, the number of other users who relate to the same semantics, and the presence of our users and their posts on different platforms.
Sharing and exchanging between users is the basic purpose of such a micro blogging platform. This type of interaction can be represented in the world of Twitter by mentioning somebody or replying to somebody: it never means that an actual engaging conversation is going on, but it initiates potential collaboration.
Other measures can be of interest in tracing the interactions within a community (well, when the community is defined already). The number of connections (following, followers) of a user, their amount and frequency of posting, and the impact of the posts: how do others in the community endorse the posts? does it generate spin offs? all within the community, and out of the community? How to measure this impact? of each post? of each individual?
The network of practice in the material engages people in meeting and actually doing things together, working toward a common goal. We could find traces of physical presence, at events for example, of people from the geocoding, the hashtags they use, when related to an event, or via cross platforms activities such as FourSquare. Unfortunately these indications are not really reliable when confined to the sole Twitter information. Engagement on Twitter can take different shapes, it can mean reciprocal interactions, with the production of content and maybe some spin off actions. One reliable action on Twitter is the construction of actual conversation between people, meaning people replying to one another, reciprocally not only broadcasting information, or commenting on shared interest but real conversations.
Among the other characteristics of a community discussed, the most interesting would probably be the influence of time on the group evolution (fusing/dividing), but we’ll keep these aspects for a different analysis.
Notice that we have yet taken the “RT” or “retweet” relationship out of the picture as it is a versatile information. This action is the easiest and most represented action of the Twitter universe. The act of retweeting can bear two different meanings. It first helps showing your interest, people retweeting similar posts are show similar awareness, but it can be either positive or negative engagement. The number of retweets can weighs actually the tweets, because when a tweet has been retweeted a lot can be considered as “impactful” or just popular.
The analysis
General analysis of the Twitter data
So the dataset is composed of ~20,000 tweets gathered from the query string “lote4 OR edgeryders OR unmonastery OR Matera” between 18/10/2014 and 23/02/2015, published by ~7,000 different authors, involving 8,000 people including mentions and replies, and referring to over 6000 hashtags.
Here is the production of tweets, we can clearly see a few activity peaks around the event, first during the period of preparation, before the actual event, then during the event.
The tweets also peak around half November, and more activity can noticed between the end of December and the beginning of January.
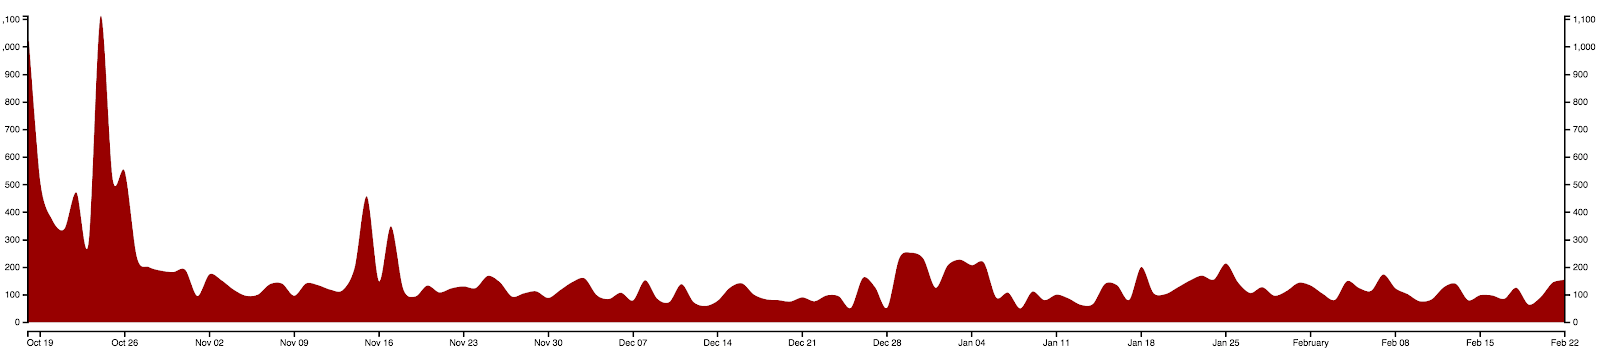
Figure 2 - The production of tweets over the period of capture
Among the 7000 authors, only 42 have produced over 50 tweets in the period of time, and 18 users have only retweeted information, about 850 more have published over 5 tweets in this period of time (and actually 200 are only retweeting information).
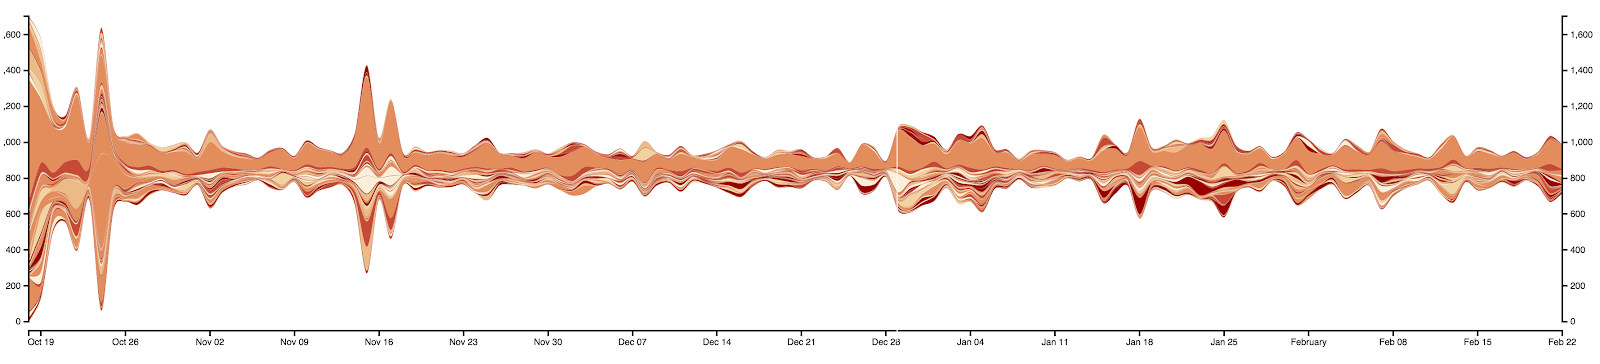
Figure 3- Occurrence of hashtags over time. Of course, matera is the most occurrent over time in the dataset. Spikes correspond partly to #btwic2014 & lote4 (before Oct. 26) #saleritana, basilicata #matera2019 #mendicino (from Nov. 02) #labuonascuola #vivoazurro #under21 #matera2019 (around Nov. 16) #capodanno #genova #neve #matera2019… (end of Dec, early Jan.)…
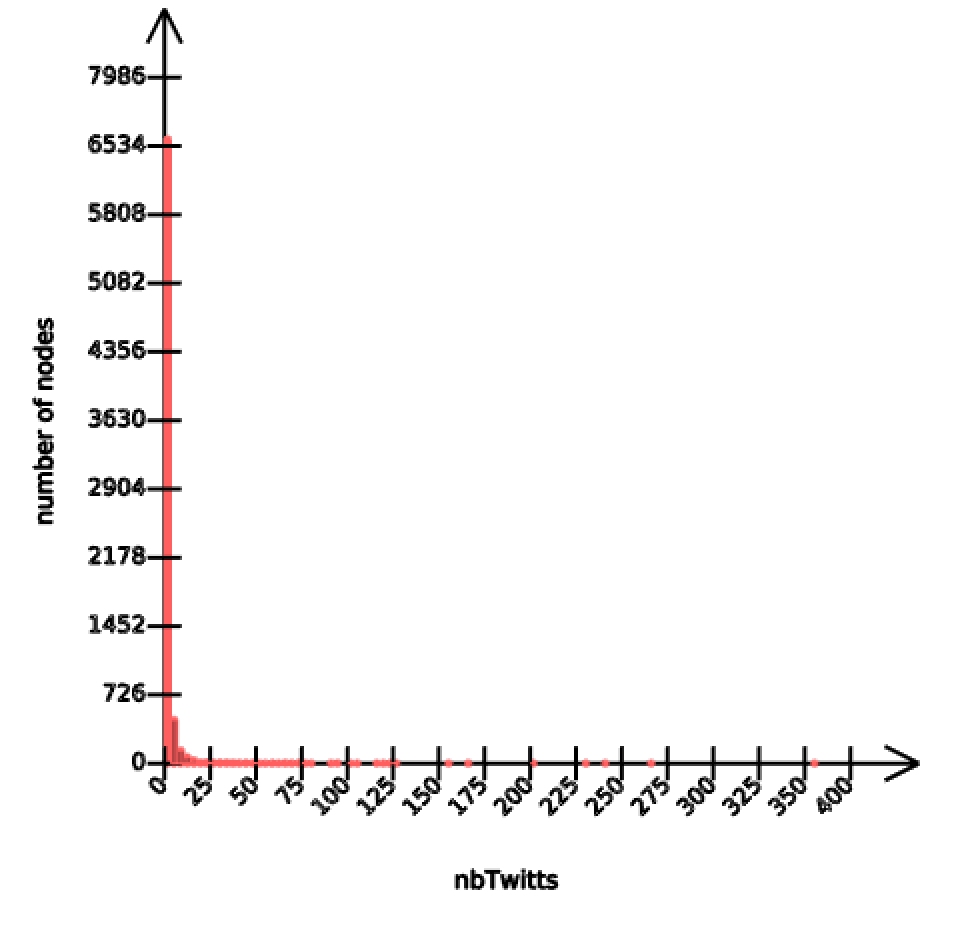
Figure 4 - Distribution of users (nodes) per number of tweets produced
So retweets generate a background noise and we’ll keep them apart for a secondary analysis.
When we remove the RTs, we can consider a total of 4500 twitterers replying and mentioning each other.
The network they compose is very disconnected, and half users captured here discuss in small groups of at most 10 people, producing each very little tweets. However the other half users (around 2100) are involved in a gigantic twitter conversation.
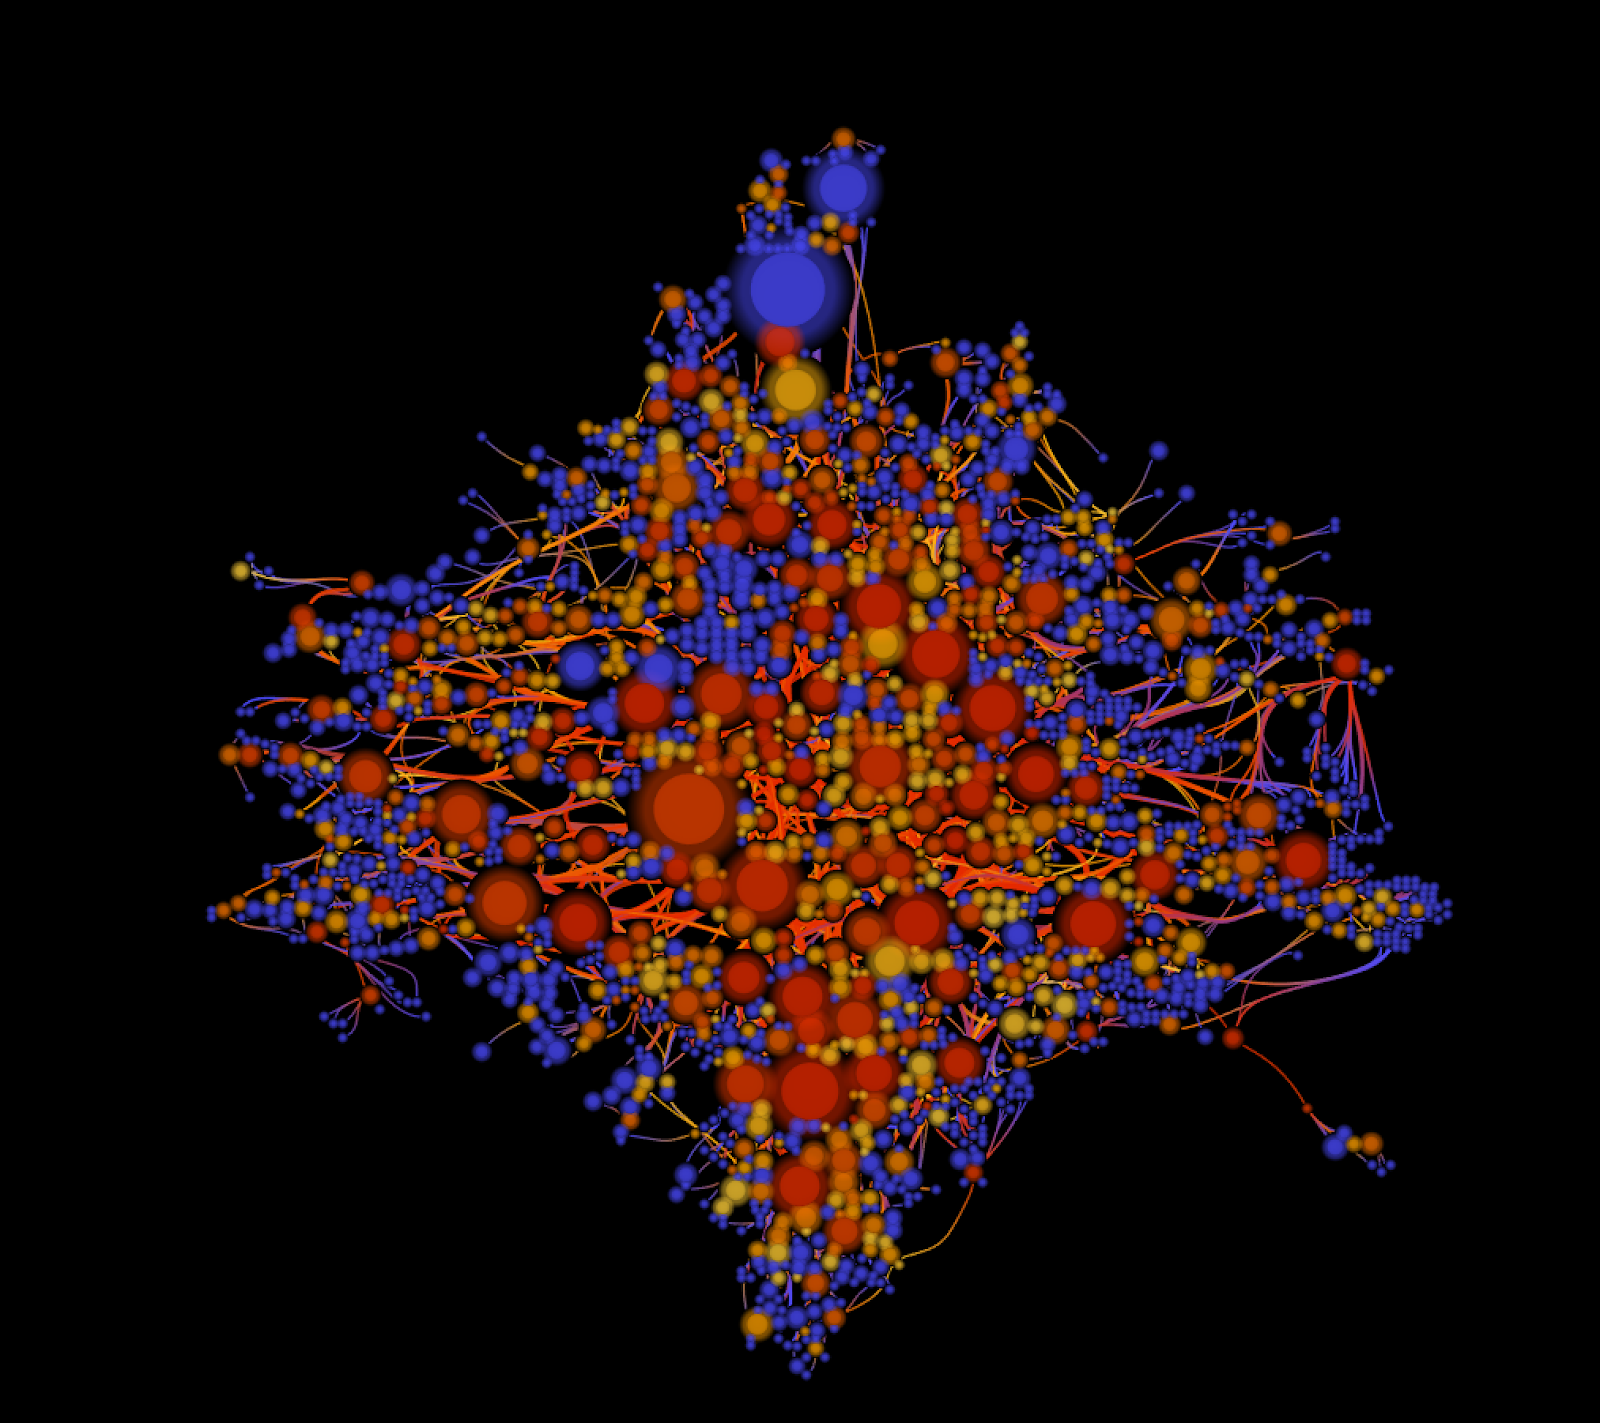
Figure 5 - The main connected component of twitterers, each node is a twitterer, each link a reply or a mention between two twitterers
2100 twitterers discussing about Matera, Lote4 and many other things. The size of a node is the number of tweets produced in the collection, the color of a node is its centrality. An edge means a direct reply and/or mention between two users.
Communities in Twitter: drilling down to the heart of the community
Following the previously defined criteria, we’ve tried to define how is this community composed around the twitter hashtags, mentions and replies. Because we’re looking for the strongest evidences of “communal” behaviors between twitter users, we advanced quick towards traces of engagement between users. We have therefore considered first the “reply” relationship between users, and we’ve drilled down to only 500 of the 2100 users who are actually replying to each other in a big conversation (1600 are involved in small conversations).
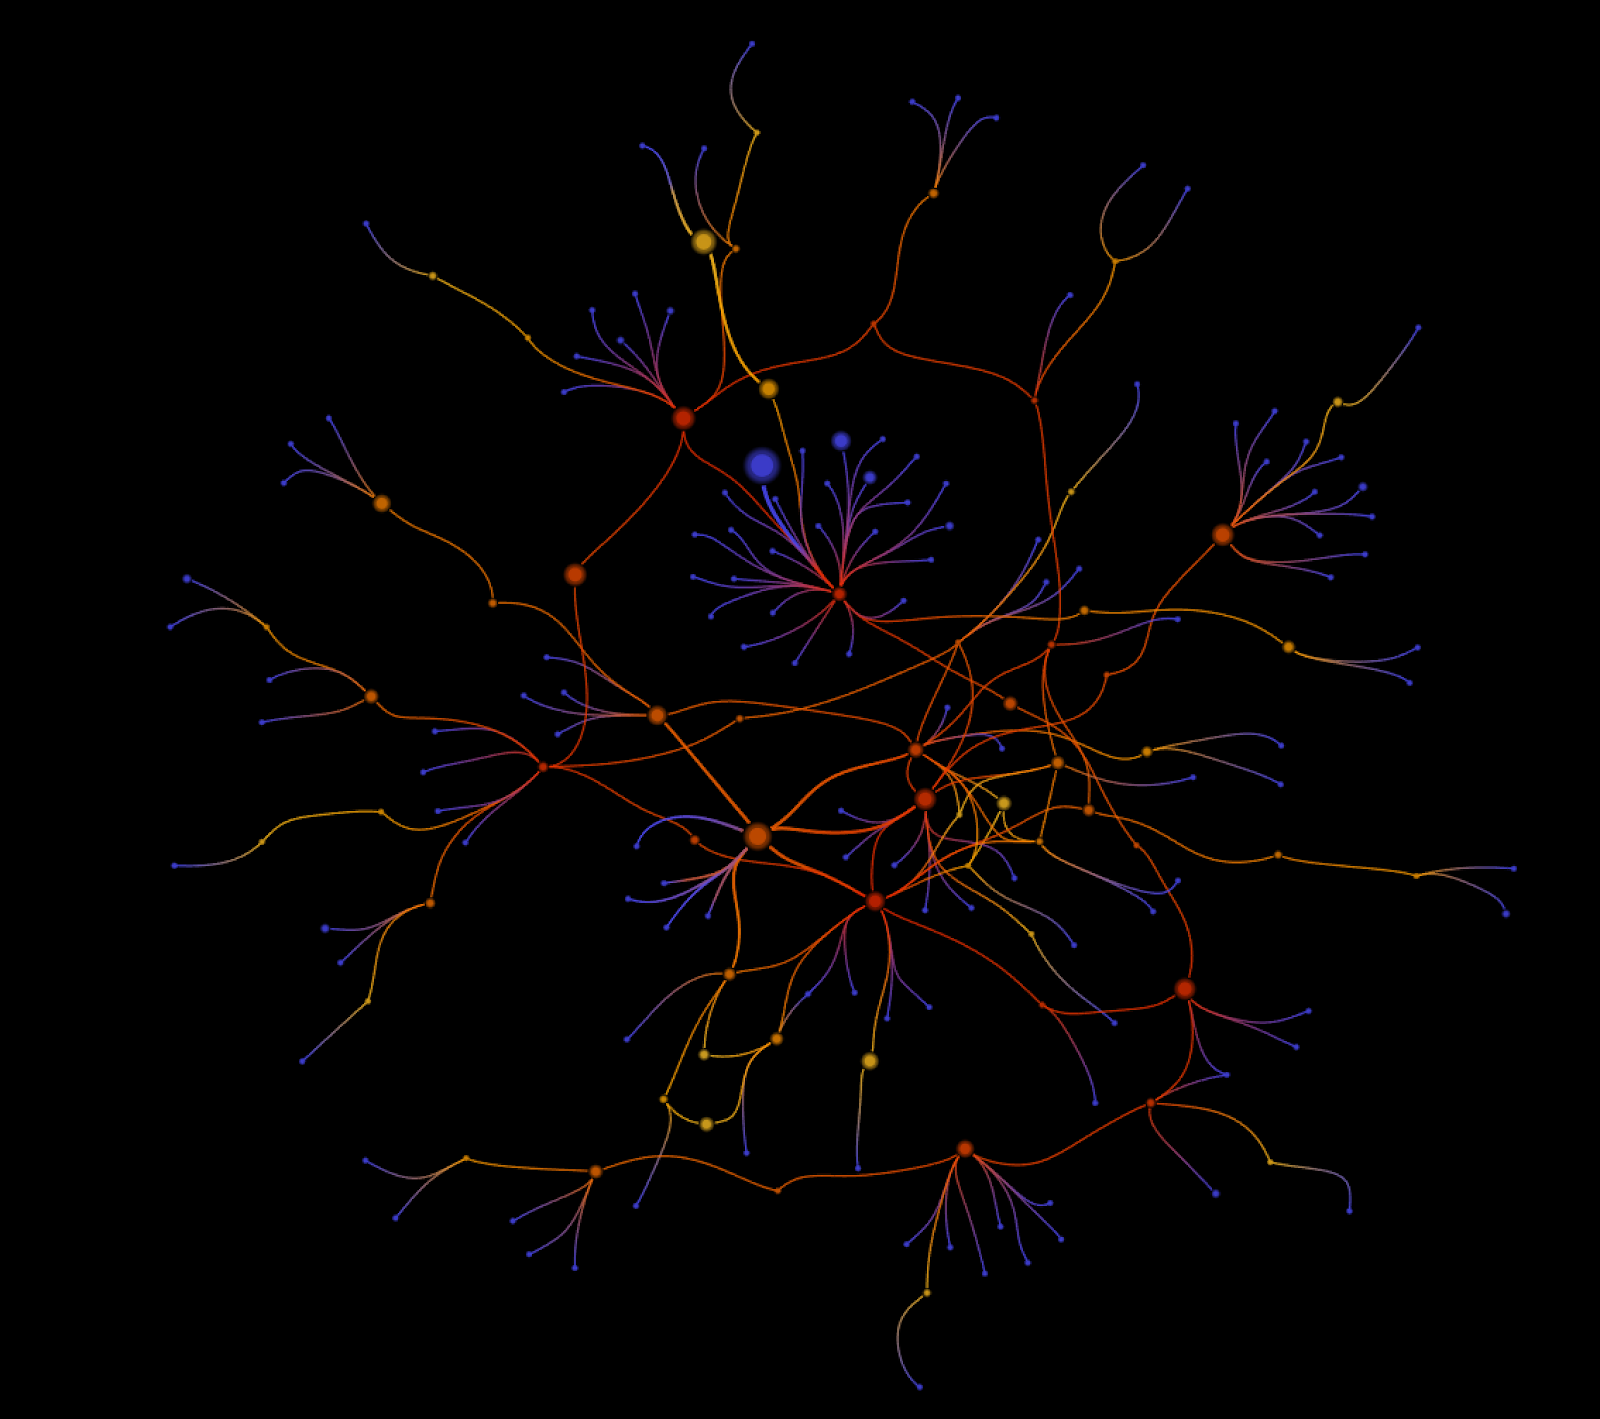
Figure 6 - 500 users replying to each other. We can notice the arborescent structure of some nodes.
Now, looking for the strongest ties, we want to subset even further these conversations to identify actual traces of reciprocal conversations, i.e. replies over replies.
Only 21 people are actually taking part of conversations involving more than just a triplet of users, and this group is actually divided into 2 disconnected subgroups.
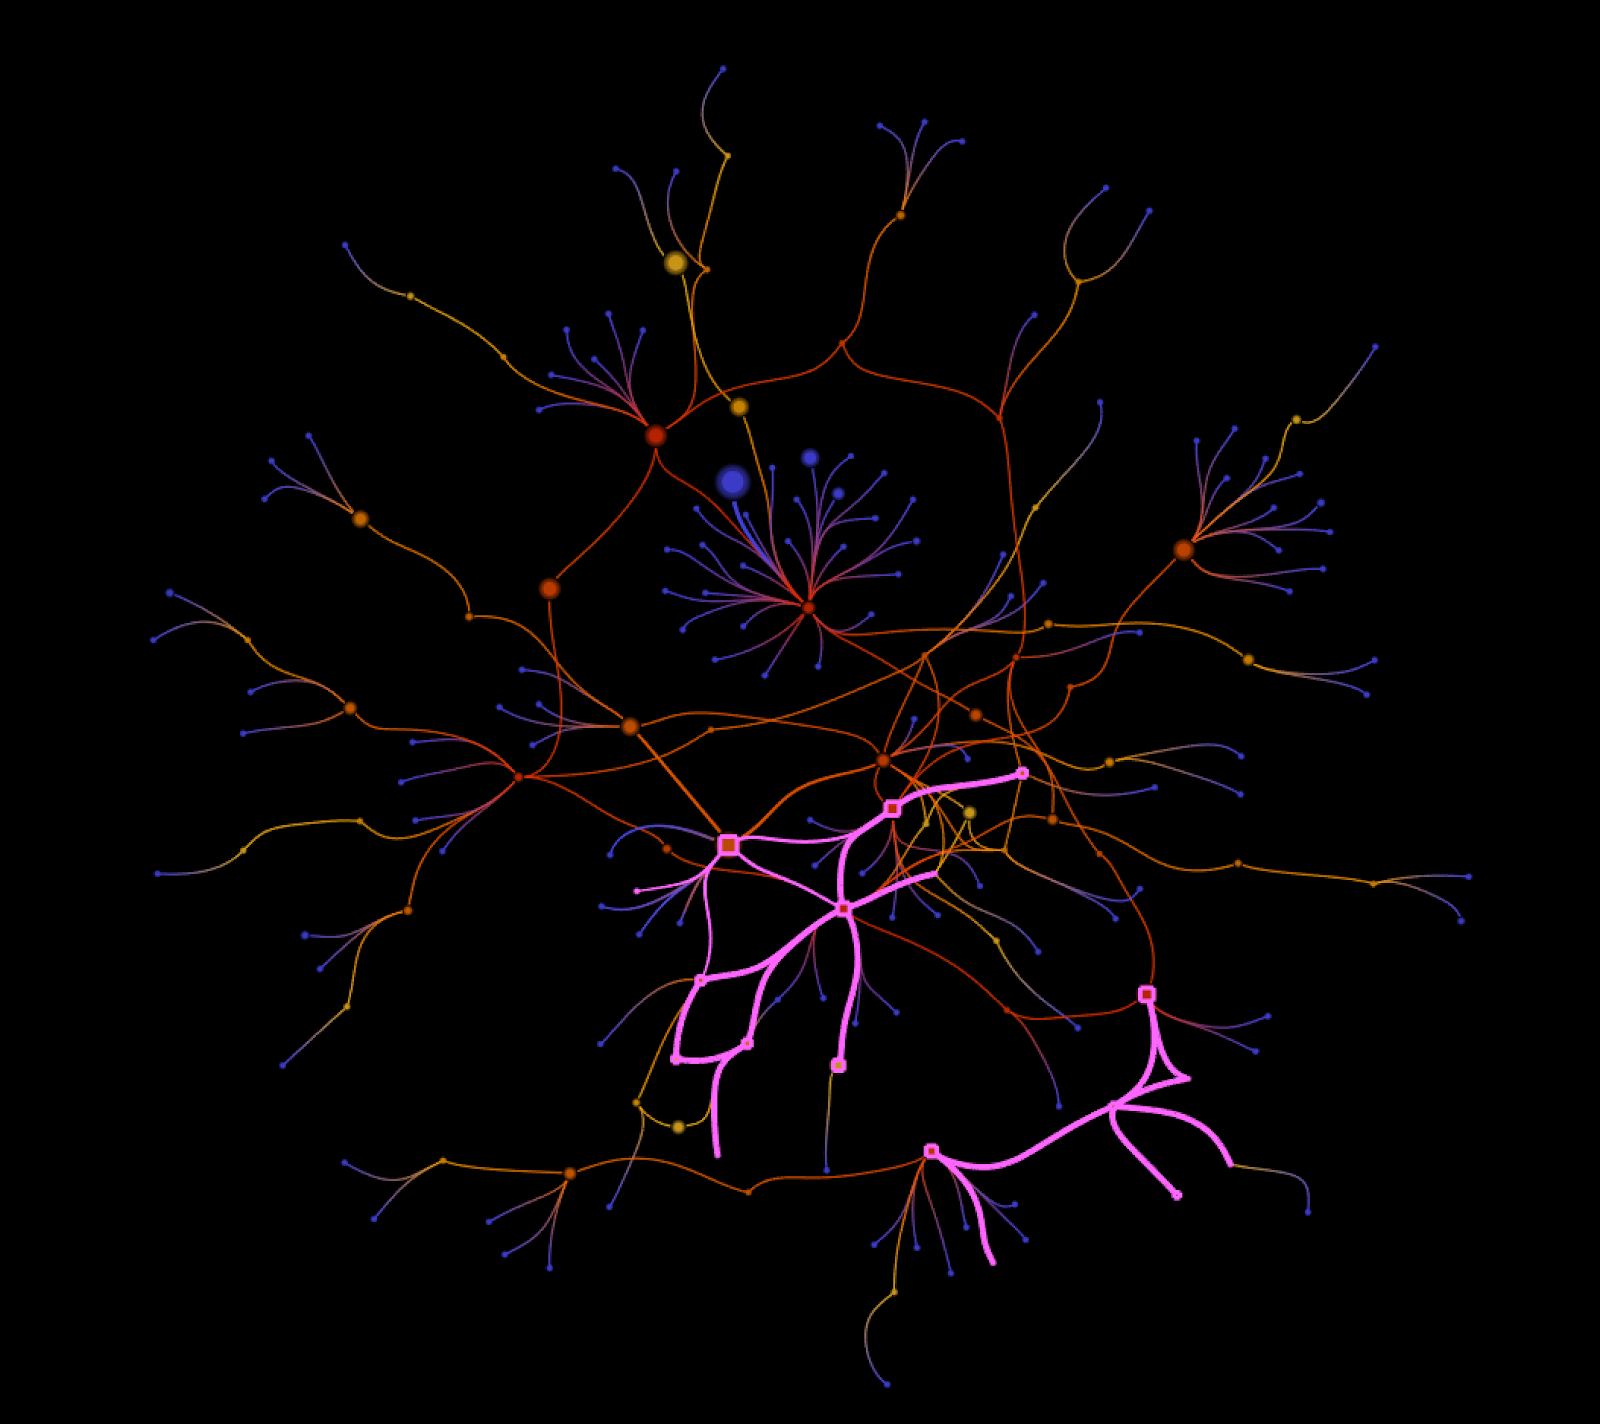
Figure 7 - The 21 core individuals involved in reciprocal conversations.
One subgroup is focused on Edgeryders, producing altogether 490 tweets, and the other group focused on travel companies and tourism, producing 171 tweets.
A quick search on how it distributes over time tells us that those two conversations happen at two different timings, the Edgeryders community happens mostly in the early period and the second group is focused later.
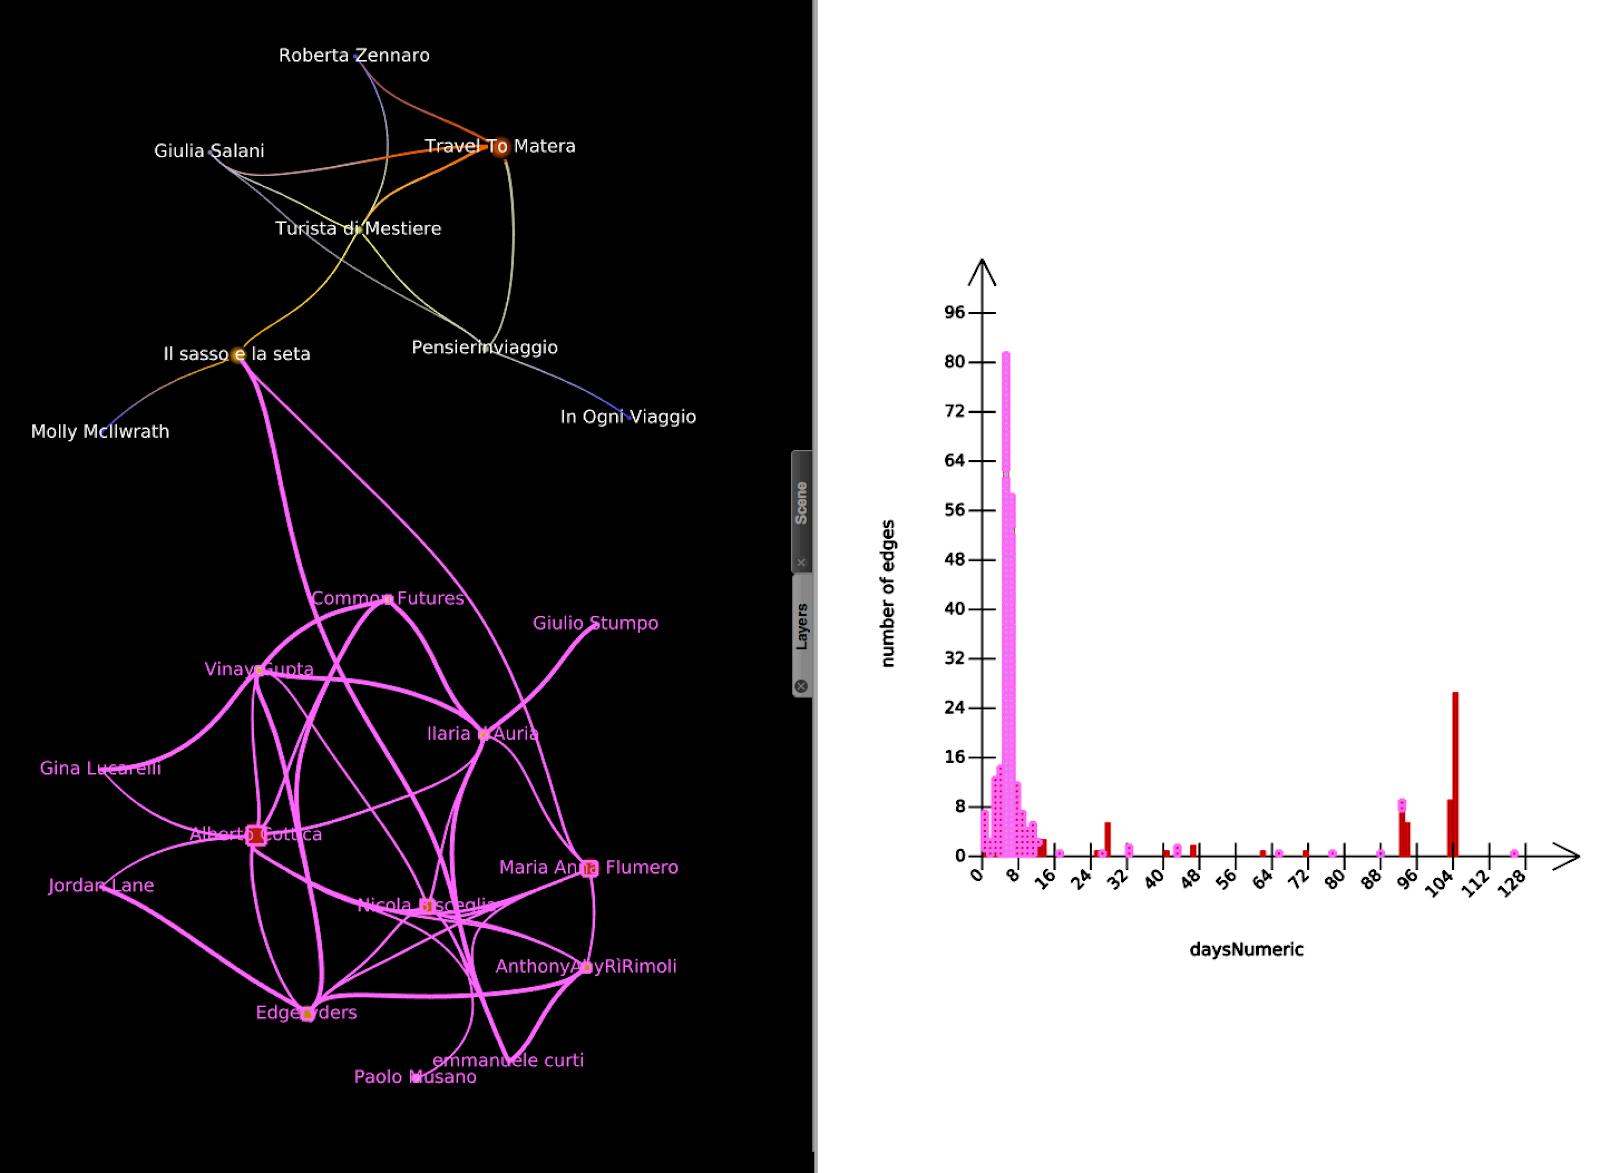
Figure 8 - Distribution of the tweets related to Edgeryders among time (selection in pink).
Communities in Twitter: going back to notion of community
Now, we may wonder how the two rather central communities have been brought close together, and how do they interact together? We can step back and look at how the different twitterers do at mentioning each other.
1500 people actually mention each other in a connected way. Among these 1500 people, only 100 form a core of reciprocal mentions between each other’s, i.e. people acknowledging each other.
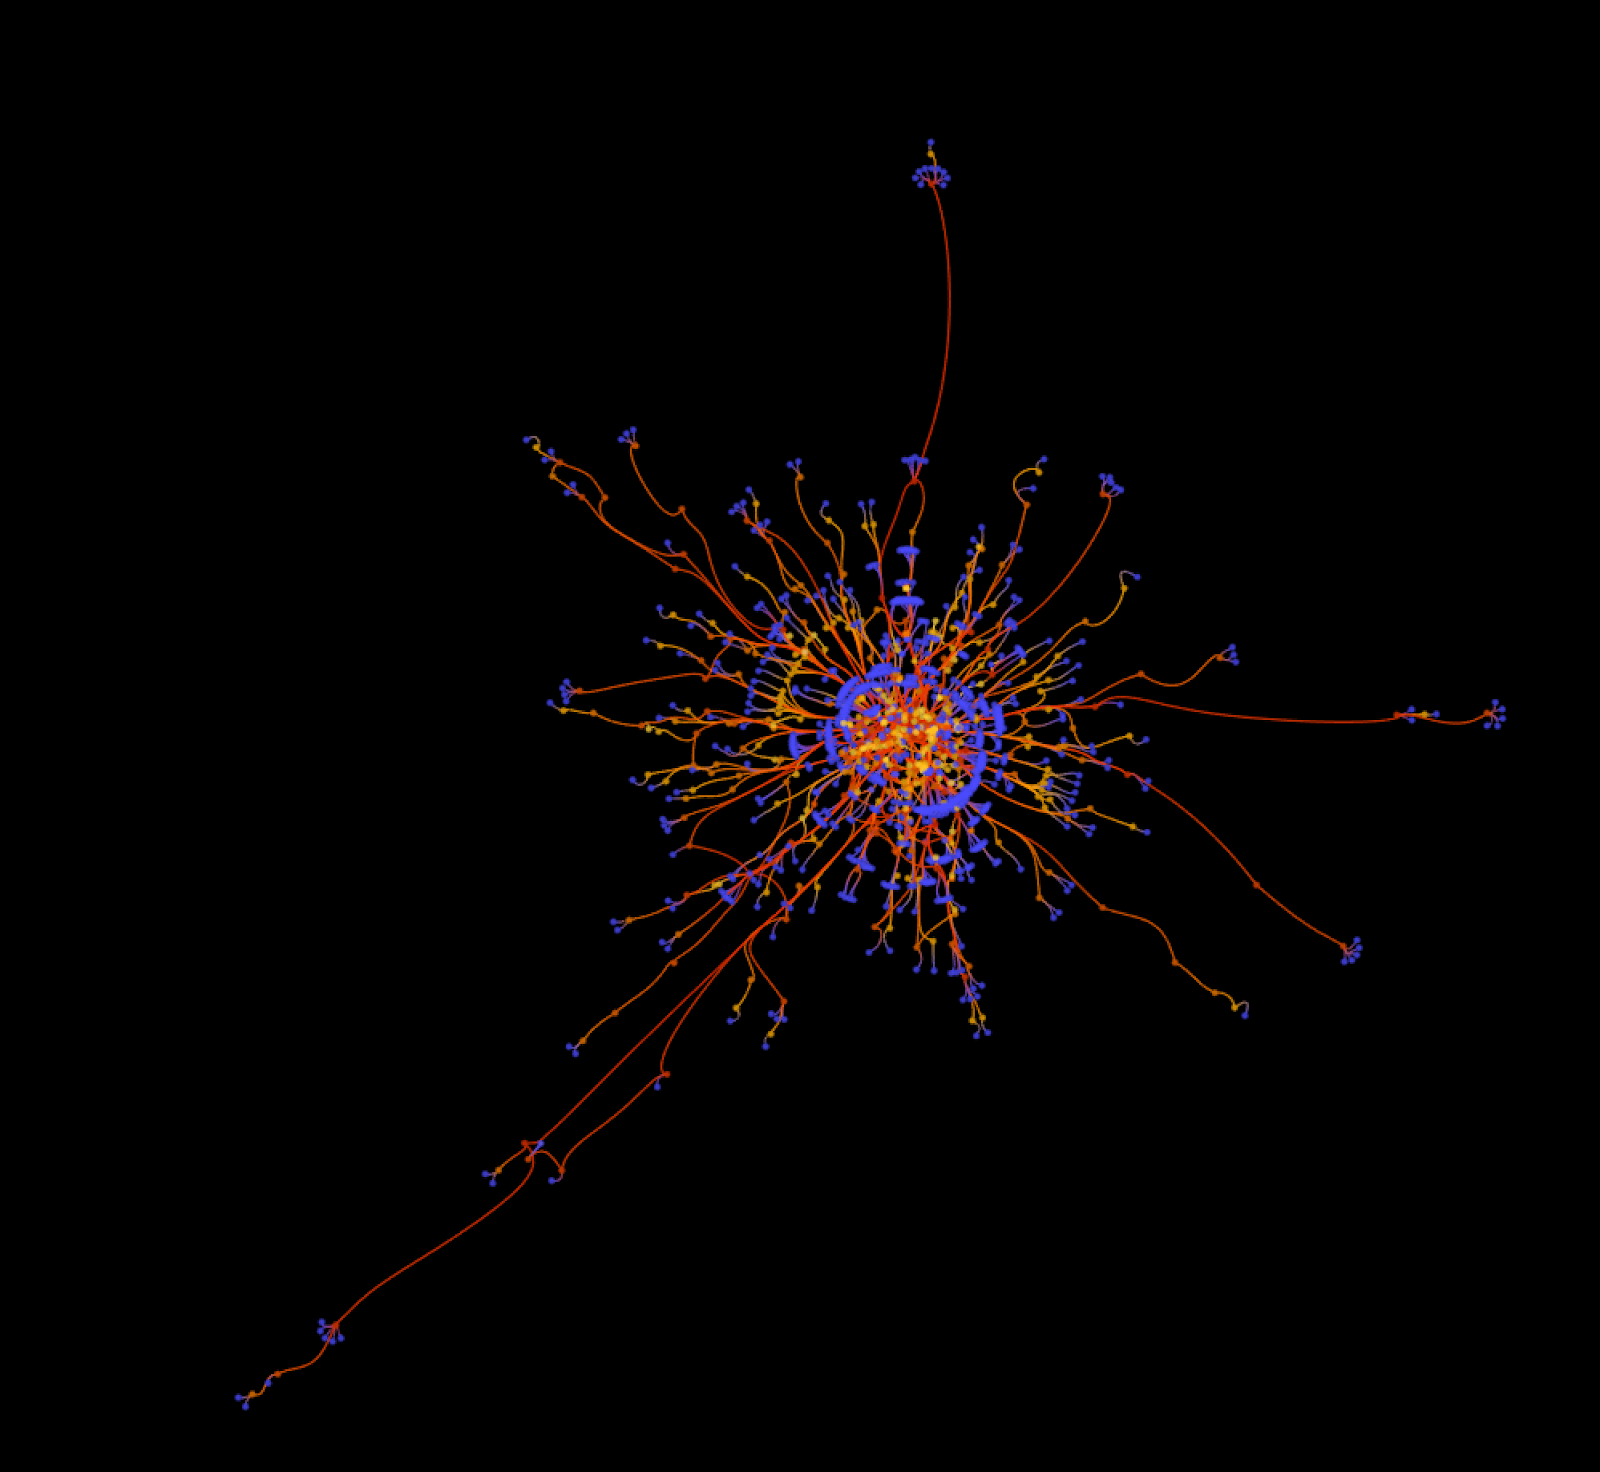
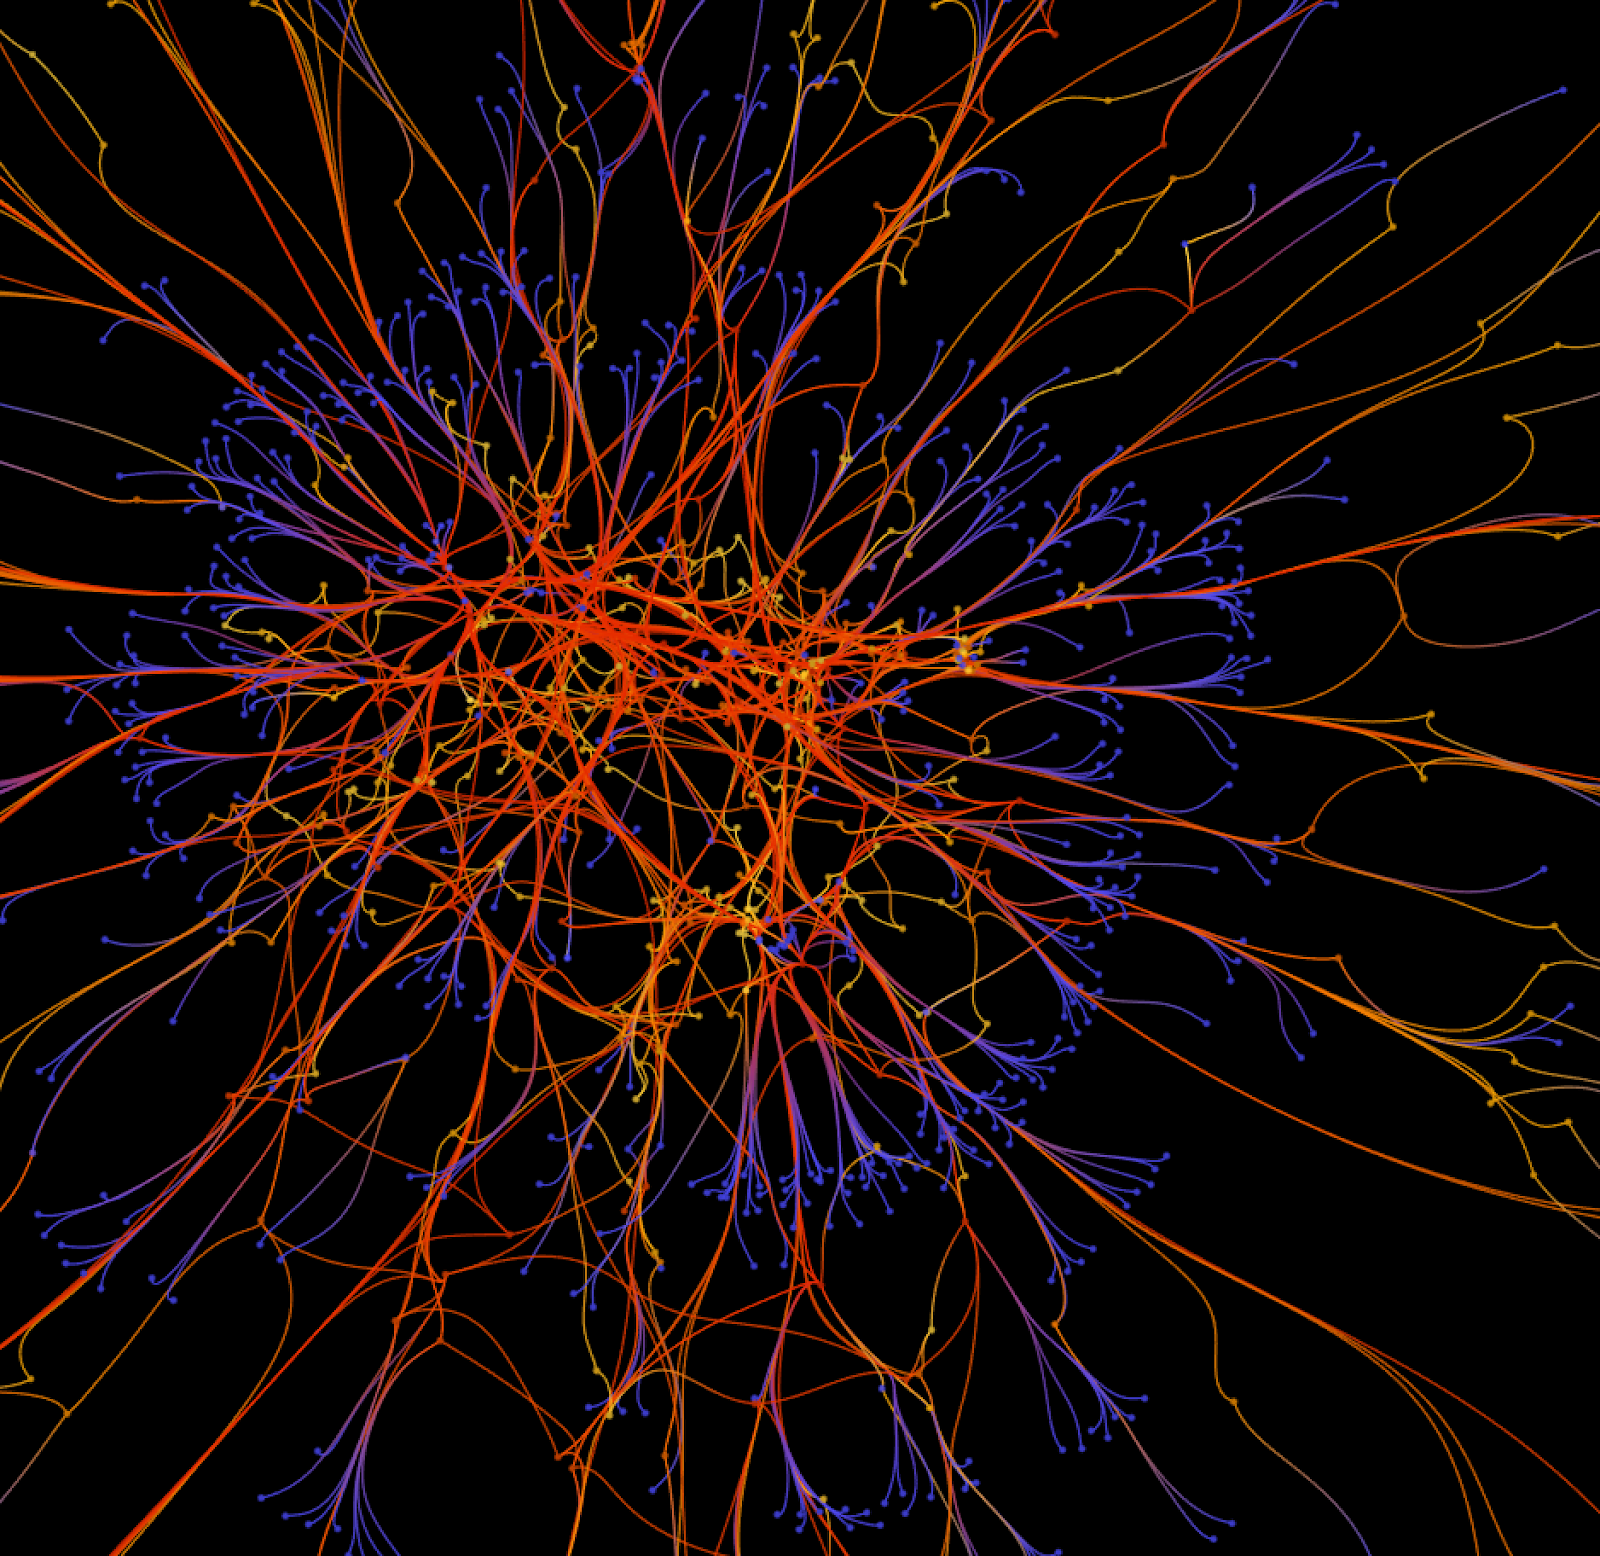

Figure 9 - Two consecutive mesmerizing zooms on 1500 people mentioning one another in an intricate conversation.
Now it is interesting to see how the core two communities we have previously identified collaborate with one another. We can observe that the two sub-communities do not acknowledge reciprocally each other.
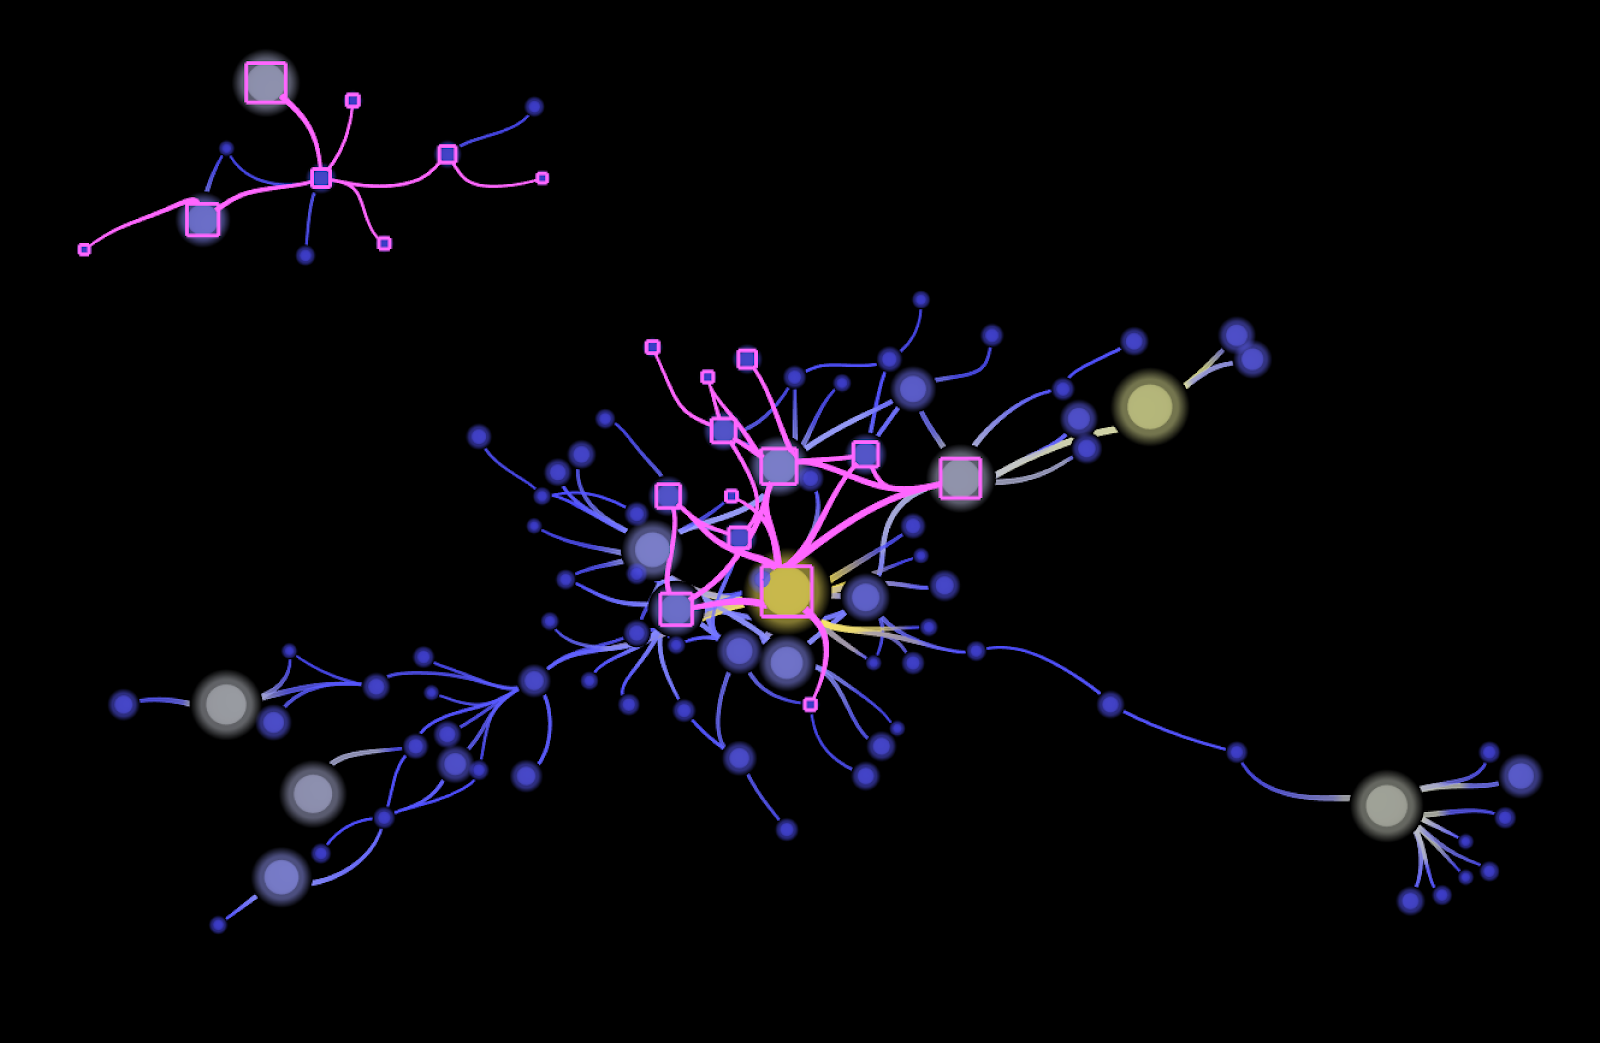
Figure 10 - Highlight (in pink) of the two communities in the connected components of the “Mention” network
However we can also identify the bridge elements between both communities by stepping back in the bigger “mention” component.
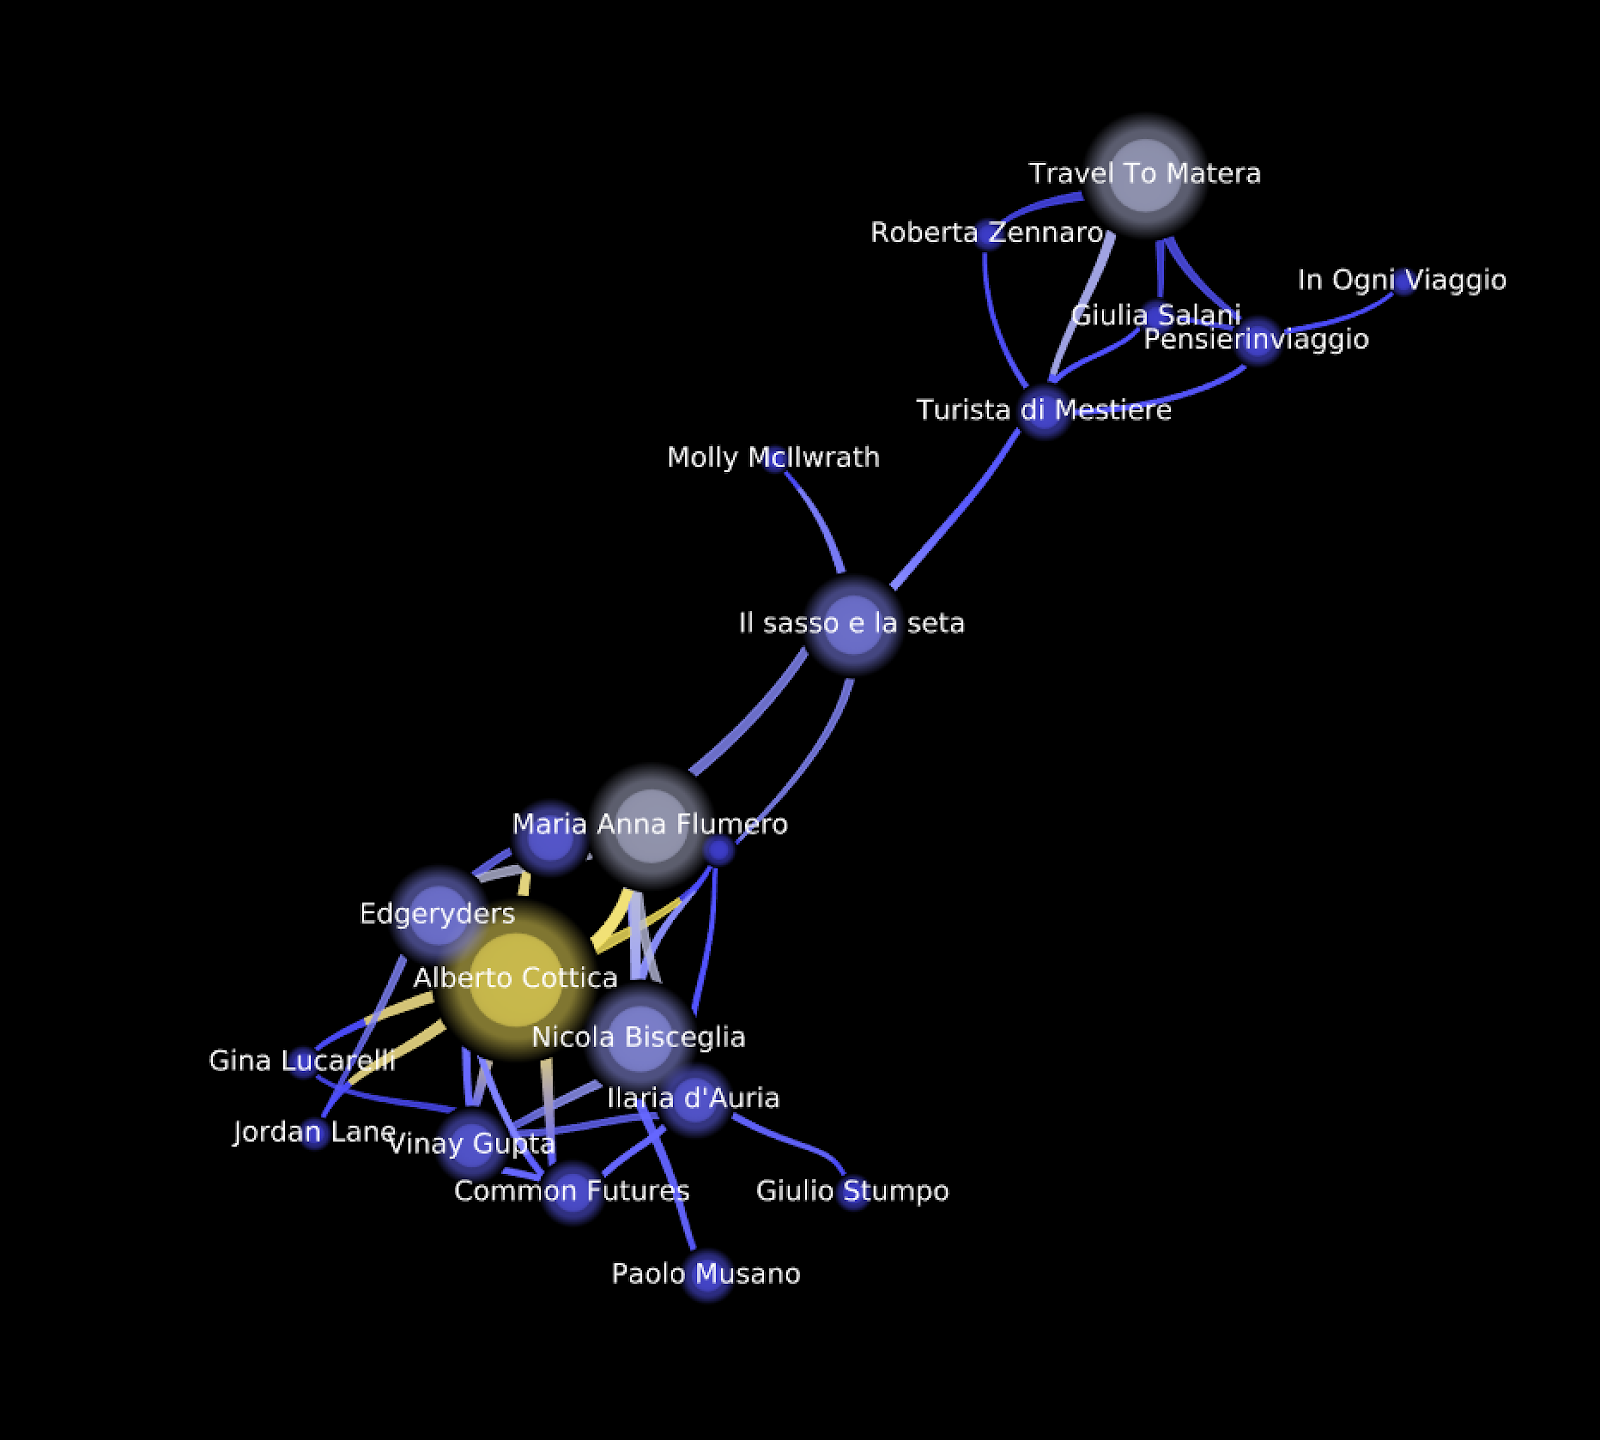
Figure 11 - How the two separated components are connected (extract from the “mention” connected component
Communities in Twitter: conversing
Now that we have focused on how people connect (or not) together in the community. We can focus on what they interact about.
The idea is to compare the semantic space in which the individual exchange when they discuss together. Is it different from how they mention each other? and how? and what brings them together.
To do so, we have built a different network, it’s actually a network in which links materialize the hashtags exchanged between two users. It has the same flat topology as the previous network of people, but it is rich of the semantics that people use when they converse.
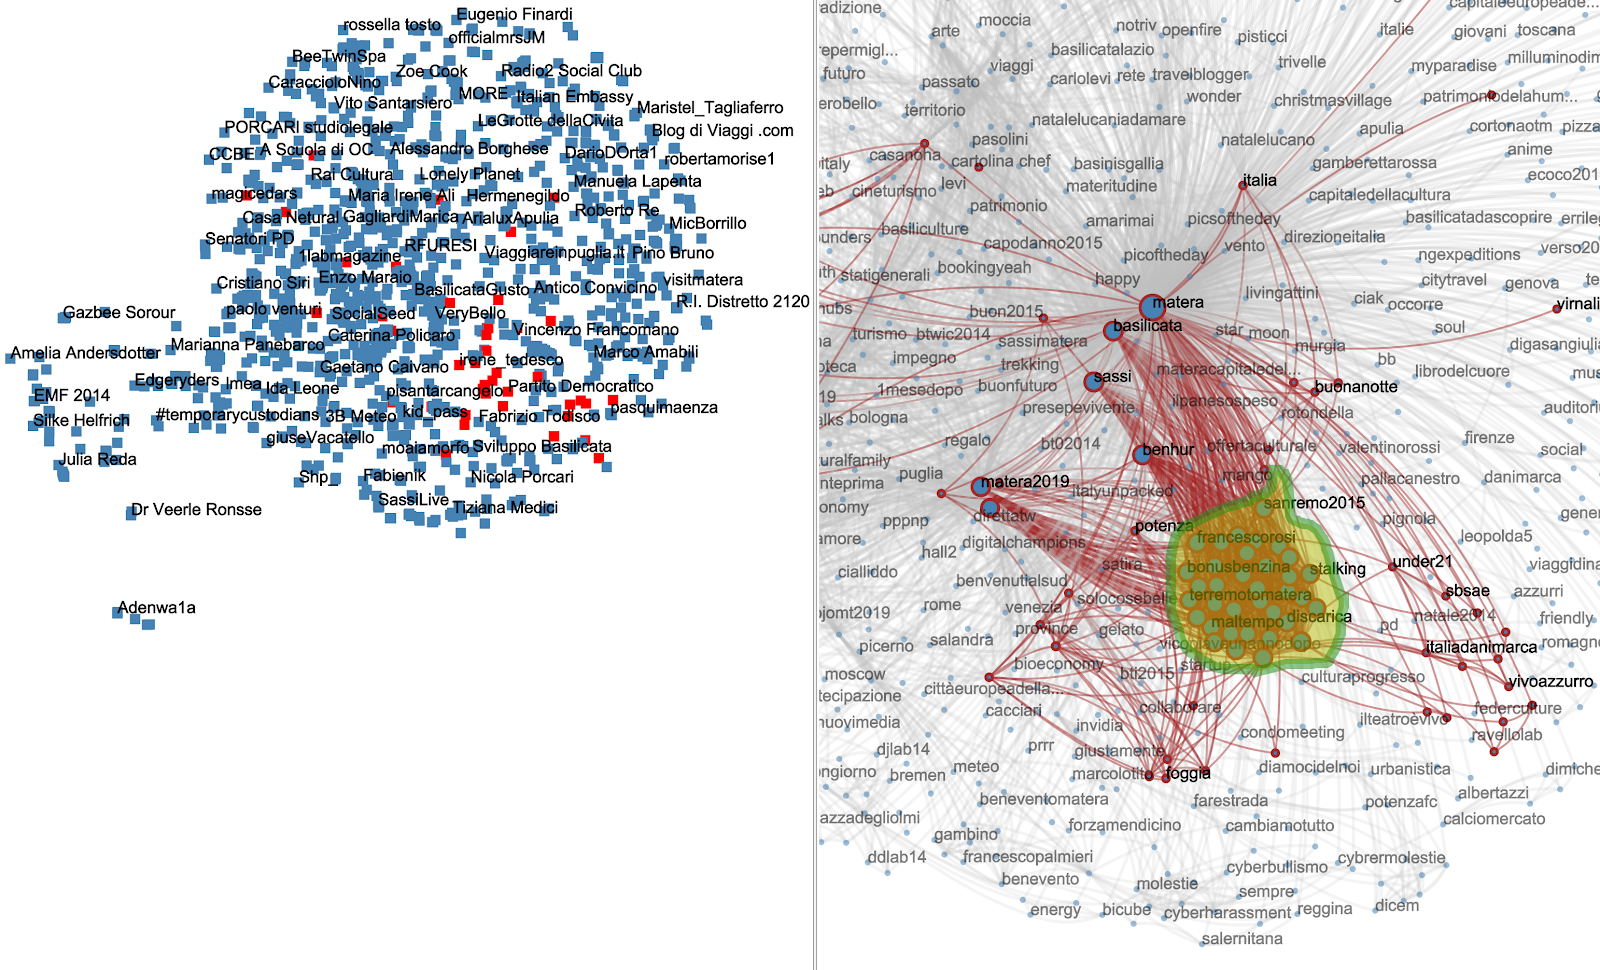
Figure 12 - Illustrative example of associated selection between people (left) and hashtags (right) with detangler to promote exploratory network analysis.
Using this model, we can capture the schemes of conversations and see how hashtags bring the two sub-communities together.
If we limit ourselves to the semantics of engaged conversations, very little is bringing the two communities together but #ecoc2019. The interest of each community are clearly identified and separated. One group is really focused on travels in Matera, whereas the second group is centred around the Lote4 event, transfer and openness.
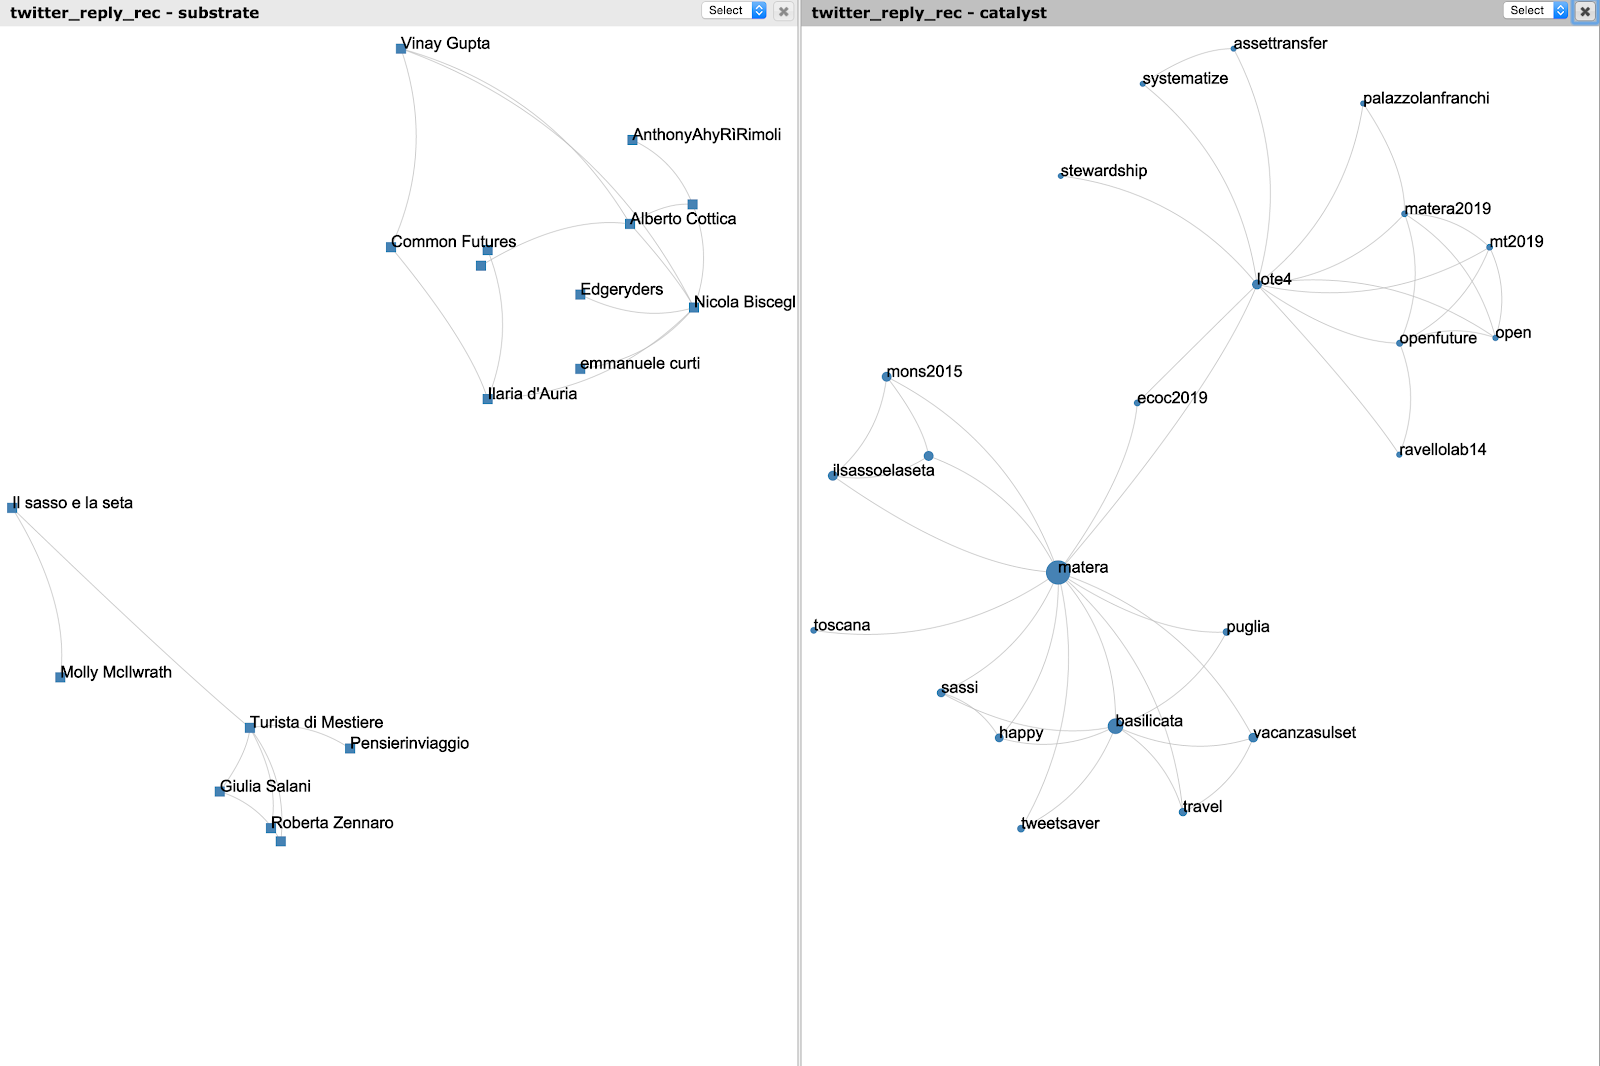
Figure 13 - Communities of people replying to each other. We can see the two disconnected group of people on the left, aligned with their corresponding hashtags on the right (people on top, converse about topics on top). The frontier is very clear. People on top discuss of lote4, and people on bottom of Matera in terms of travel.
However by looking at how these two groups are mentioning their members together, the frontier still exists of course, but it is by far more blurry, and user Matera2019 seems to be an interesting gathering point between these communities.
By the way, we have analysed that, even if matera is the heaviest most occurring hashtags in our dataset, lote4 is by far more often more co-occurring with many other hashtags putting lote4 as the most influent hashtag in terms of group cohesion. In other words, the sub-community centered on Edgeryders is more cohesive because people discuss more often about the same focused topics. Could it be an interesting side-effect of an effective moderation? Or could it be that semantic cohesion makes a community really a community?
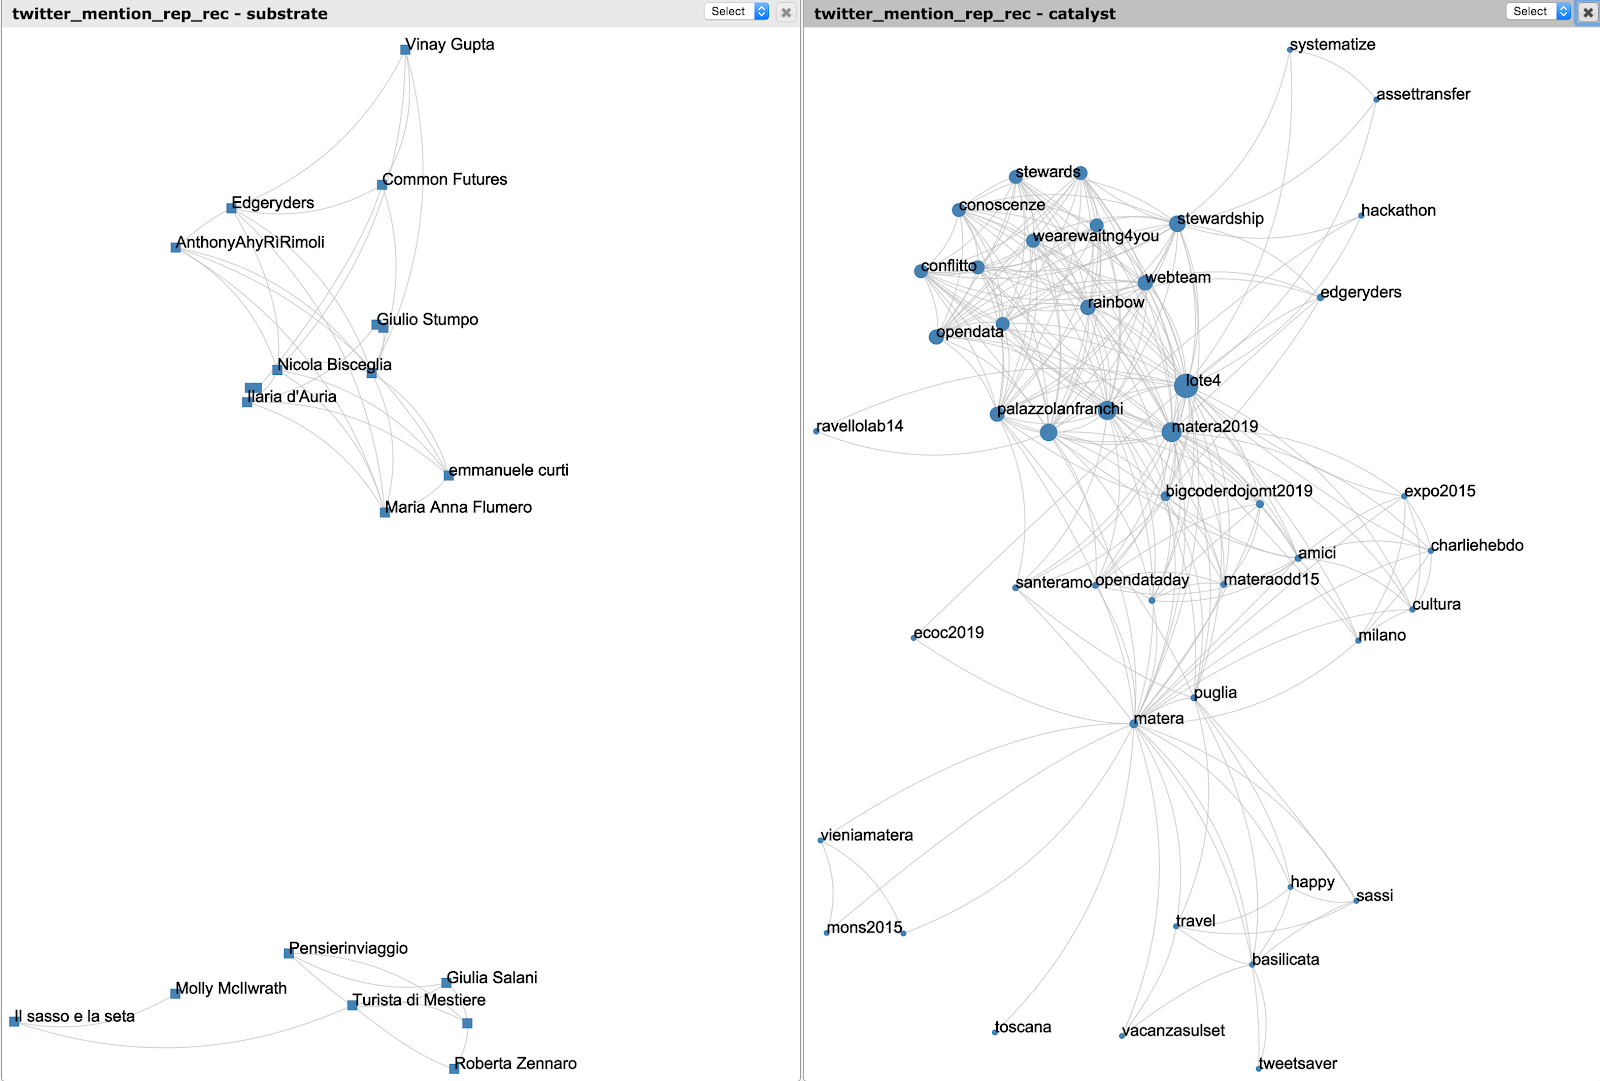
Figure 13 - Communities of people mentioning each other. We can see the two disconnected group of people on the left, aligned with their corresponding hashtags on the right (people on top, converse about topics on top). The frontier is more fuzzy and a core set of topics (on top) relate very much to lote4 whereas matera is very diffuse (on bottom)
Conclusions
This analysis is only the result of a 2-day workshop, and we would wish to push it further to have a complete understanding of the structure of the community. But it is a nice example how we can dig effective elements of discussions, topics of interests, and central people, at the heart of a very noisy spread Twitter conversation.
Also, considering the context of the event it would make sense to filter the data after, the end of November. Later tweets refer to Matera or to the unMonastery, but at this point the two terms no longer refer to a unity. There also could be many other questions, focused on data properties but also wider openings: How would we compared and define that with annother community, such as Imagination4People’s mailing list / communities? What is the specific role of these [put-your-list-here] individuals? What were their focus of attention during [put-your-timeframe-here]? etc. etc.
Now that we know all these tools and metrics are available, the most challenging task would be to set a (Cartesian) method to systematize and build integrated tools for the analysis of such a Twitter community. Here are some examples ways of applying this to the real world:
- Showing the graphs on events to demonstrate which were the main topics tweeted during the day and which people were most active - this implies that the graphs are developed rather quickly
- You can identify people who are especially interested in specific topics, at least if mentioning the topic in \# is a good indicator for this
- Really cool would be if this could be used instantly on a twitter wall during events
- By reducing the overall number of members of a community to the very few (18 in this case) really active ones, you know who you would need to approach for future events, discussions etc. > find the champions
- As it comes down to few topic \# on our graph, we might be able to encounter new emerging topics or other unexpected stuff
Development
All the data is made open from the Masters of Networks 3 drive. This analysis has been processed during the event, Tulip 4.6 has been used to process the CSV data, and build the initial networks, detangler has been used for the paired semantic analysis, and a little bit of d3 to process the time series (just a bit after the event).