Hello fellow EdgeRyders,
We have been commissioned to put together a network analysis report of the EdgeRyders community. We’re presenting some initial findings to you - the Edgeryders community at large - for your input, thoughts and to ensure that everyone has a better overall view of how discussions taking place on the ER platform - through comments and mission reports- govern the shape and direction of the ER network itself.
In the age of “Big Data” it’s common practice for companies, brands and in particular online social network platforms to conduct this kind of research. They generally seek to understand the network and to identifying key individuals such as ‘bridge nodes’, network weavers and key influencers. This research is predominantly done with a view to growing the network in question through targeted marketing, incentivising the actions of key influencers and by shaping the product or service according to the actions of users.
But as we know, EdgeRyders isn’t your typical product or service, it’s a discovery exercise, driven by dialogue and exchange with a view to transforming that knowledge into the largest thinktank in the world.
With this in mind, a fundamental research question for the EdgeRyders community might be:
“How do you think that network research can be used effectively to help ensure that EdgeRyders fulfills its true potential as aggregator of collaborative research and expertise?”
So, what have we found so far?
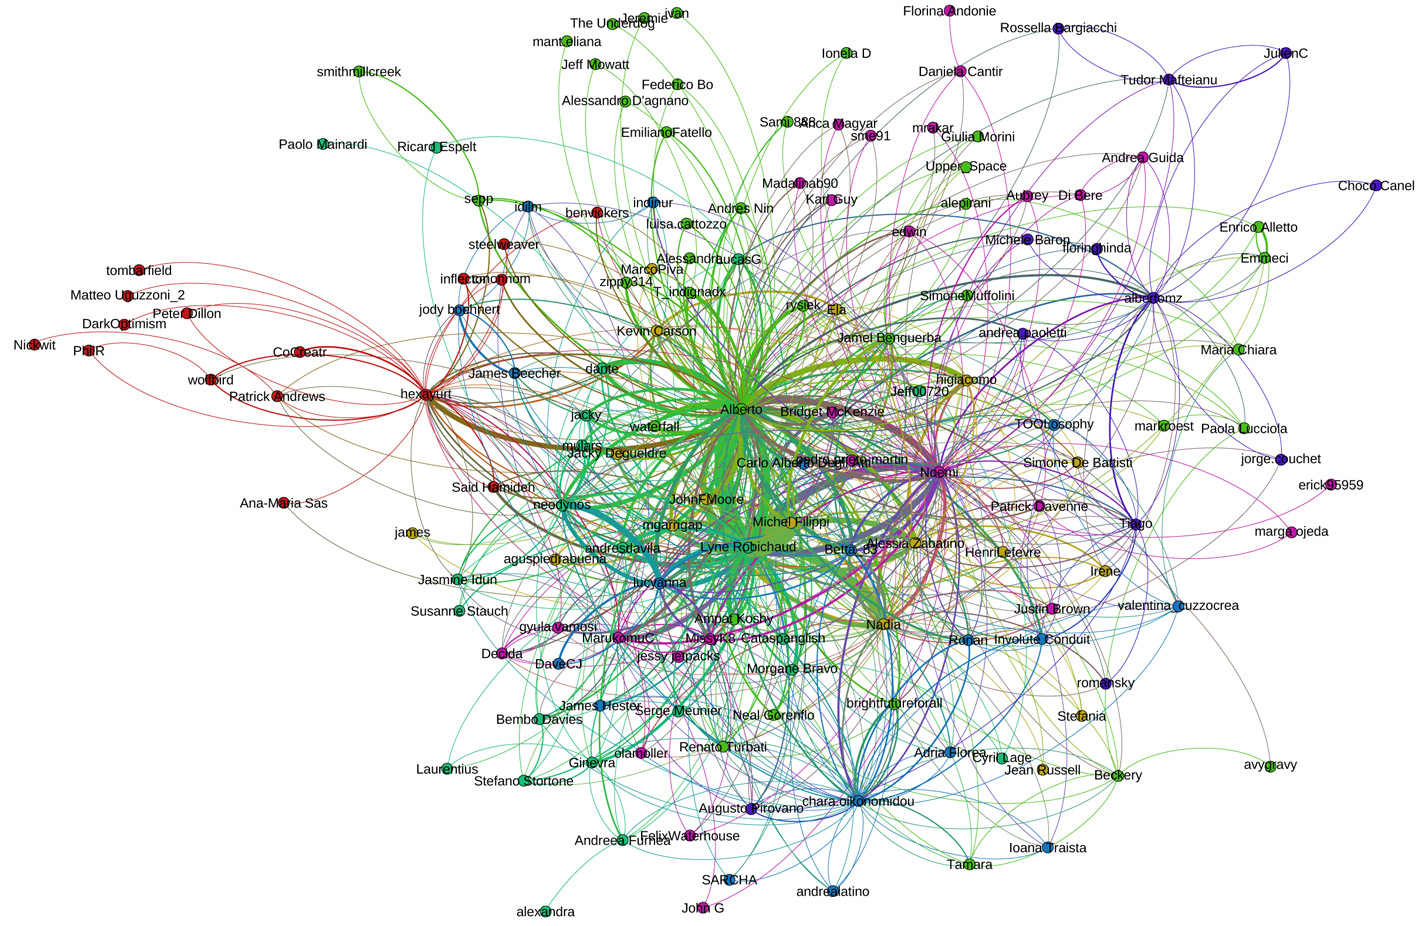
Below is a birdseye view of the active EdgeRyders community. With 771 registered users, as of 7/5/2012 148 were actively participating and communicating with each other. The visualisation below illustrates the active individuals and who’s talking to who.
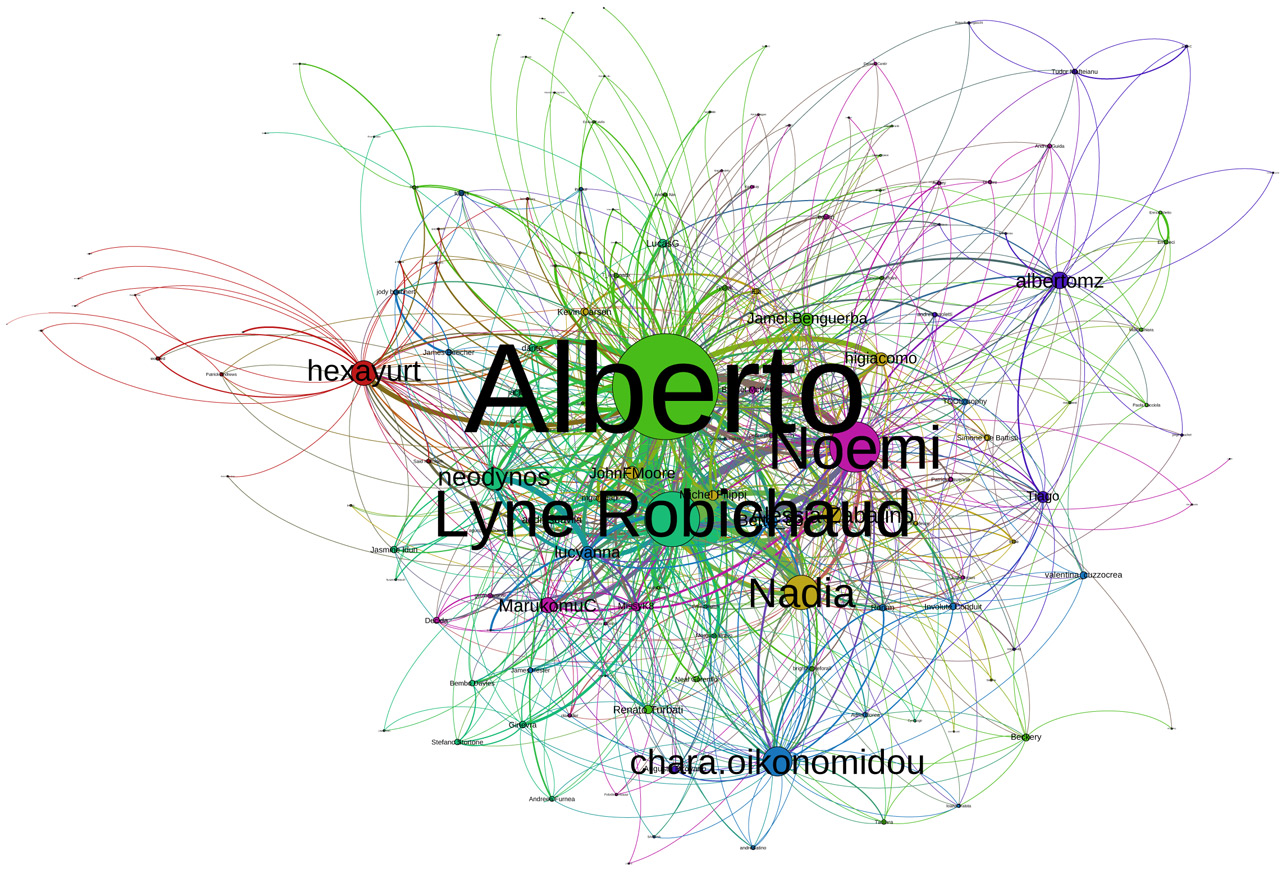
Having taken an overview of the network, we have initially identified 7 sub-communities. The key nodes within each of these 7 sub-communities are currently EdgeRyders staff: Alberto, Hexayurt, Nadia, Chara, Lyne, Noemi and Albertomz.
Looking at the sub-communities forming around these individuals, there is a clear indication of the existence of a second wave of key nodes. The community is grown through a snowball effect: it seeks to encourage the invitation of friends of friends. In order to better understand how the community is evolving and to support this claim, it would be useful if you all could provide some feedback and discussion on how you’re bringing others to the platform - whether that be by pre-existing offline network, twitter, email or other means.
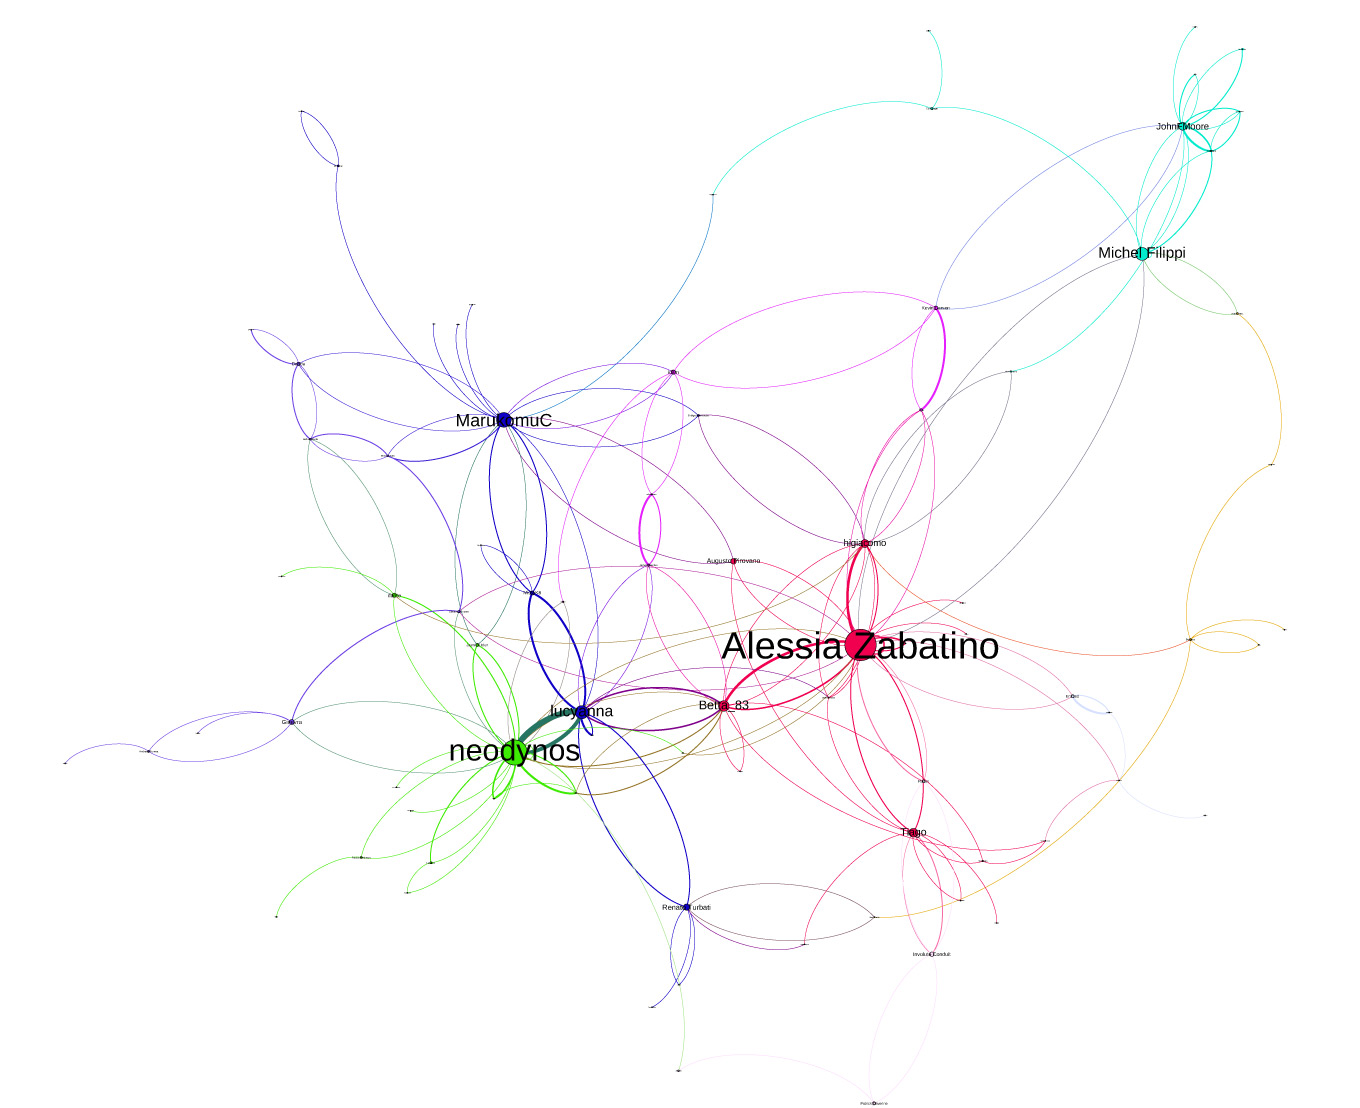
Through looking at both numbers of connections and at who acts as a bridge between otherwise unconnected people we can see 10-15 emerging key nodes: most evident are neodynos, Alessia Zabatino, Michel Filippi, JohnFMoore, lucyanna, Jamel Benguerba, Tudor Mafteianu, MarukomuC, Betta_83, Tiago, LucasG, higiacomo and Renato Turbati.
The Second Dataset, Mission Reports.
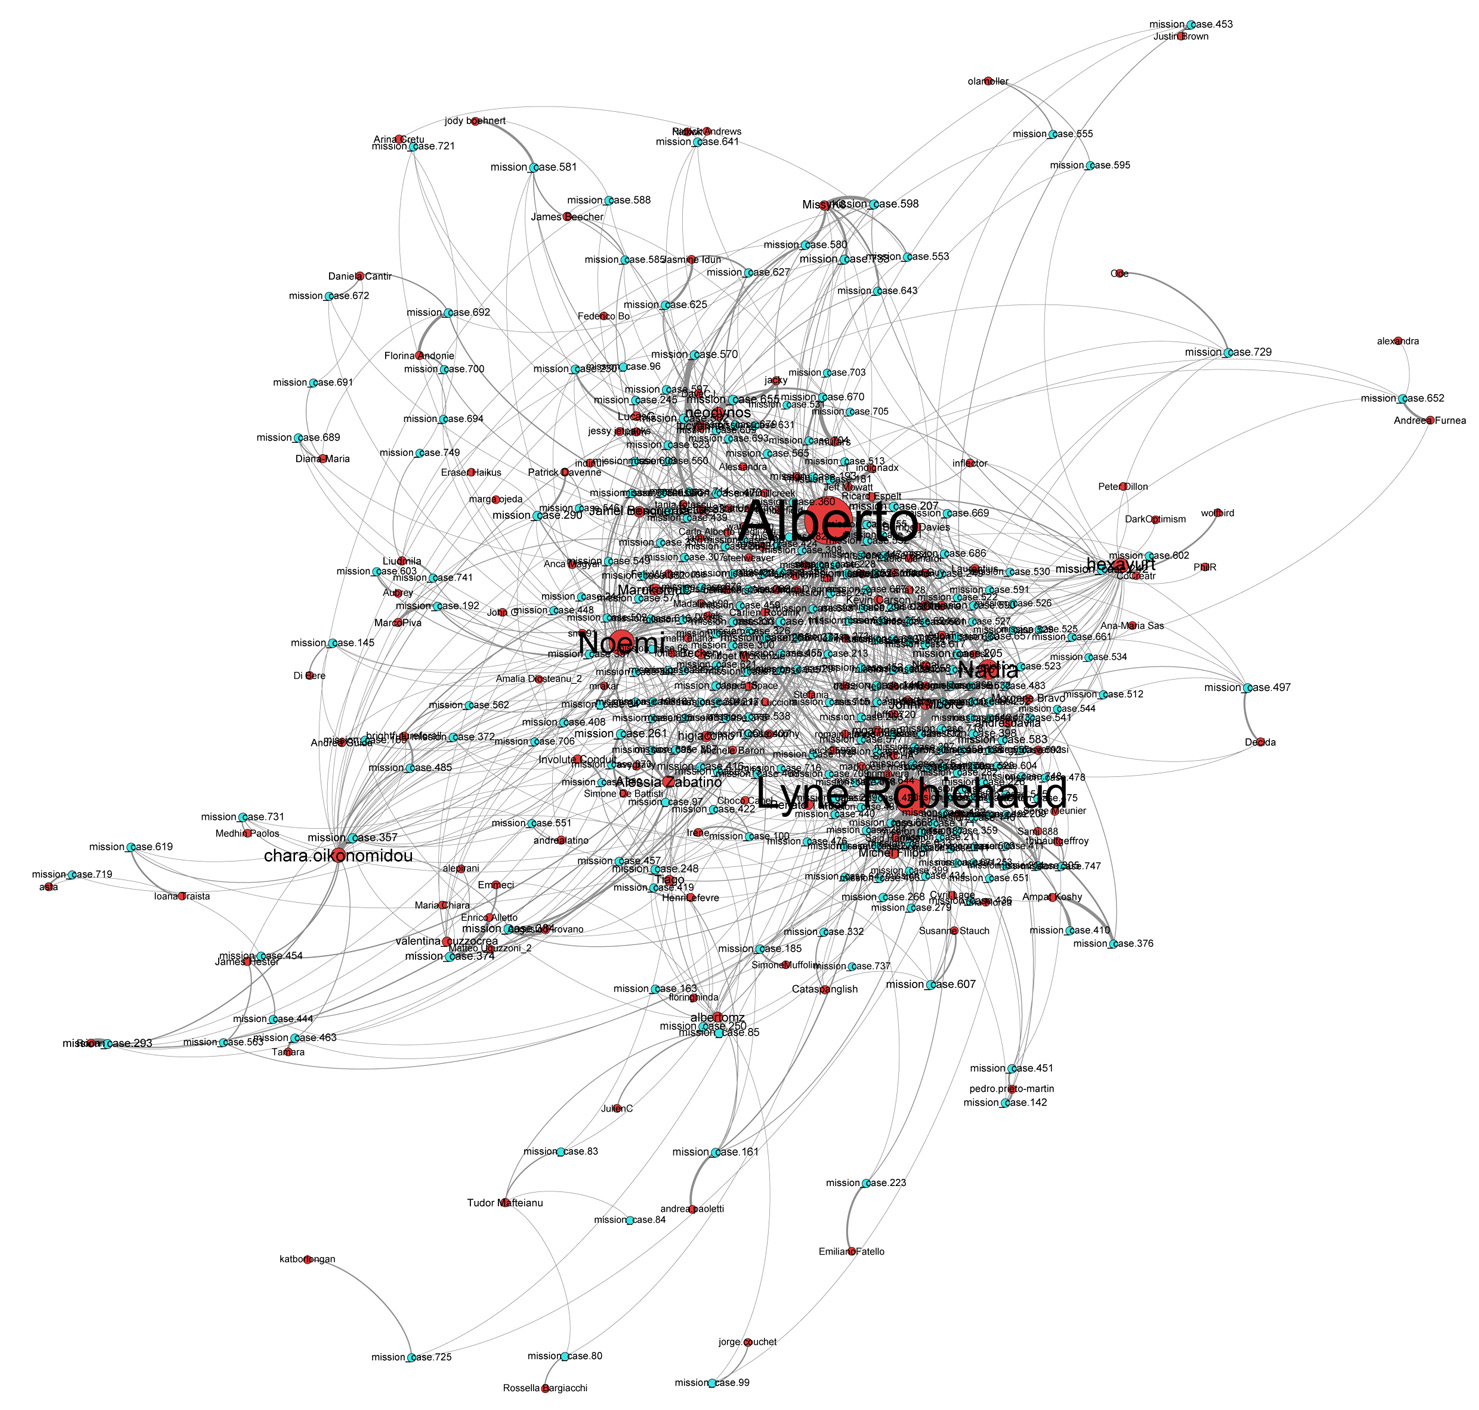
The second dataset we’ve been analysing is focused on the discussion between Mission Reports. This analysis reflects an increasingly less centralised form than illustrated in the initial dataset of all interaction above, however the pattern of the ascendant 7 individuals/nodes noted before is by and large replicated.
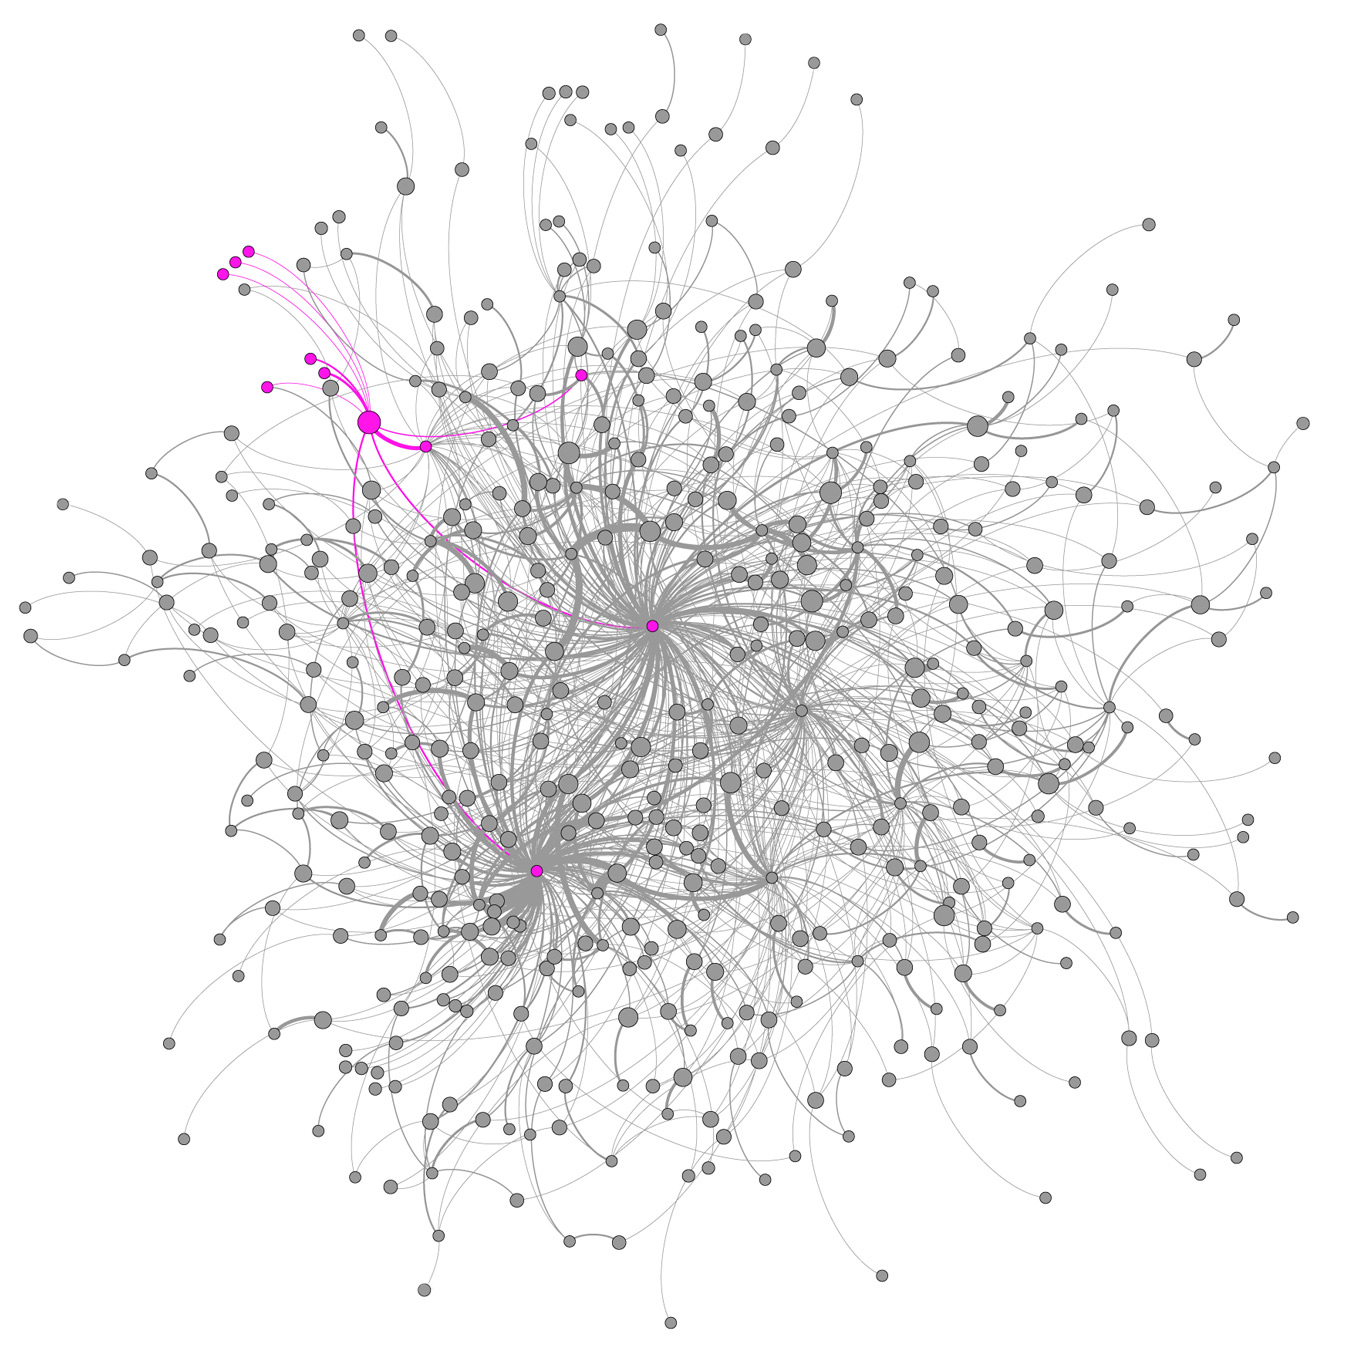
In this network we are starting to see that certain mission reports are important in their own right. Within which we can begin to identify micro sub-communities clustering around specific issues. Below is an example of how individual mission reports can spread throughout the community as highlighted in pink, the report in question can be found here: http://edgeryders.ppa.coe.int/node/242
Moving Forward.
This week we compiled a database that includes gender, location and animal type for all 148 active members. This was done by correlating user id with information provided on individuals profiles, EdgeRyders doesn’t require you to input this information and so this shouldn’t be considered a complete dataset.
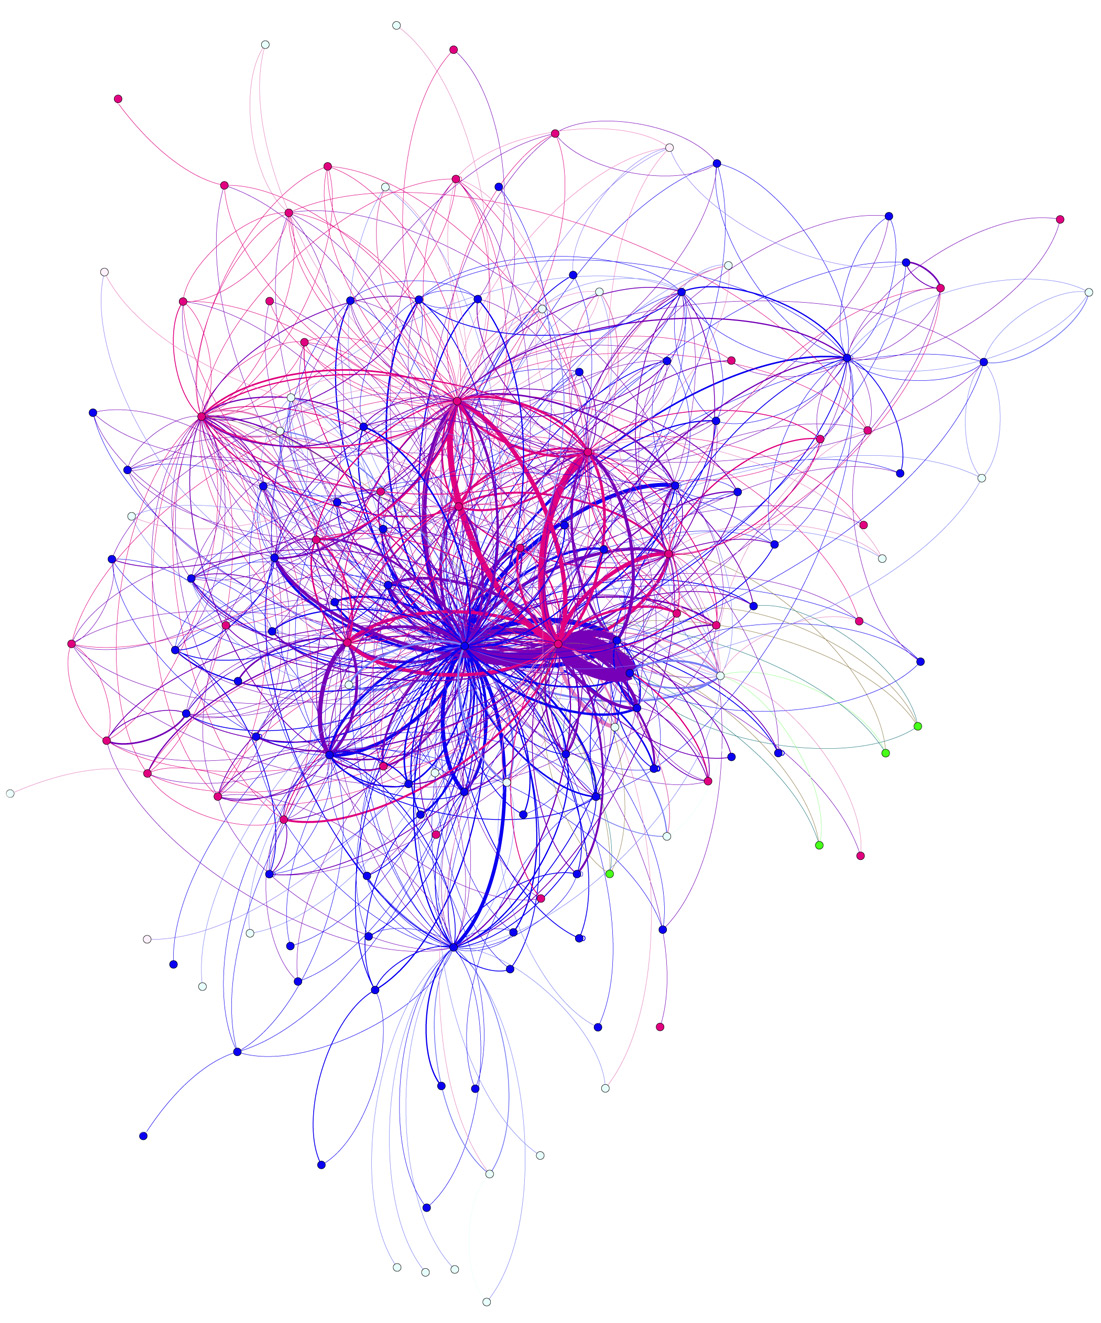
By doing a rough cut, we found that there were 50% more men than women. But we also found that, on average, women have written on a wider range of mission reports than men.
Men = Blue / Women = Pink
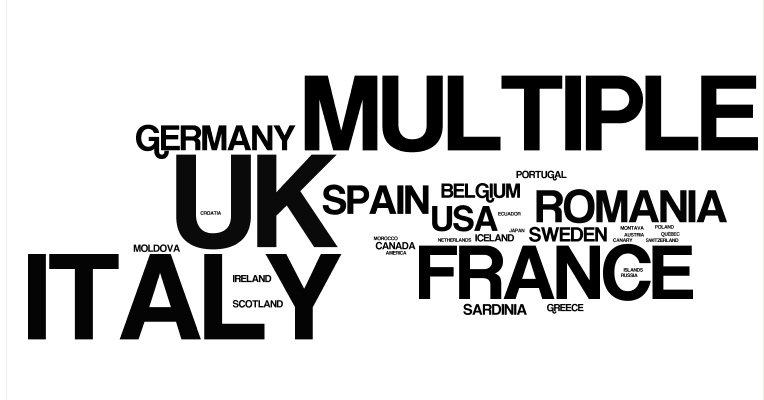
Where EdgeRyders are located.
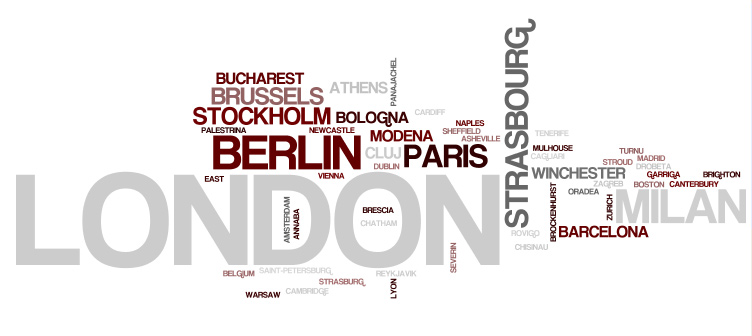
Where given, which Cities EdgeRyders are located in.
Dominant Animal Types:
How we’re doing this.
For the most part we’re using data extracted directly from the EdgeRyders website’s database, this includes a list of all users, directional interaction between users, the frequency of communication between individuals and the frequency of interaction between users and specific mission reports.
We’re using a combination of Gephi (free to use open-source network analysis tools) and UCINET, to analyse and visualise the data provided.
What Next?
We will be giving a presentation at the EdgeRyders conference of our findings and a short time after will present a full report. In the meantime we look forward to your input and discussing our initial findings with you!
