Reducing the codes co-occurrence network: some early results from the white paper

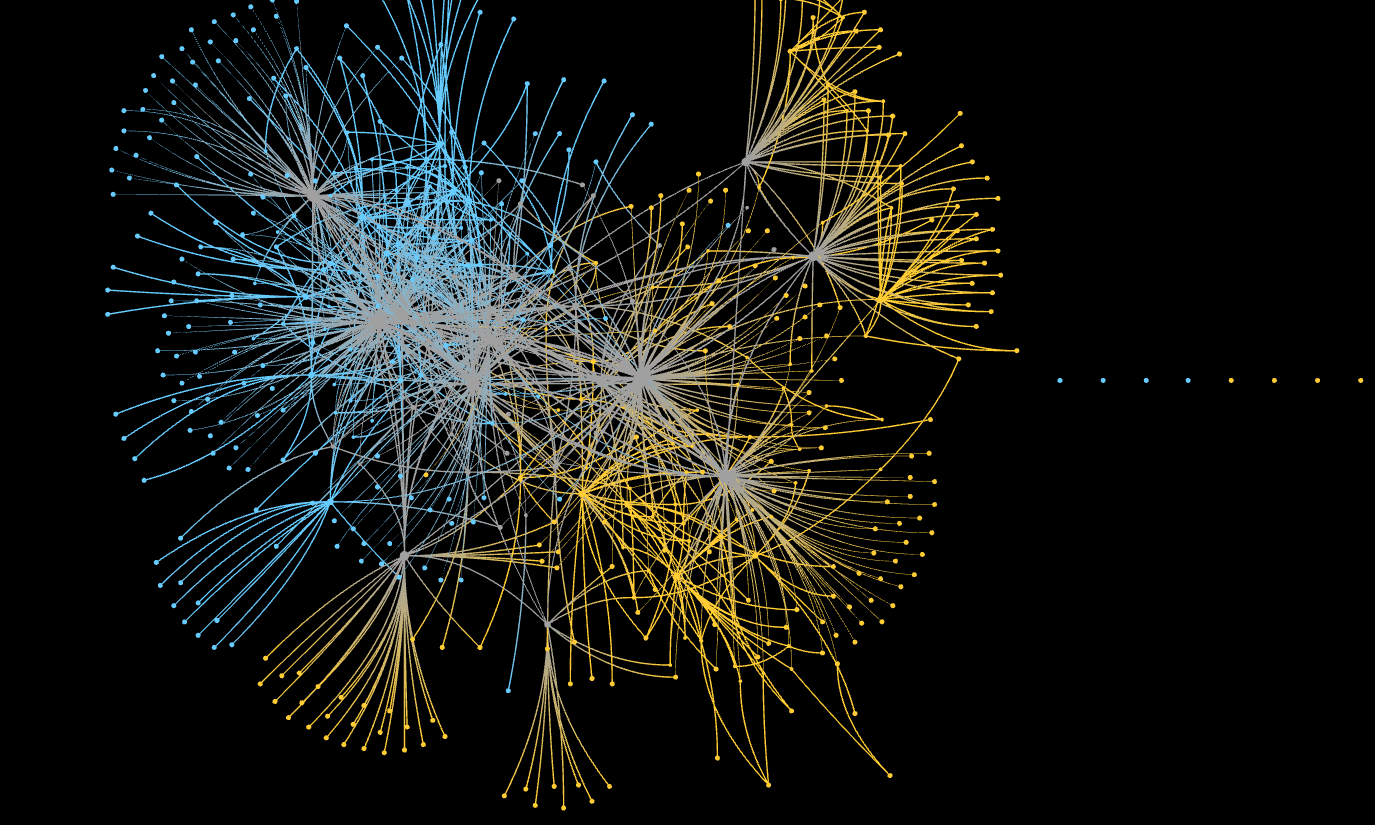
Working on the SSNA white paper has given me the opportunity to sit with the data from three different projects (OpenCare, POPREBEL, NGI Forward) and look for emerging patterns and regularities as I apply various techniques. In the last week I have worked on network reduction. The (social) interaction networks of SSNA projects are usually small and low-density enough that visual inspection reveals a lot about them. This, for example is the joint interaction network of both POPREBEL (yellow) and NGI Forward:

two_studies_network

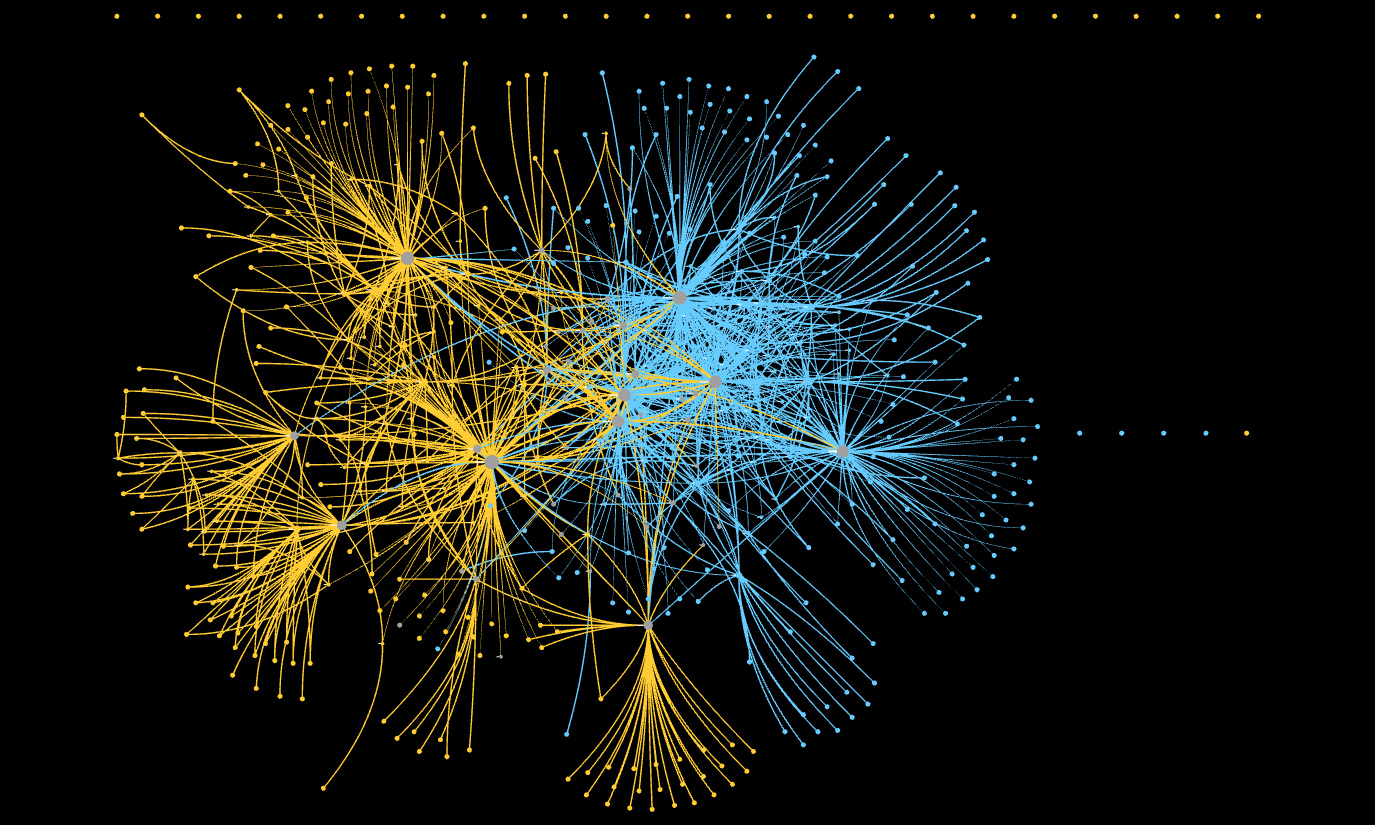
The human eye can immediately make sense of it. Notice how neatly they resolve into the two subnetworks, while the respective communities are still in contact via the people who participate in both discussions (gray nodes). This is a nice result in itself, wonder if @melancon and @brenoust have some comment to make!

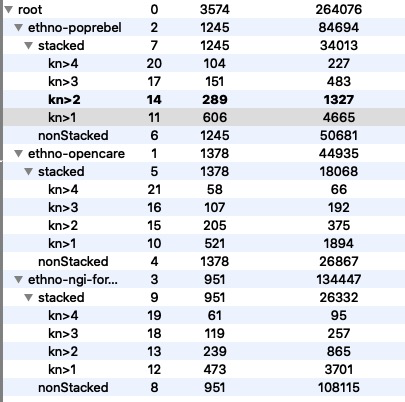
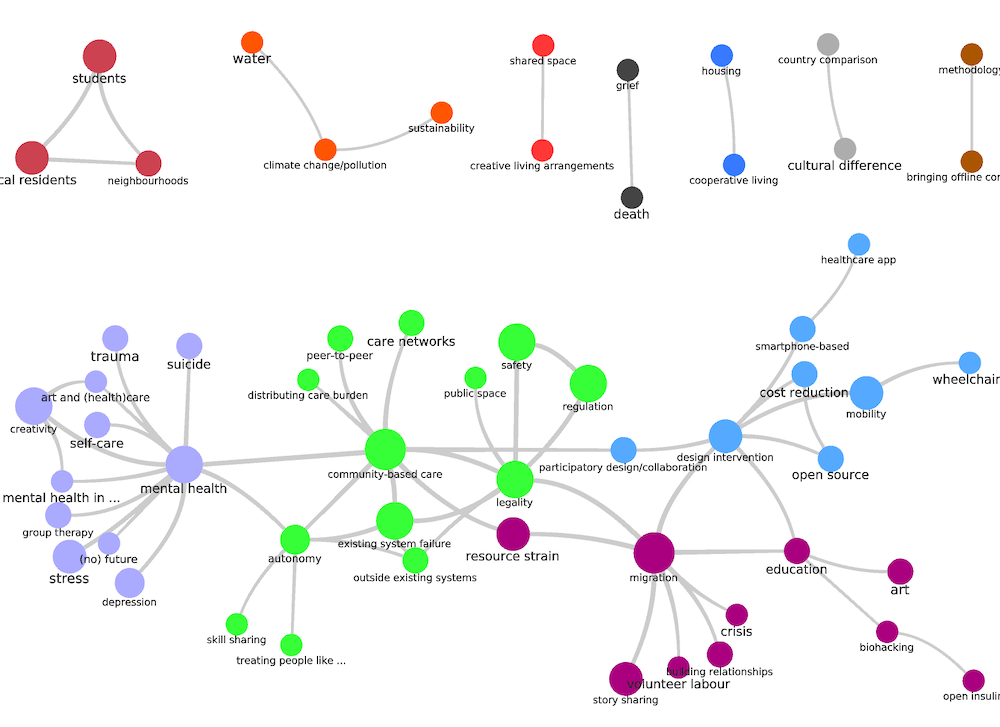
The situation is different for the codes co-occurrence networks. These are very dense by construction: if a single post is annotated with 20 codes, it gives rise to a 20-clique between all these codes. This means adding 20 x 19 / 2 = 190 edges. And it is just one post! This is why, in Graphryder, we need a good filtering utility. Traditionally, we filter by count of co-occurrencies. This is fairly effective… but really, the effectiveness depends on the intensity and style of coding. The more annotations there are, and the more coherent the ontology of codes (which reduces the number of nodes via merge), the denser the graphs become.

image

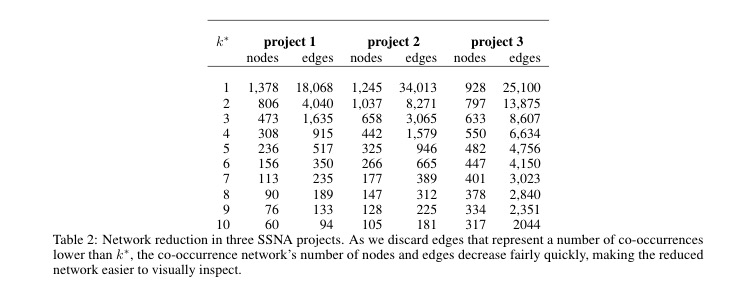
For OpenCare (project 1), discarding edges with k=1 already reduces the edges by almost 80%. But for NGI Forward, with a tighter coding practice, that reduction is less than 50%.

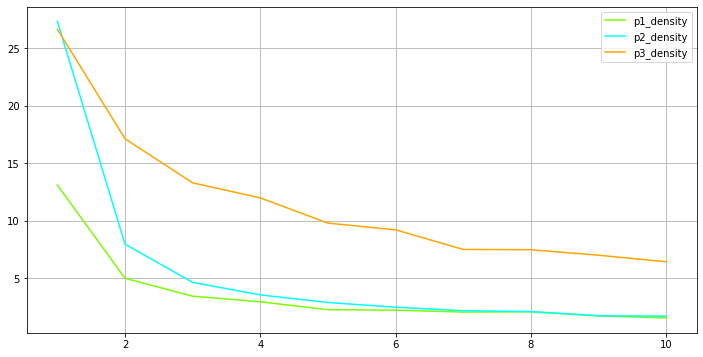
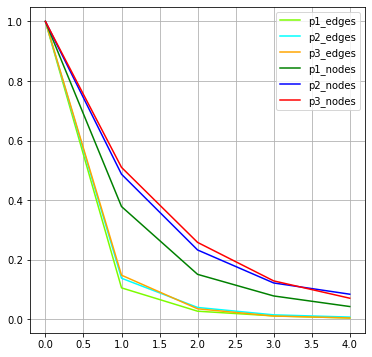
Reduction is effective for low values of k, then it tends to plateau. Nodes decrease slower than edges, and there are differences across projects. A visual representation of this:

net_reduction

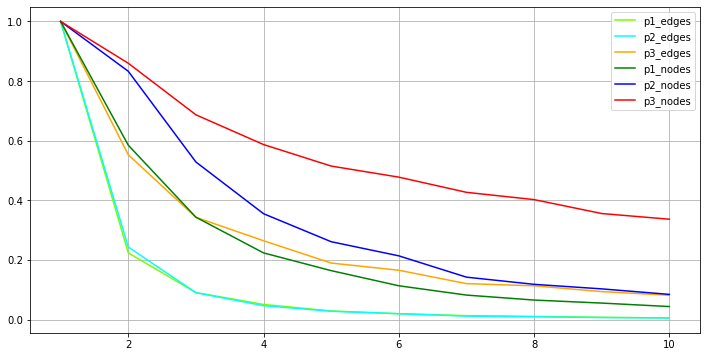
Density (number of edges divided by number of nodes) also decreases. Guy has a paper somewhere arguing that humans process best networks with density lower than 4.

net_reduction_density

So, I decided to explore a different reduction technique. The reduction implemented in Graphryder, based on k, is a sort “one post one vote” mechanism. Given an edge e, k(e) is the number of post associating the codes connected to each other by e. Now, let kp(e) be the number of authors of the posts that have made that association. What would reduction based on kp(e) look like? And what does it mean?

What it means is “one person one vote”. Suppose Alice has authored one post where code1 and code2 both co-occur. Suppose Bob has authored another one. Call e the edge code1, code2. Now

k(e) = 2
kp(e) = 2

Now suppose Alice believes code1 and code2 to be really important, and deeply connected. She writes five more posts where she makes the same association. Now

k(e) = 6
kp(e) = 2

Alice only gets one vote on e. Additional posts by her will not further change kp(e). The only way that kp(e) can go up is if someone else, say Chris, writes a post that also associates code1 and code2. From a social theory perspective, the main disadvantage of this method is that it loses the information about how important the connection is in the world view of each individual contributor.

However, there are merits in the special case of a reduction by dropping all edges where kp(e) = 1 . In this case, any connection that has been brought up by a single participant in the corpus disappears as a one-off, even if it resurfaces in several contributions of that participant. This seems to be consistent with the way we think about “collective intelligence”.

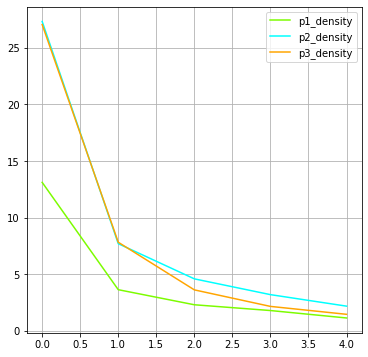
Since, by definition, kp(e) <= k(e), reducing the network based on the values of the former is more effective than on the basis of the value of the latter. Now, for all three projects, 90% of the edges are discarded just by moving kp from 1 to 2.

image

Density also drops faster:

omov_net_reduction

omov_net_reduction_density

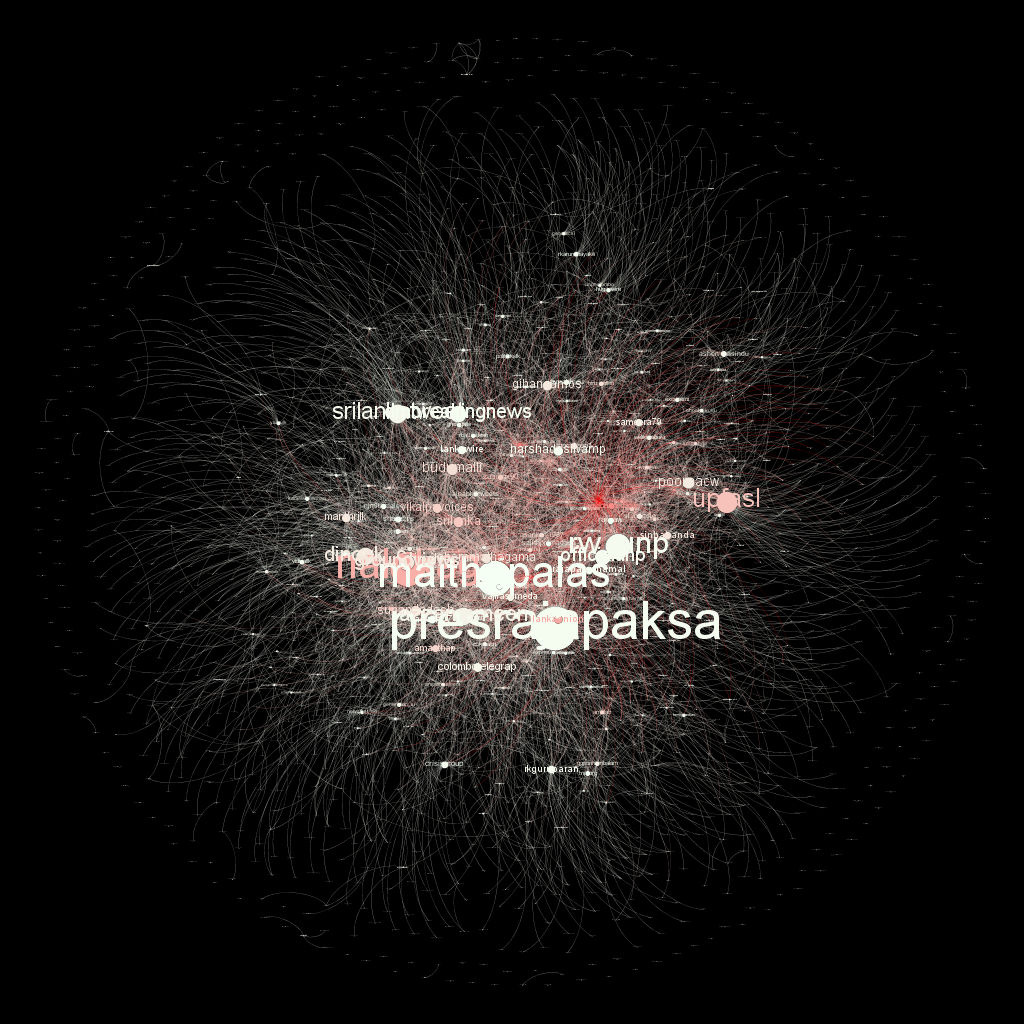
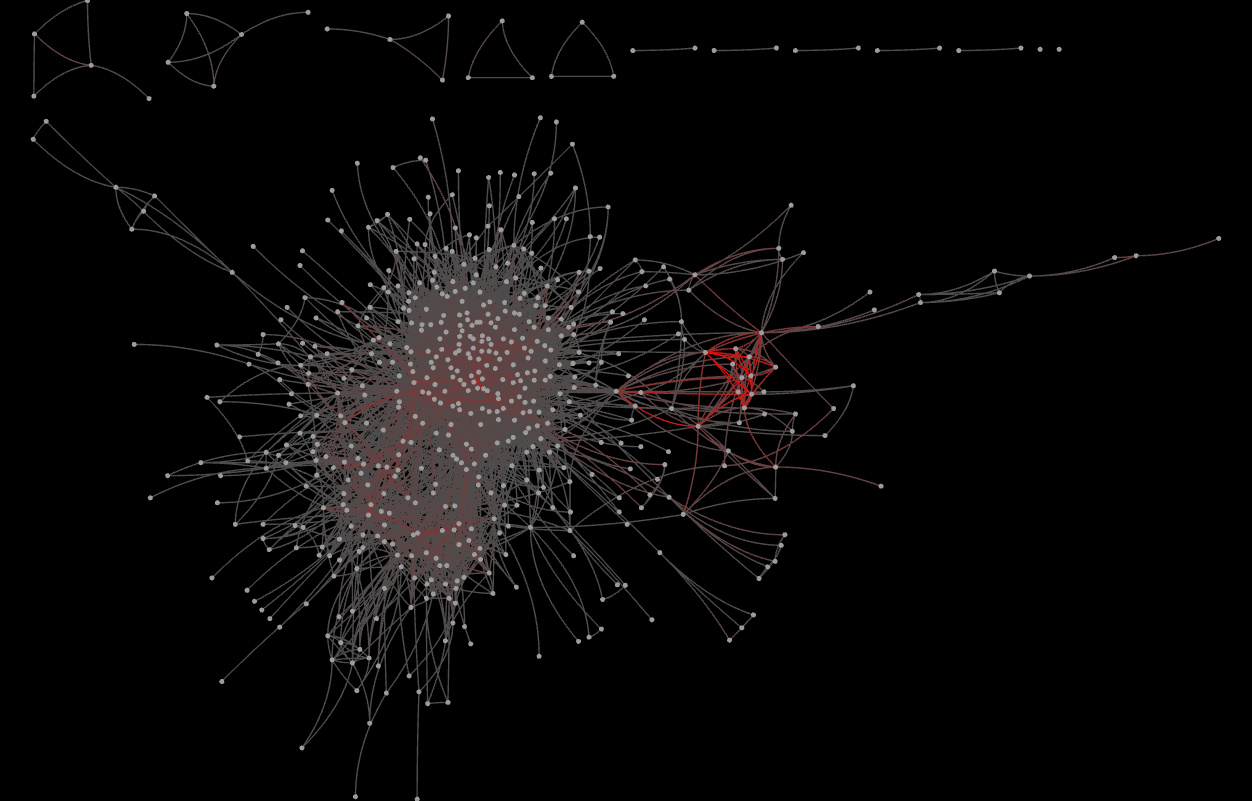
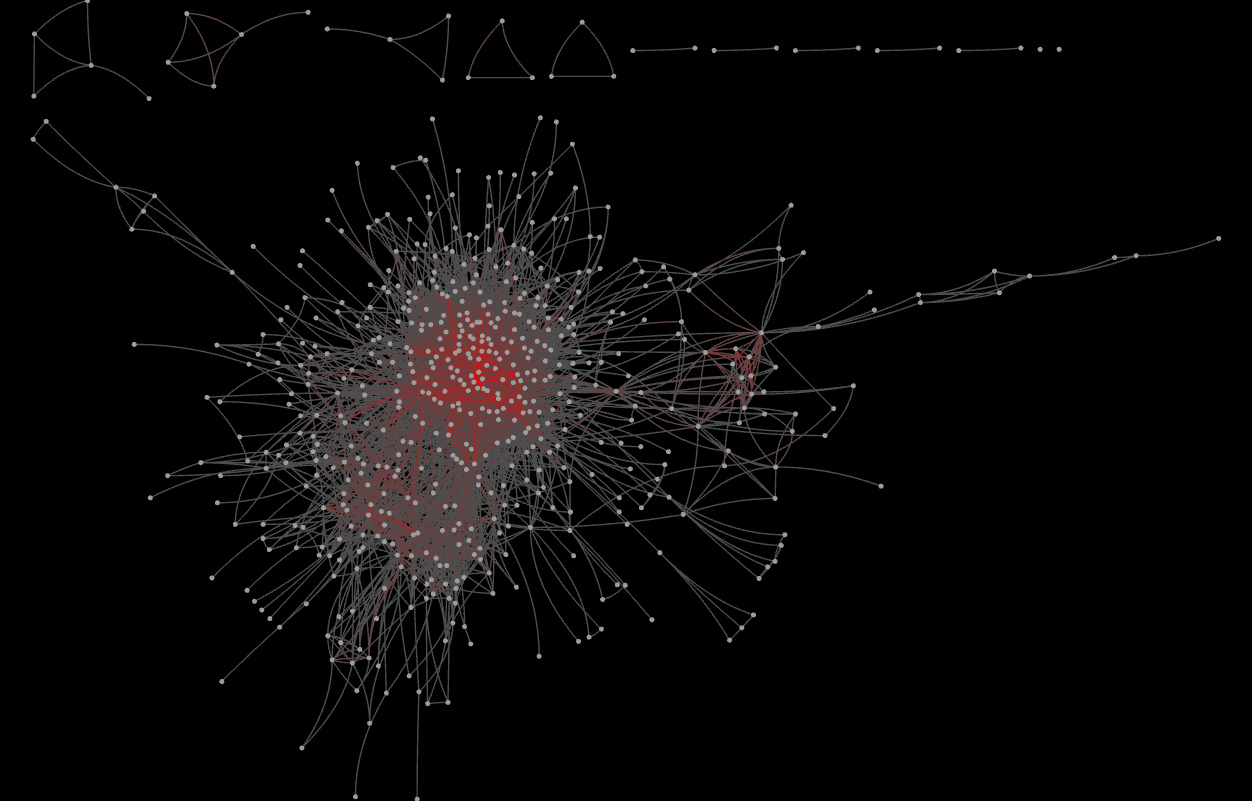
It is worth noting that the correlation between k(e) and kp(e)is positive, but weaker than I expected: less than 0.3 for our whole dataset. This means that the two reduction methods emphasize (in part) different connections. Below, you can admire the codes co-occurrence networks of POPREBEL, already filtered by kp(e) > 1. Redder edges denote higher number of co-occurrences. In case you are wondering, that bright red cluster contains healthcare, low quality, medical treatment, Prague etc.

ngi_kp>1_red_to_k

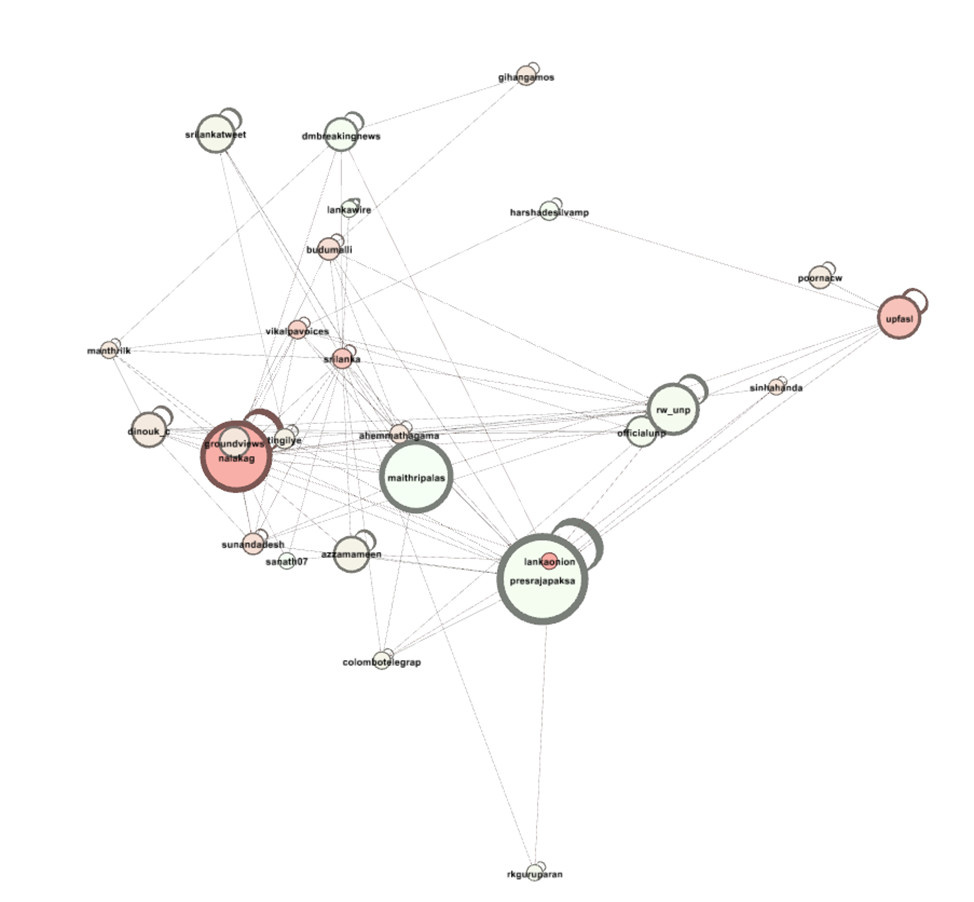
Here is what happens if we color-code for kp(e):

ngi_kp>1_red_to_kp

Quite a difference! The bright constellation at the center links codes like Law and Justice Party, big cities, inadequate income, social benefits, and low quality of the health care system.

In general, as so often in data science, there is no “best” (Dutch “allerbeste”) method. The preferred reduction method depends on what you are interested in.

@amelia, @jan, @Richard, @Jirka_Kocian, @Leonie, @katejsim, @Wolha: I would welcome your thoughts on how well “one post one vote” and “one person one vote” mesh with the ethnographer’s research ethos.

The good news is that I have already implemented the code to compute kp(e) when stacking the codes co-occurrence network. :slight_smile:

2 Likes

Great work! This is quite a synchronicity because I’ve been playing with this idea too for reducing the Babel network because the coding practice in that project is a lot looser than in the research projects!

In fact, this is closely related to the idea I mentioned in the SciFi Economics call with @yudhanjaya and @Joriam. This idea is what enables what I mentioned in that context - that perhaps it might be possible to estimate the influence a contributor has had over a conversation by counting how often they are the first person to make a connection that others then also make.

Could you link to the code? I’d love to implement it too.

It would be interesting to look at what codes are left in the respective networks. Could you generate the networks at kp(e) = 2 with labels at a high enough resolution to zoom in and read?

Try downloading this Tulip perspective, so you can explore interactively. In fact, all three projects are in the same file. Download Tulip, launch it and open the project from within Tulip (I don’t think double clicking on the file’s icon works).
image

1 Like

Hi Alberto,

Great work!

Quickly, just by curiosity, on your first joint interaction network, could you draw your gray nodes in green, and their links too, this might help reveal the intensity of both communities mix (I am saying green because you have yellow and blue on each side, but frankly it could be any color that make them visible).

About your filtering strategy, you might be interested in the work of Zachary Neal who has worked extensively on the domain. Maybe you can find this one of particular interest: Identifying statistically significant edges in one-mode projections.
Note that similarity of codes in such a context might also be of interest to you. You could use a word2vec modeling as we did together back in Milan to measure the distance of codes, or use a Burt’s approach (coming back to the roots of layer entanglement, with his article Relation Content in Multiple Networks). You can also get interested in using entanglement itself, it has been publicly release on py3plex (and I can give you something on Tulip if you want).

Recalling Guy’s work on low density for readability, I think you have an excellent point here, it might be an interesting paper, to fix this as a constraint, and compare the interpretability of different graph filtering methods with hyperparameters tuned to only keep a density <= 4 :slight_smile:

Excellent work as always!

@alberto this is very interesting! To go on what @hugi was talking about: what happens when you arrange nodes by their betweenness centrality and scale them to the number of contributions? Eg: this (something I did for general election with Twitter data)

image

Resolves to this:

image

(Because this was Twitter, size is set to amount of content pushed out; redness is set to number of interactions / RTs - so it captures not just addition of content to conversation, but also interaction with other nodes). The trimming criteria can be switched between centrality and interaction to generate different and interesting results.

Could this capture the dynamics of collaboration well enough to be useful to you?

Ben, you are always so encouraging… thanks so much.

That’s doable, but I fear it would misrepresent the data (see the quick hack at the end of the post). Some of those gray nodes there are super-active Edgeryders members like myself and @matthias. We interact across many different conversations hosted on the platform, but not all of them are represented. Only the ones relative to the two projects are, and they belong to either one or the other project. The color-coding choices mean to represent a dataset where the interactions only pertain to one project, but the interacting participants might be participating in one, or the other, or both. You can also think of this as a two-layer multiplex, but since most nodes belong only to one of thew layers a 2-D representation is intuitive.

In turns, this representation has a social science interpretation. This: there are people who participate in one debate who are also exposed to the other. Generalizing (which I can actually do by computing a whole-platform interaction network), that means that there is at least the possibility that relevant knowledge could be “transported” from one conversation to the next, carried by people who participate in both. In other words, you have the possibility of an efficient collective intelligence engine: a new project attracts domain specialists, who only participate in the one project, but also some generalists with historical memory of what happened before. The latter can point to relevant contributions made in the past, re-involve people that made them, etc.

As I recall it, we were not so happy with word2vec… are you referring to the work done by that Spanish researcher? But that was in Bordeaux, no? I am not familiar with that Burt article, I will look it up. And about entanglement… good idea, how would you describe the rationale for using it in this case? I am looking for paths to reduction whose rationale is (1) theoretically grounded, and (2) fairly intuitive to anthro/ethno researchers.

@yudhanjaya, you surprised me! Here is something else we have in common besides starships exploding in deep space. Is that Tulip I’m looking at? :wink:

I am not sure the method you propose here is applicable to codes co-occurrence networks. These are not social networks, nodes are ethnographic codes. What is your thinking?

@brenoust Here is a quick hack based on setting “interpolate color” to “on” in the scene. I think it is less intuitive than the original one, what do you think?
image

Well, at some level, both are graphs…could you adjust the size of nodes by properties like their centrality a network or weighted degree? That would let you easily represent nodes that, if severed, would have outside impact on the network. It would also let you filter out nodes and generate multiple views by just looking at the distribution of centralities and dropping nodes on certain quartiles or below the mean centrality.

@yudhanjaya, you surprised me! Here is something else we have in common besides starships exploding in deep space. Is that Tulip I’m looking at?

Haha, good to know! Some of my research work involves comparing networks of bilateral migration and trade to the global network of Facebook friends links (between 2+ bill people), aggregated at nation levels (https://papers.ssrn.com/sol3/papers.cfm?abstract_id=3140408). I mostly do the data work in R and pass it into Gephi or D3.js for viz.

Still waiting for someone to step up and code the nodes as cats… ahem @matthias - asking for a friend :)))

1 Like

Oh, yes. Normally I like to map node size in the codes co-occurrences graph to the number of occurrences (without “co-”). This emphasizes codes that occur many times in the corpus, even though they might not be highly connected. In this view in particular I overrode that – the emphasis is on edge color, and tampering with node size would have been a distraction.

Indeed. But I am not sure how to interpret those pure-mathematical properties in terms of this graph in particular. If you are thinking of a communication network (internet servers, or a power grid), robustness to random/targeted removal of nodes has a clear interpretation in terms of a continued service. But here? Even centralities are of uncertain usefulness. What I think might be useful is community detection: discovering and interpreting what makes a group of concepts. The empirical context makes some metrics more useful than others.

In general, our approach to reduction is (from the white paper):

Any network reduction entails a loss of information, and has to be regarded as a necessary evil. Reduction methods should always be theoretically founded, and applied with caution.

1 Like

I see, thanks. How are you generating the community splits here? Are you running something like Louvain or Infomap?

Still in the experimentation phase. In a sense it should not matter: if the network is modular, any algo will do the trick, and if it is not, there is no point in attributing too much significance to a breakdown into communities of nodes.

In a previous paper we ran Louvain on a reduced network and it mapped quite well to semantics:

opencare_k>5 small

I am reading the Burt paper, it is interesting to see how your thinking formed! But I also wanted to ask you: what is your opinion about the “portability” of the method to the co-occurrence of codes? Burt and Schott developed this to make sense of the noisiness of how people (in social networks) distinguish between different relationship. Here we are quite far from this use case. The “engine” of SSNA is simply this: if two concept appear in the same post, the author of the post must be making a connection between them. It may be wrong, but it is fairly unambiguous. I can see how you (for your own work) would want to re-use the math to look at how documents containing keywords connect to each other. But here, what do you think the added value would be?

And two more questions:

  1. do you remember the title of Guy’s paper about density? I cannot find it on scholar.
  2. Would you have the Neal paper? After graduation, I lost my access to the journals… :frowning:

I could not access the paper either from Osaka: Springer is quite annoying… and for some reason I cannot access to scihub anymore.
But an R package is available: Backbone: An R package for extracting the backbone of bipartite projections and probably will help us.

To answer your question about about the portability of the method, I think there is some commonality with the noisiness carried with semantic ambiguity (the hierarchy of a concept, how two concepts address different facets of a same issue, and the polysemy of a concept). This ambiguity is often resolved by associating concepts together, hence why you are so interested in what we used to call the catalyst graph, which is the concept-concept graph based on people interactions.
But I guess this is one of many methods already…