1. Understanding the problem
The SSNA methodology is in principle compatible with any type of ethnographic data, but it was born in the context of what some call netnography, where the corpus consists in dialogic interaction on an online forum. On a forum, each post is a natural unit of discourse contributed by an informant, and we have coded each post as a whole.
When data come to Open Ethnographer in the form of a transcription of an interview, however, there is a methodological choice to make. This is because our main tool of analysis, the codes co-occurrence network, will look very different depending on the number of codes associated to each contribution, which in turn depends on the length of the contribution itself. Because of how we construct our networks, all codes that co-occur in a contribution form a complete network, also called a clique. Cliques are very dense networks. In our case (CCNs are undirected, meaning that (code1, code2) is the same edge as (code2, code1), and no loops are allowed. This means that the number of edges in a clique with n nodes is n x (n-1) / 2. Another way of looking at it is that the number of edges grows proportionally to the square of the number of codes.
These considerations are important when you are dealing with long interview transcripts. The extent to which you decide to break it into separate contribution implies profound changes to topology of the codes co-occurrence network (CCN). The CCN emerges from the superposition of the various cliques generated by coding the various contributions in the corpus. So, the more pieces you break the transcript into, the less connected the CCN will be. The number of nodes (the codes) stays the same, no matter how you decide to break down your transcript.
2. A toy example
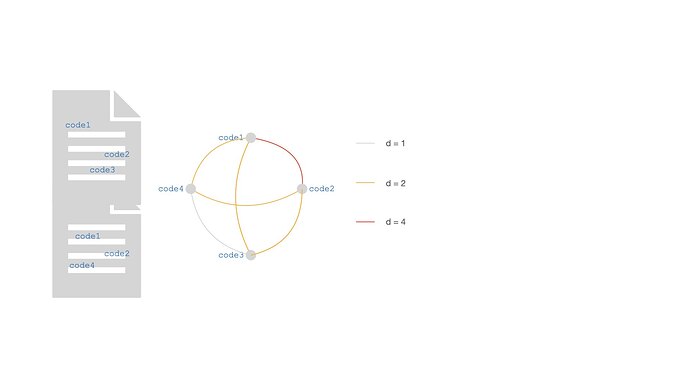
Let’s see a visual example:
Here, an unbroken interview transcript is coded with four codes, code1 to code4. code1 and code2 appear twice each. The CCN is a complete network (number of edges: 4 x (4-1) / 2 = 6, where each code is connected to each other. The association depth d of each co-occurrence edge is computed by counting the instances of the two codes incident to the edge, and multiplying them together. For example, take the edge code2, code4. code2 appears twice: each instance has a connection with the single instance of code4, so the d(code2, code4) = 2. If you take the edge code1, code2, both codes appear twice: so, the association depth is given by counting the connections of the two instances of code1 with the first instance of code2 (2), plus the connections of the two instances of code1 with the second instance of code2 (also 2). So, d(code1, code2) = 4, which corresponds to 2 x 2.
So, by construction, whenever you code a single unbroken contribution (an interview, a post, whatever) with N codes(leti_cbe the number of occurrences of the codei`), you:
- generate an N-clique, with
N x (N - 1) /2edges. - the association depth
dof the edge between any two codesiandjis equal to
d(i,j) = i_c x j_c
Conclusion: if you are coding one single contribution, there is no point inducing a network! You can arrive at the same conclusion simply counting the occurrence of codes. SSNA is designed for collective intelligence, so for a situation in which the contributions are many.
Here is what happens when we break the interview transcript into two:
Each fragment gives rise to complete networks. The overall CCN of the transcript is given by the sum (not the multiplication!) of the CCNs of the individual fragments. As a result, code3 and code4 are no longer connected, because they no longer co-occur on any fragment. Also, only one edge, (code1, code2) has d > 1.
3. An example from POPREBEL: coding an unbroken interview
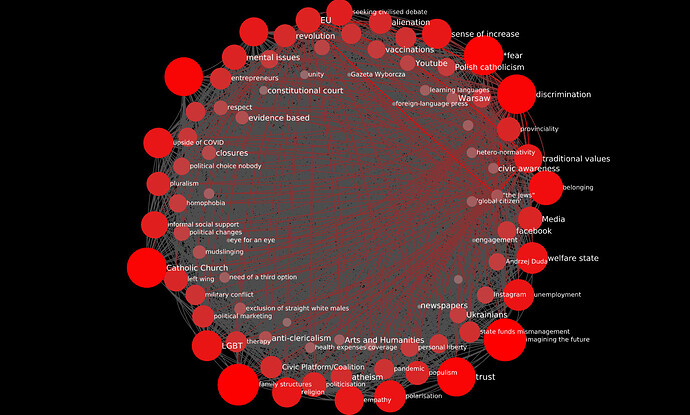
Let’s try an example with POPREBEL data, as requested by @Wojt. We are going to be looking at the same interview, once in the form of a thread, with each question and each answer in its own separate post (see), and once as a whole post (see). These data are not exactly the same, though, because I found 187 annotations in the former and 88 in the latter.
Below you can see the undivided transcript’s CCN. It has 84 codes and 3,486 edges (an 84-clique has 84 x 83 / 2 = 3,486 edges). Redder edges correspond to higher values of d.
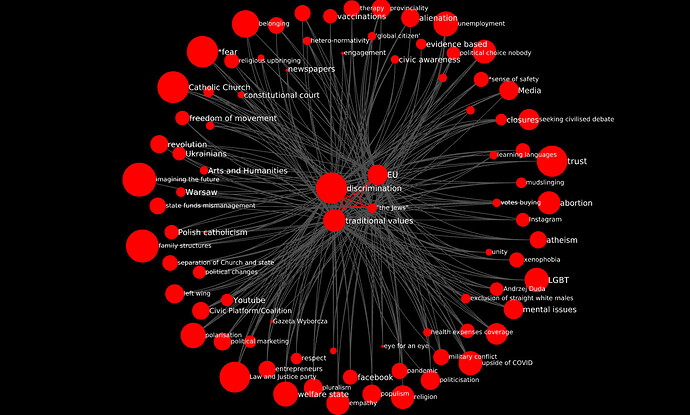
To disentangle this “hairball” network, it makes sense to filter it for higher levels of d. There’s not much granularity, the maximum value of d is 4, and there are only 6 edges where d > = 3. However, filtering for d >= 2 reveals some structure:
All codes connect to one or more of four central codes, which are all connected to each other by high-d edges: discrimination, EU, "the Jews" and traditional values. However, this is purely a mathematical artifact. It simply means that each of these for codes occurs twice, so, by construction, they co-occur four times with one another, and twice with all the other 80 codes, which occur only once.
4. An example from POREBEL: coding an interview broken down into questions and answers
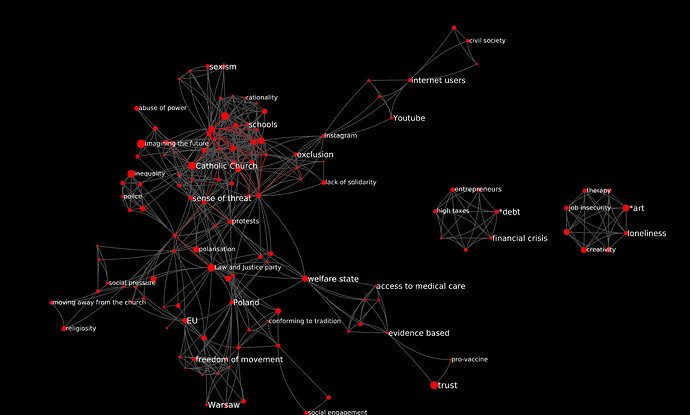
If we induce the CCN from the interview as a topic, we get a network with 130 codes and 569 edges. It has a lot more structure:
Notice the two “islands” on the right: they correspond to individual posts (answers to questions) where the informant obviously “moved on”. These answers do not share one single code with the others. This seems to support the idea that breaking down the transcript in this way is consistent with the sequential way in which this informant was sharing her insights.
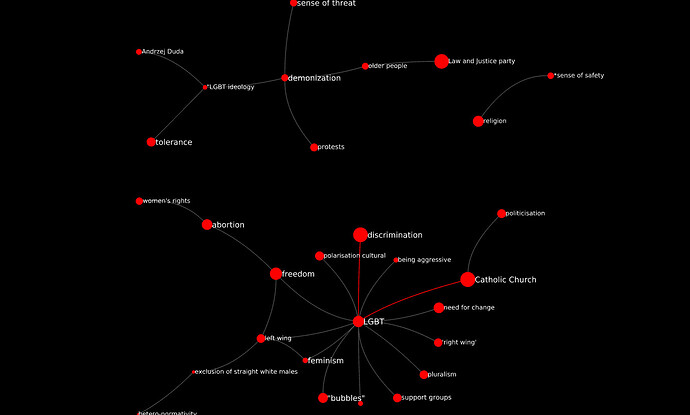
The maximum value of d here is 3, with only three edges having d = 3. If we filter for d >= 2, we get this:
These are three separate islands of codes. LGBT is at the center of the largest one. the two strongest edges in the graph connect it to Catholic Church and discrimination. The latter is the only code that also appears in the central structure of the CCN described in section 3.
5. Conclusions
- When coding a single contribution, it does not make sense to go through the trouble of inducing a network. Just count the occurrence of codes, and work with the idea that the ones that occur most often are most top-of-mind in the informant.
- When coding multiple contributions, the size of the contributions is going to affect the shape of the network. Long contributions with many codes give rise to dense networks, and high-
dedges that arise as an effect of the multiplicative nature ofd. - When coding multiple contributions of different sizes, the longer ones will “dominate”: they give rise to potentially many high-
dedges. Filtering for high values ofdmight then result to the researcher looking at networks that only reflect the coding of one or a few very long pieces. This can be mitigated by using metrics different fromd.
@rebelethno: what do you think?
