Like many online communities, Edgeryders hosts a hell of a conversation. Over four years, 3,000 people have contributed about 4,000 posts and 16,000 comments. That’s a lot of content. But what about quality?
This is an important question. At Edgeryders we care about the quality of written conversation. We believe there is such a thing as collective intelligence.
In Edgeryders, we like to think of online communities as social networks of interactions. There’s an advantage to this: you can visualize the whole thing as one single visual object. Brain cortex is good at processing visual signals, and we all get the basic idea of a network. Things connected by relationships: how hard can it be? With networks, most people can experience effortless understanding of mathematical statements, just by looking.
If you could look at your online community’s network, what would you see? Here are some examples.
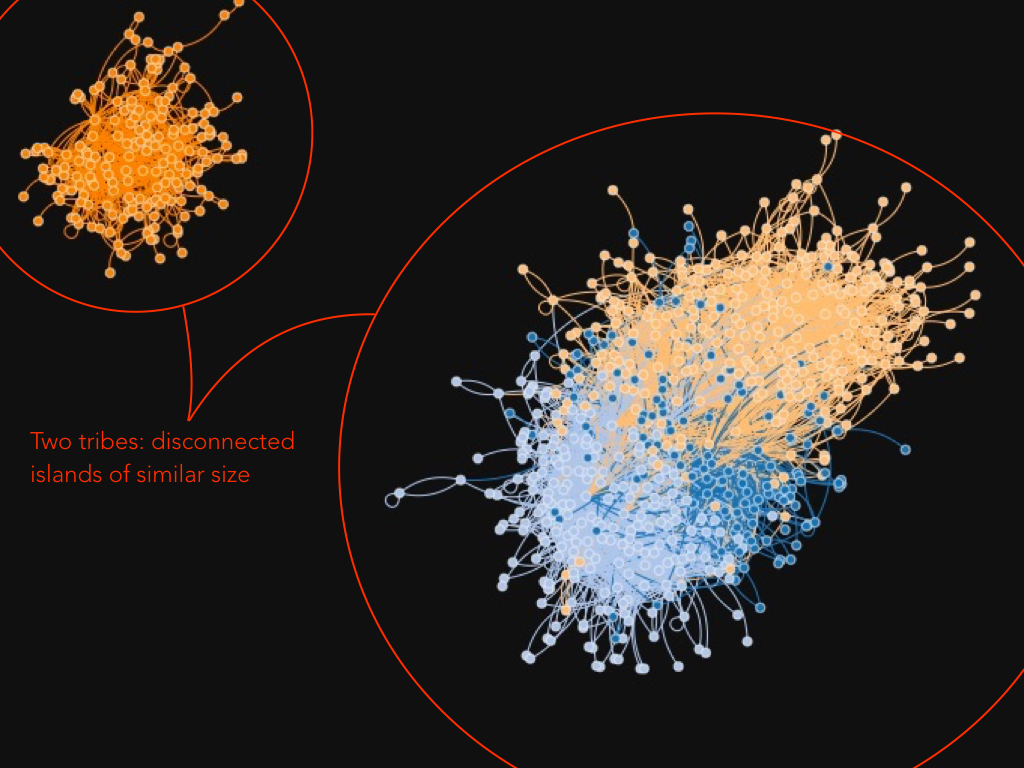
- Most users belong to one or more "islands", but the islands are not connected to each other. Users in one islands have no contact with users in other islands. So, they could be in disagreement and not have noticed. Or two groups could be working on the exact same thing, with each group unaware of the other. We found this topology in the Python Italian mailing list. The French Fablab mailing list has a similar structure, with one difference: three users "bridging" between the two components.
- Some "superstar" users play a large role in connecting many fellow community members to the conversation. Others cluster in small groups and do not take part in the life of the greater community. Others still are isolated: they wrote content, but are not interacting with anyone. You can find examples of all three types of users in Innovatori PA, an Italian community of public sector innovators.

Edgesense is an application that represents online communities as networks of interaction. We developed it for, and with, online community managers. Its advantages:
- Access via browser. No installation required.
- Inline help and tutorial to help you interpret the main network concepts involved. The idea is to not trivialize a complex topic, but rather give online community managers a taste for network science.
- Full interactivity. Pan, zoom, search, try different visualizations.
- Accounts for the role of community managers. How effective are they in bringing users together?
- Shows changes in near-real time. The network is redrawn from fresh data every day.
- Open data ready. Makes it easy to release your conversation graph as open data.
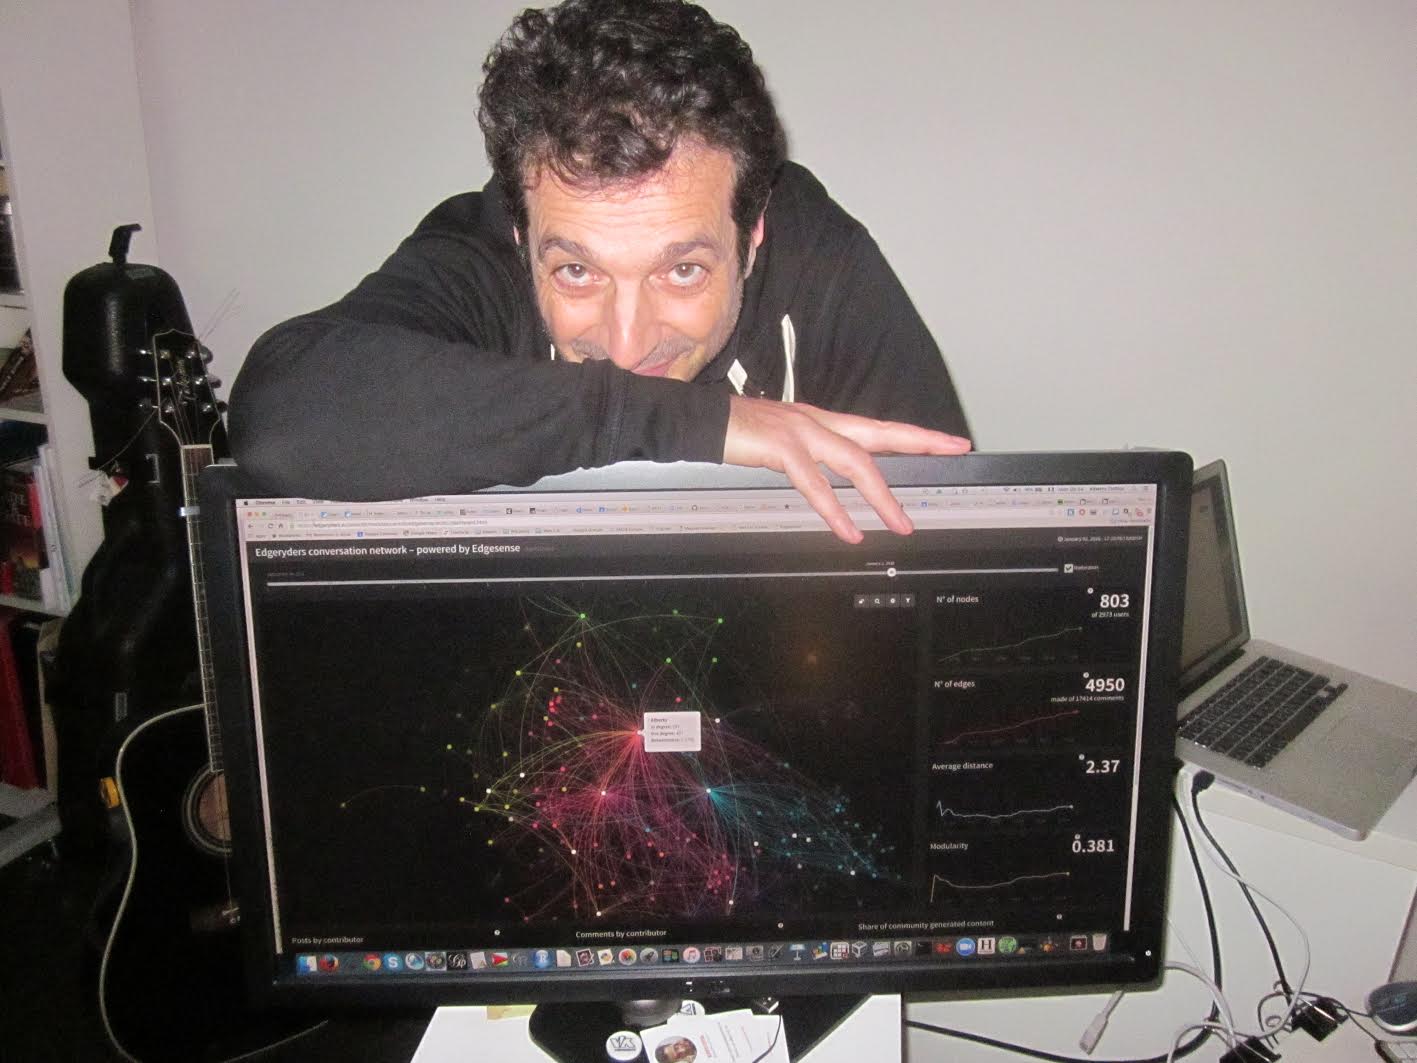
Edgeryders is one of the first online communities ever to adopt Edgesense. We like it so much we have decided to let everyone, not just community managers, play with it. From now on, the Edgesense dashboard will be accessible from the main menu. Click here to see it right now. Don’t worry: you cannot break anything.
Several alpha testers report they like to look themselves up in the network. Some have even posted online “network selfies”, in which they appear together with their ego networks. You can do the same by using the search button to look yourself up. As you make new friends in Edgeryders, you’ll see your ego network grow (allow 24 hours for the script to update). Where are you in the conversation network?
Edgesense is free and open source software, developed by Italian NGO Wikitalia as part of the CATALYST project, with @Luca_Mearelli as the lead developer and myself as network geek-in-residence. Stefano @MoE Cieri ported it to BuddyPress. If you want to install it, we recommend you start at the GitHub repository. Among other things, it sports a wiki with practical information. Online community managers might want to start here.
Edgesense is cool, but it not where it all ends. We will develop it further. Much further, I hope. This is important. I suspect networks are the key to finding the mathematical signature of collective intelligence. It’s just a hunch, but a long one: I have been following it for many years now (I even did a TEDx talk on it). If we find this signature, we can use it as a benchmark to “train” online communities into getting smarter and smarter. The beauty of this plan is this: the smarts of communities does not depend much on the smarts of their members. All the action is in the way people are connected to each other. In a sense, it’s like the brain itself: a person’s intelligence does not depend much on the quality of its neurons. Neurons are all basically the same, biological off-the-shelf components. What matters is the wiring, the patterns of connectivity across neurons.
That’s the future. meanwhile, have fun with Edgesense. We appreciate feedback, suggestions or help with improving it.