Hello @icqe22_authors, here’s an update from me.
1. Pre-processed Tulip files
I have made a folder with new versions of the four files. They include some pre-processing:
-
Edges now color-coded for the relevant measure (association depth, association breadth, redundancy for the Simmelian backbone). Edges are hidden in the highest core values file, which you are better off seeing as a list of nodes and analyzing from the spreadsheet view.
-
Nodes size-coded for annotations count
-
Catholic Churchcolored differently, and pre-selected. You can (and should) play around selecting different nodes and edges, but even when you deselect it,Catholic Churchwill maintain a different, bright color. Beware: when it is not selected it could be hidden by the algorithm.


2. Use Tulip 5.4 (at least on Mac)
The stuff that would not work for me in today’s meeting turns out to be an artifact of Tulip 5.6, the latest release (5.6.2 is the one you have, I was on 5.6.1). Today I re-installed 5.4, and now they work. If you have the same problem as I, do as I did. The following things I think are useful for the present analysis, and now work:
-
The ego network interactor. The interactors are a row of buttons at the top of the node-link diagram. Hover on them until you find
Highlight the node's neighborhood, then hover over any node to highlight its adjacent edges. -
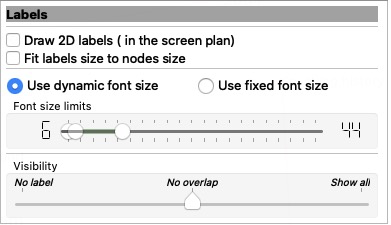
The instant resizing/densifying of the labels. In the node-link diagram, click on the vertical tab
Scene, then experiment with theLabelsslideRs:In the
Font size limitslider, what matters is the left circle, representing minimum size. Recommended value is 6, but that depends on your screen and preference.

3. Computation checked
I checked the association breadth graph, and even redid the math based on my own code, but I get the same results as Bruno. I have checked the vicinity of Catholic Church, abortion and Civic Platform Coalition, but I cannot see anything wrong.
4. Web dashboard
ONLY for association depth, there is an alternative to using Tulip, and I think it is superior, because it is made specifically for exploring graphs representing ethnographic corpora, whereas Tulip is a much more general framework for the computation and visualization of any graph. It’s Graphryder. It requires its own demo, unfortunately, and I am reluctant to put any more stuff on your plate. However, if you do want to push on with it, here you will find some short videos where @hugi explains its main features and concepts.
Also note that Graphryder implements association depth ina slightly different way than that explained in the paper.