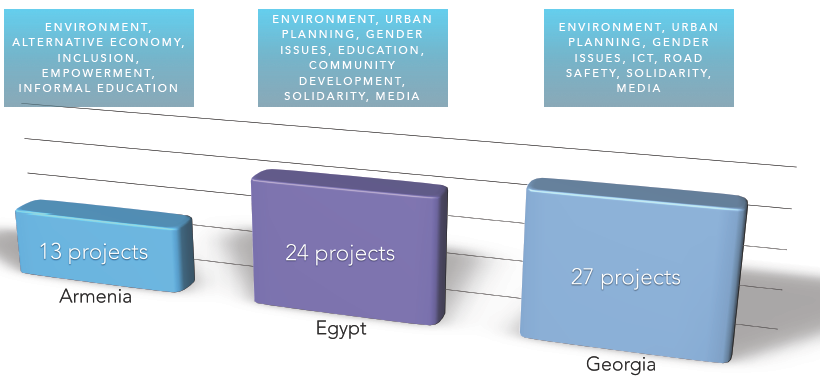
The ethnographic report is once more updated, with tables and a graph of most frequent tags.
I will post a wiki/post with a feedback of OE software on Tuesday, when the Easter weekend is over.
The ethnographic report is once more updated, with tables and a graph of most frequent tags.
I will post a wiki/post with a feedback of OE software on Tuesday, when the Easter weekend is over.
Can I ask for another one? Commitment to keywords/asset
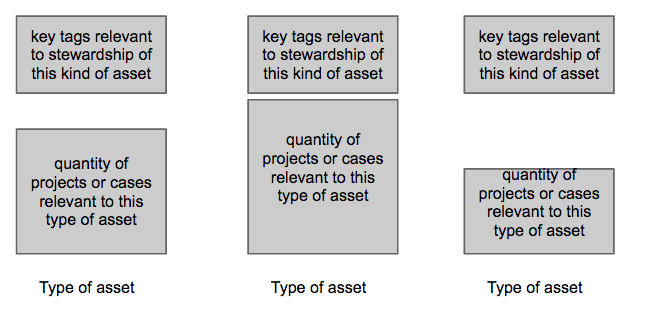
Thank you Inga, it is much richer and easier to “read” the findings and draw personal conclusions with the data and visualisations you have provided. Something which would be very helpful is a table similar to this one:
But instead of countries, it is the kind of asset that is in focus in Stewardship.