It’s been a while since our last analytics report, provided by @saidhamideh in the summer following Spot the Future project in Georgia & co. What follows is information I found useful when checking how we’ve been doing in the past months, before and after the LOTE4 community event. I don’t have Said’s training in this, so bear with me.
Why do we care about this?
We’d like to learn and get better at bringing as much knowledge possible on board of Edgeryders and have it benefit as many community members. The more we understand how numbers work, the more focused our engagement can be, and the easier to not waste anyone’s time as they land here on the platform.
Website analytics over the last 6 months
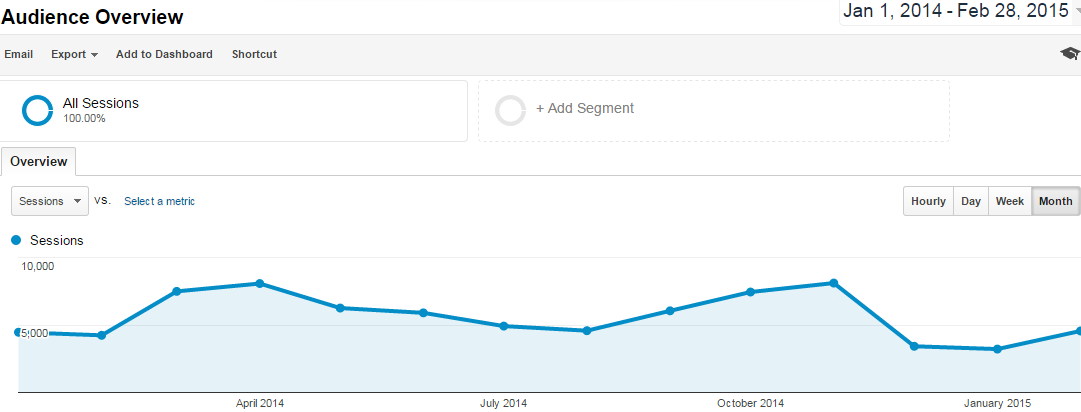
- Total site visits: 32.8K (highest in the whole year was November with >8K).
- Total no. of visitors: 20K
- Average time spent on the website: 4 mins (lower than the rest of the year average of 5'+)
- Pages per visit: 3
- Bounce rate: 62% (percentage of those leaving the site without interacting, higher than the rest of the year average of 56.7%)
This is how lote4 preps & aftermath look like from a birds eye view - a growing trend in site visits until November, decrease in Dec and Jan, and recovering now. Notice that compared to the decreasing trend during Spot the Future, Lote4 was on an ascending trend, attracting more visits as we were growing close to the event and even more in its follow up. Compared to Spot the Future which was using a global platform to target people in a small geographical region, the ER community event had a more global audience so it fared better.
Social traffic
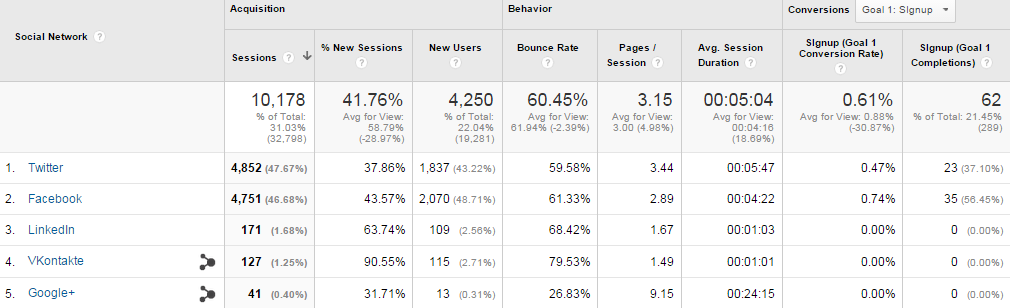
“We are conscientious about the possibility that we are over-tweeting and potentially hurting the Edgeryders by posting too many tweets that just read like advertisements. The low number of retweets per tweet is proof that our messages aren’t being socialized” (Said)
My biggest discovery so far is the change in traffic sources: only 31% of website traffic came from social channels compared to 40% before. Organic searches are now first and bring in twice more signups than social activity. Also unlike before, twitter is turning to be more useful than Facebook in visits and depth of site browsing. Facebook still drives slightly more signups than twitter. LinkedIn is third since we recently started to use it, anyone have an idea on how to manage professionally a LinkedIn account?
Content wise, the Projects page is still the most visited after the homepage. Here are most popular community written posts (now’s probably a good time to make sure you haven’t missed them!):
- Vinay's experience in Belarus: Other People's Utopias (432 pageviews)
- Nadia's post on Shaping the future of digital social innovation agenda in Europe (298)
- Alberto's account about Monasteries vs. unMonastery- after a deep conversation with Father Cassian (288)
On twitter
I record manually the no. of followers our Edgeryders account gains every month. They are growing by steady rates, with the busiest months of the year being spring and autumn months: about 110 new followers versus the lower 70 throughout the rest. “Coincidentaly” that’s when the biggest community projects have been taking place - Spot the Future, the unMonastery or Living on the Edge series.
Popular posts bring the numbers up of course, like the major boom last week, most likely due to Nadia’s posts on Europe’s digital agenda.
In terms of tweets performances, I’m not using any app (Said used BufferApp), but you don’t need an app to see that the same trend as last spring is going on - very few RTs (avg 2-4 based on my intuition); we pushed more with Lote4 stuff and less so during Dec-Jan.
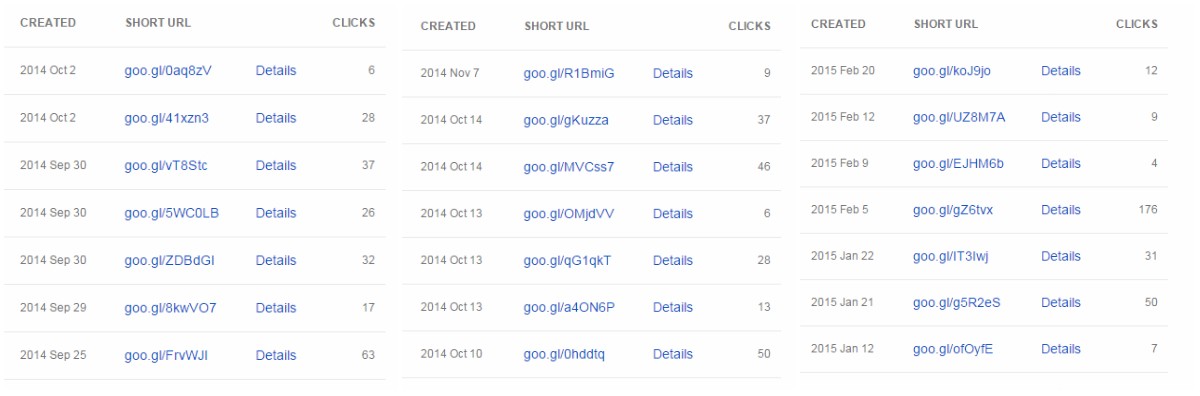
Goo.gl links
We don’t do trackable short links with religiosity, only for content we consistently push out. Now, over Sept and Oct we had a proper social media team who offered to help push out the short links, so you see the numbers are consistent throughout. In Jan-Feb however, content mostly drives itself (only from @edgeryders official account), with bigger variation. True, the 176 clicks in the right column are due to paid work opportunity. The differences are not so big though (I had pushed minimally throughout Jan-Feb), and the opportunity that I see is that we only need to tightly mobilize half a dozen people to commit to a daily/ every other day task of sending out the tweets to maximize potential. After all, some coordination in a community is crucial to achieve any goals, otherwise we would be a community.
Any thoughts or remarks you can add? If you wish to have access to the site analytics please email me at noemi@edgeryders.eu.
A more deeper way to look at the way people experience Edgeryders is by looking at the user life cycle and content creation trends on this platform. In the upcoming weeks @Hazem and myself will create a report on that, using Edgesense web application.