There are various entryways available from which one can assess the success of a marketing campaign. As the person who was primarily in charge of communicating our campaigns through Twitter, I have detailed analytics about the click rates on specific tweets posted between the period of April 15th and June 15th, 2014. It is important to note that this time-frame spans the occurrence of two significant campaigns – the UNDP/Edgeryders Spot the Future Campaign, and a “Twitterstorm” which was a more acute event designed to support the former, which was a multi-month campaign.
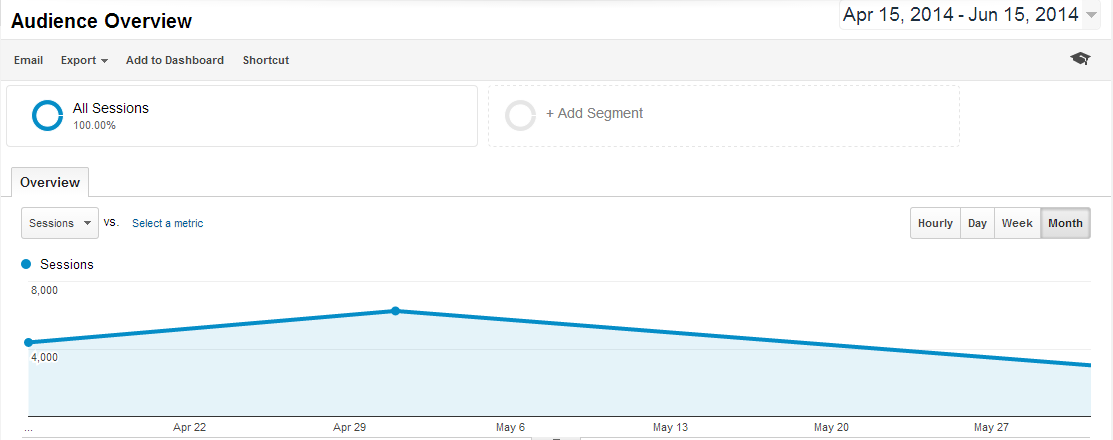
While there may be many ways to slice and dice the data, the big picture remains unmistakeable, and surprising – overall visits to the Edgeryders.eu web domain actually decreased significantly over these three months.
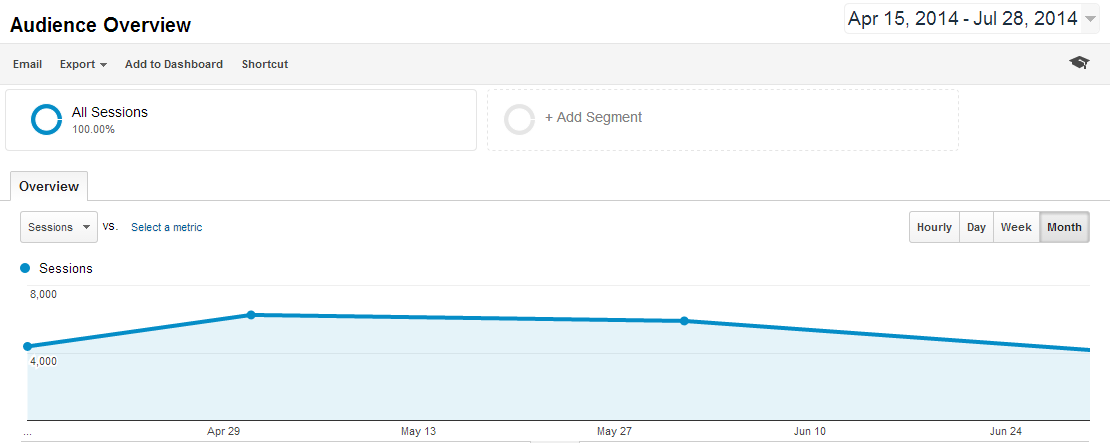
I have checked to see how Edgeryders fares later in the summer up through today’s date. Traffic recovers, but the trend resembles an economic “staglation” curve.
“Stagflation” from April through August, 2014
Let’s see how the this 3-month period of time looks like from a bird’s eye view.

Over the last 3 years, since 2012, enthusiasm for Edgeryders can be basically identified and divided into three major “peaks”, which seem to occur about once a year. My three month tenure manning social media accounts did coincide with our 2014 “peak” although I cannot claim any credit for attracting the traffic. Common sense dictates that these patterns can be attributed to strength of various programs being run.
Generally speaking, I try to invest as much work into program design as possible, since I am aware that the success of the “messenger” job function is almost entirely dependent on the program strength (assuming they know what they are doing). Unfortunately, when I began dabbling in the Futurespotters program itself (i.e. content structure), it led to lots of confusion and Nadia asking me to work on other things. I had no problems with this and continued the job of creating tweets or relaying pre-existing ones, occasionally also working with Facebook (however Dorotea Mar did more work there).
My assumption is that the web traffic going to Edgeryders.eu was not in anyway impeded by some kind of social media malpractice. You may consider that peak of traffic and the Futurespotters campaign itself to be a success. Perhaps it is, I am just not claiming to have had a substantive impact on it. I mostly just created, managed and organized messages which were relayed.
Tweet performance
I used BufferApp for its convenience as a tweet scheduling tool, but another nice feature are the analytics it provides which shows how many people clicked on a given tweet. Here is an example:

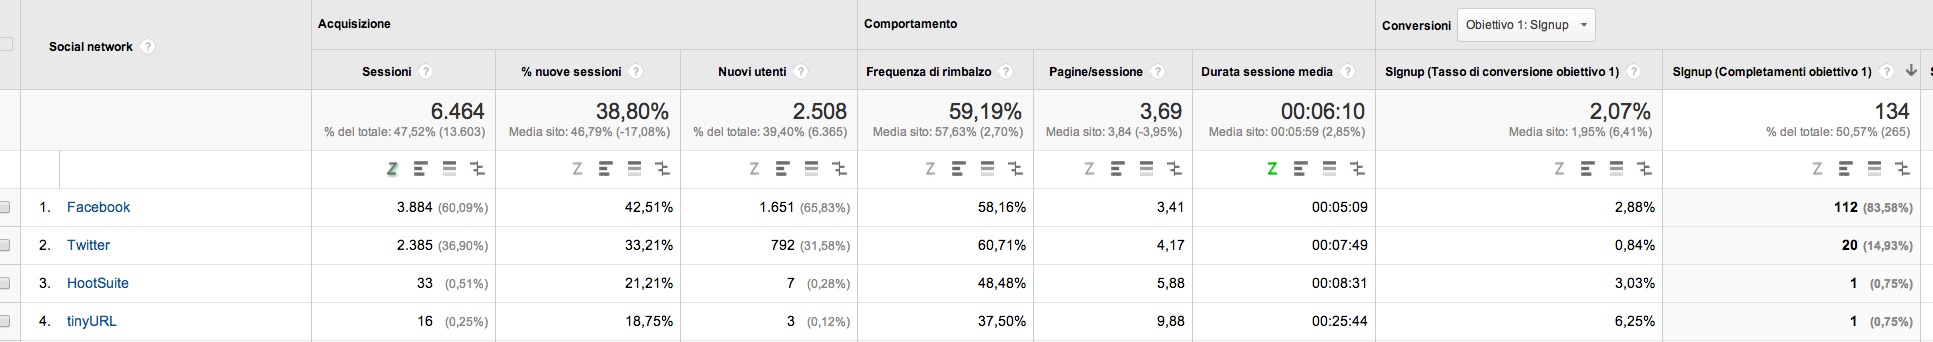
Because there were so many tweets posted (and I don’t have the premium version which would allow me to export into a spreadsheet), I will not include them all – but most of the days looked like the screencap above. On average one tweet leads to just a handful of clicks at a time, oftentimes from a core edgeryders member. While the chart below does prove that Twitter is our fourth largest referral source after Facebook, direct traffic and organic search traffic, we also know that we posted lots of tweets (proven in the fact that each tweet doesn’t generate many clicks, but overall Twitters still brings in many clicks).
We are conscientious about the possiblity that we are over-tweeting and potentially hurting the Edgeryders by posting too many tweets that just read like advertisements. The low number of retweets per tweet is proof that our messages aren’t being socialized.
With the exception of the Twitterstorm, it’s safe to say that the way we use Twitter currently doesn’t resemble what a successful outreach campaign would look like. As currently used, it might be more useful as a communications platform to keep members apprised of relevant information – but I personally don’t think there is some magic bullet solution (i.e. creative hashtag stuffing, and other optimization tricks) that some other social media strategist will try to sell you. I believe that any real changes you’ll witness will continue to reflect on the overall strength of a program’s ability to create a user experience or a desirable exchange of value between organization and audience members. This might be a sort of long way of stating that I am sad that we did not reach a 10% growth in traffic, month over month, which is the objective that I created in the social media proposal. But when I created the proposal I probably overestimated my capacity to add value at the inception stage of the Futurespotters program.
My recommendation is that in the future, we shy away from hiring “social media” practitioners and move towards investing in designers of organizational programming – people who can create the winningest campaigns before a single tweet or Facebook status ever gets posted. Again, this is not to say that Futurespotters wasn’t successful by certain measures-- but simply the outcomes you see today were already determined in the DNA of the program. The social media practitioner will only be able to express the DNA, so to speak.
Is there hope for social media tactics?
The chart below proves that social media channels bring in traffic. Facebook is the number 3 referrer and Twitter, number 4.
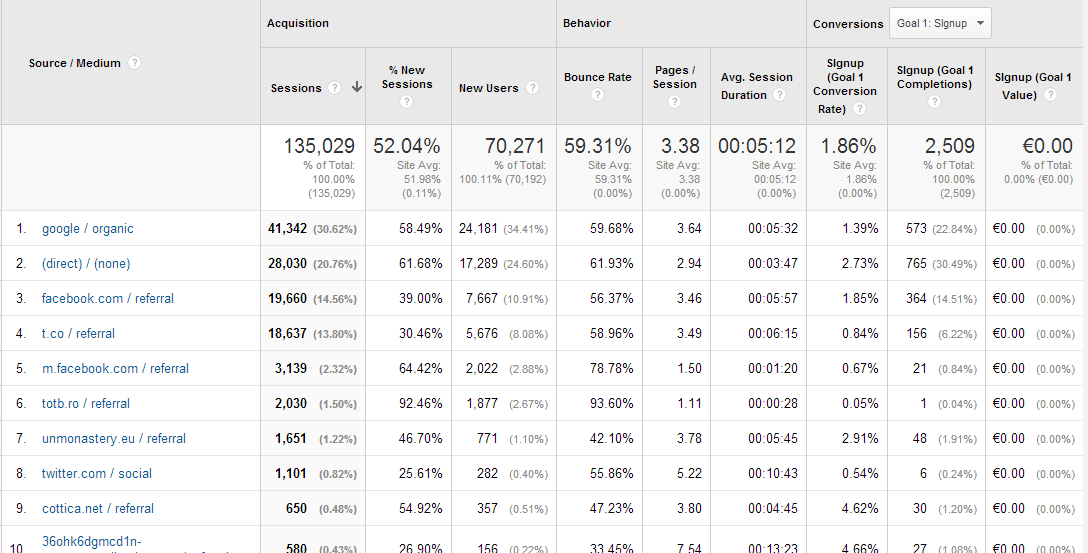
The real question, however, should be – what is the quality of this traffic? What do these people do once they have reached our destination pages?
The quick, depressing answer is that most traffic that landed starting April 15th, 2014, bounced off any Edgeryders.eu page within the first half minute:
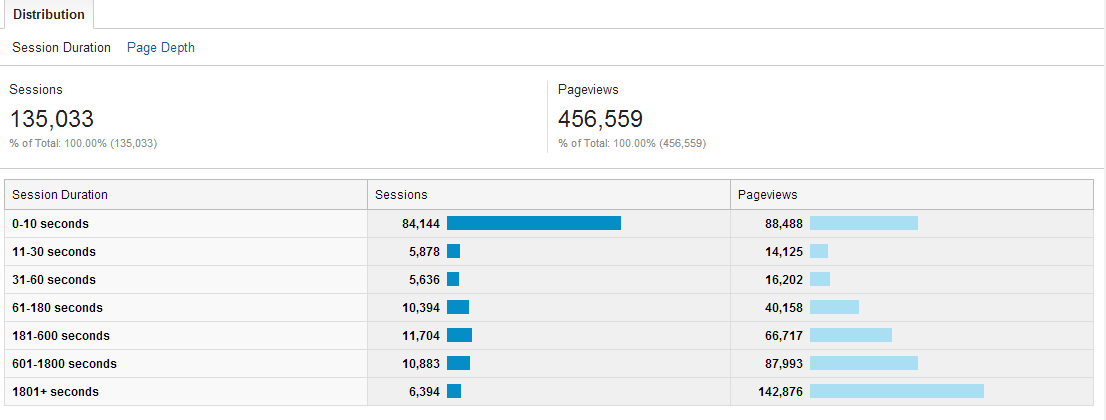
This is a very important statistic which cannot be ignored. Why are they leaving so quickly? Are we targeting the wrong people? Or is the audience fine, but we are lacking something on the content and program side? Of the 16,000 or so visits that lasted more than 600 seconds, how many were from core members and employees who are bound to be clicking extremely frequently? Should we be turning away from mass communication strategies and working on more one-to-one networking relations? Unfortunately, I am not in a position to investigate these questions at the moment as they reach the very core of the organization.
From experience, I will say that the social media performance will do much better once bounce metrics above change and start reflecting more genuine interest from general audiences we target.
Areas to explore further: Facebook + Pagemodo
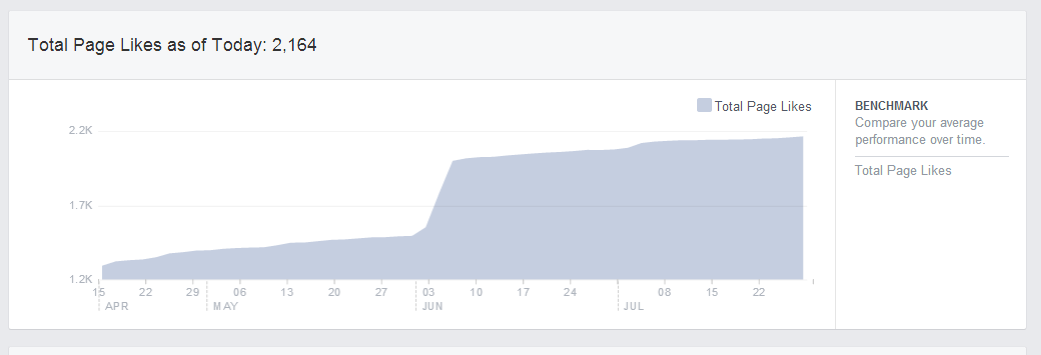
As we all might remember, for less than $200 USD and a subscription to Pagemodo which allowed me to create campaign tabs, I was able to turn Edgeryders page likes on Facebook from the hundreds into the thousands, with the help Noemi and Vahagn who assisted with localizing content.
I would like to caution against Facebook likes. Facebook’s new monetization strategy is designed to keep these likers away from your content until you pay them over and over again. For this reason it is important to learn how to reach these likers through other means. This is where Pagemodo comes in. With Pagemodo you can create FB ads that brings in new traffic, and then you can get them to enter an email address through a form. Thanks to Noemi and Vahagn we were able to create no more than 10 solid contacts in Armenia. I am not sure what happened to them or if any great, transformative outcomes arose from these new people coming into the fold. Perhaps some of them were awarded travel stipends to meet Edgeryders in person at the conference. Either way I see an opportunity for us to refine the campaigns we create on Pagemodo tabs to increase the conversion rate on these form submissions which provide us with an email address. Facebook’s excellent ad targeting technology means that we could continue to use it as a targeting tool in combination with Pagemodo.
Because I have a lot of experience doing this successfully, it is my recommendation that we try more campaigns of this type in the near future in a kind of setup where a couple of people work on perfecting the program and design and content, and I bring in the high quality traffic at a scale which is both exciting and cost effective.