Hacking health in Bordeaux, Episode 1: a first peek at the semantic social graph

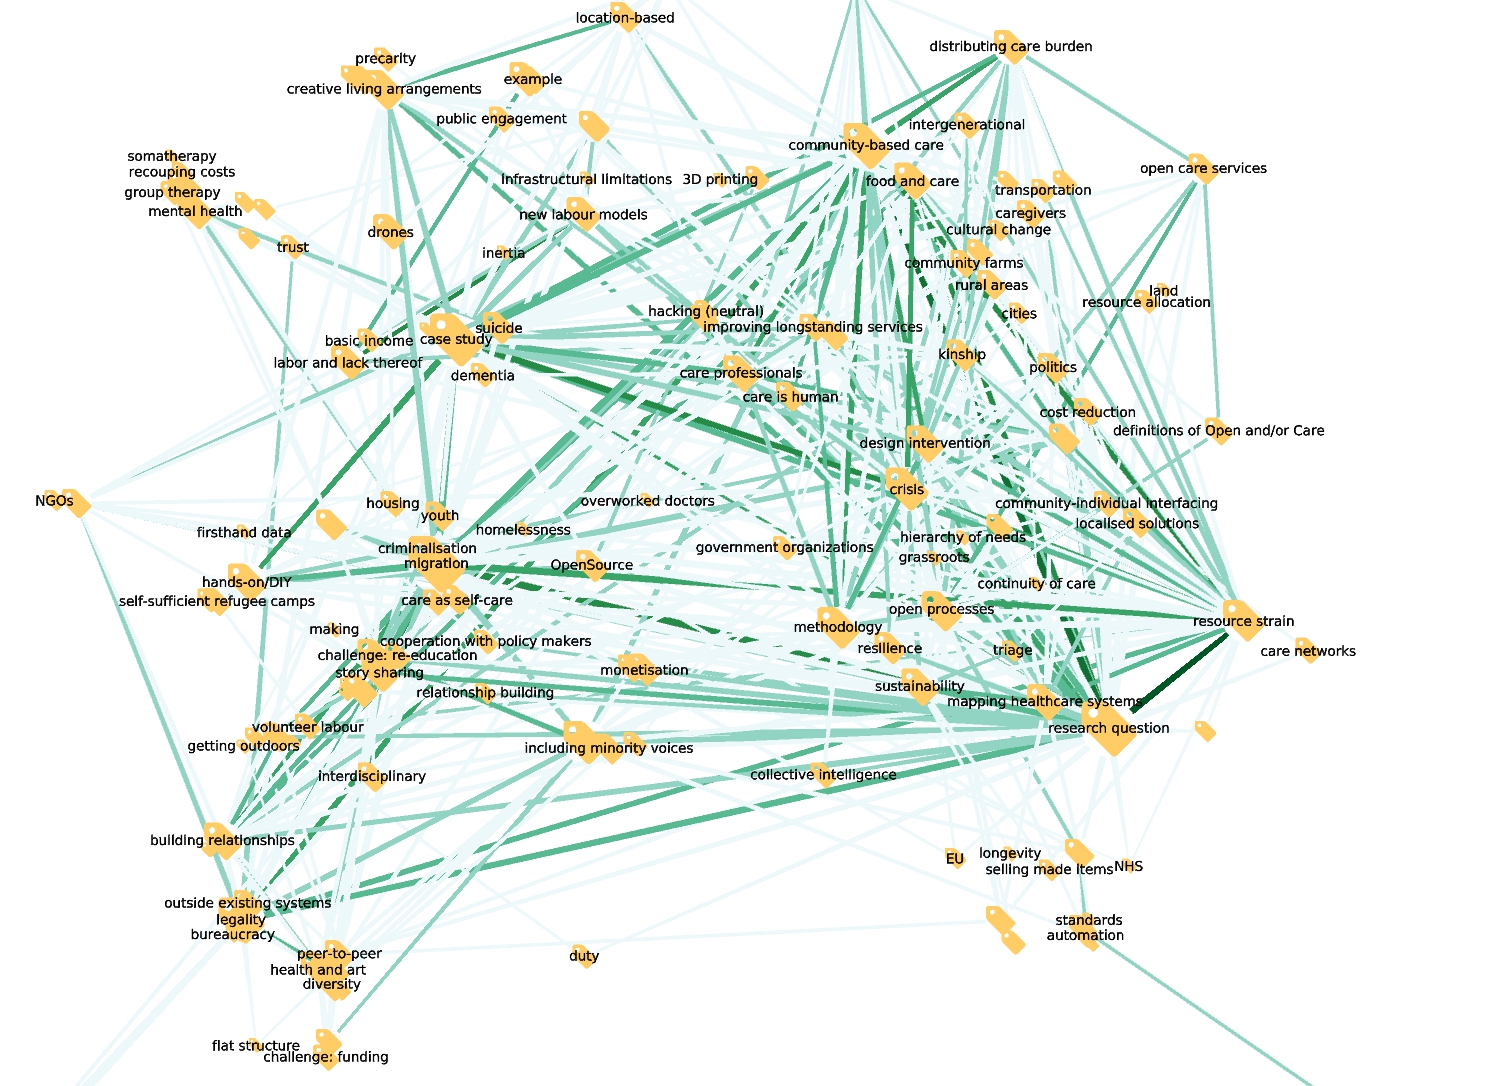
The mighty @melancon , @Jason_Vallet and I are at Hacking Health Bordeaux, working away with a fantastic team of generous hackers. Yesterday we re-exported the data, including @Amelia 's annotations (careful! only a very partial coding so far), and Guy built a rough visualization of the whole people-to-content-to-codes network:

Zooming in, you see:

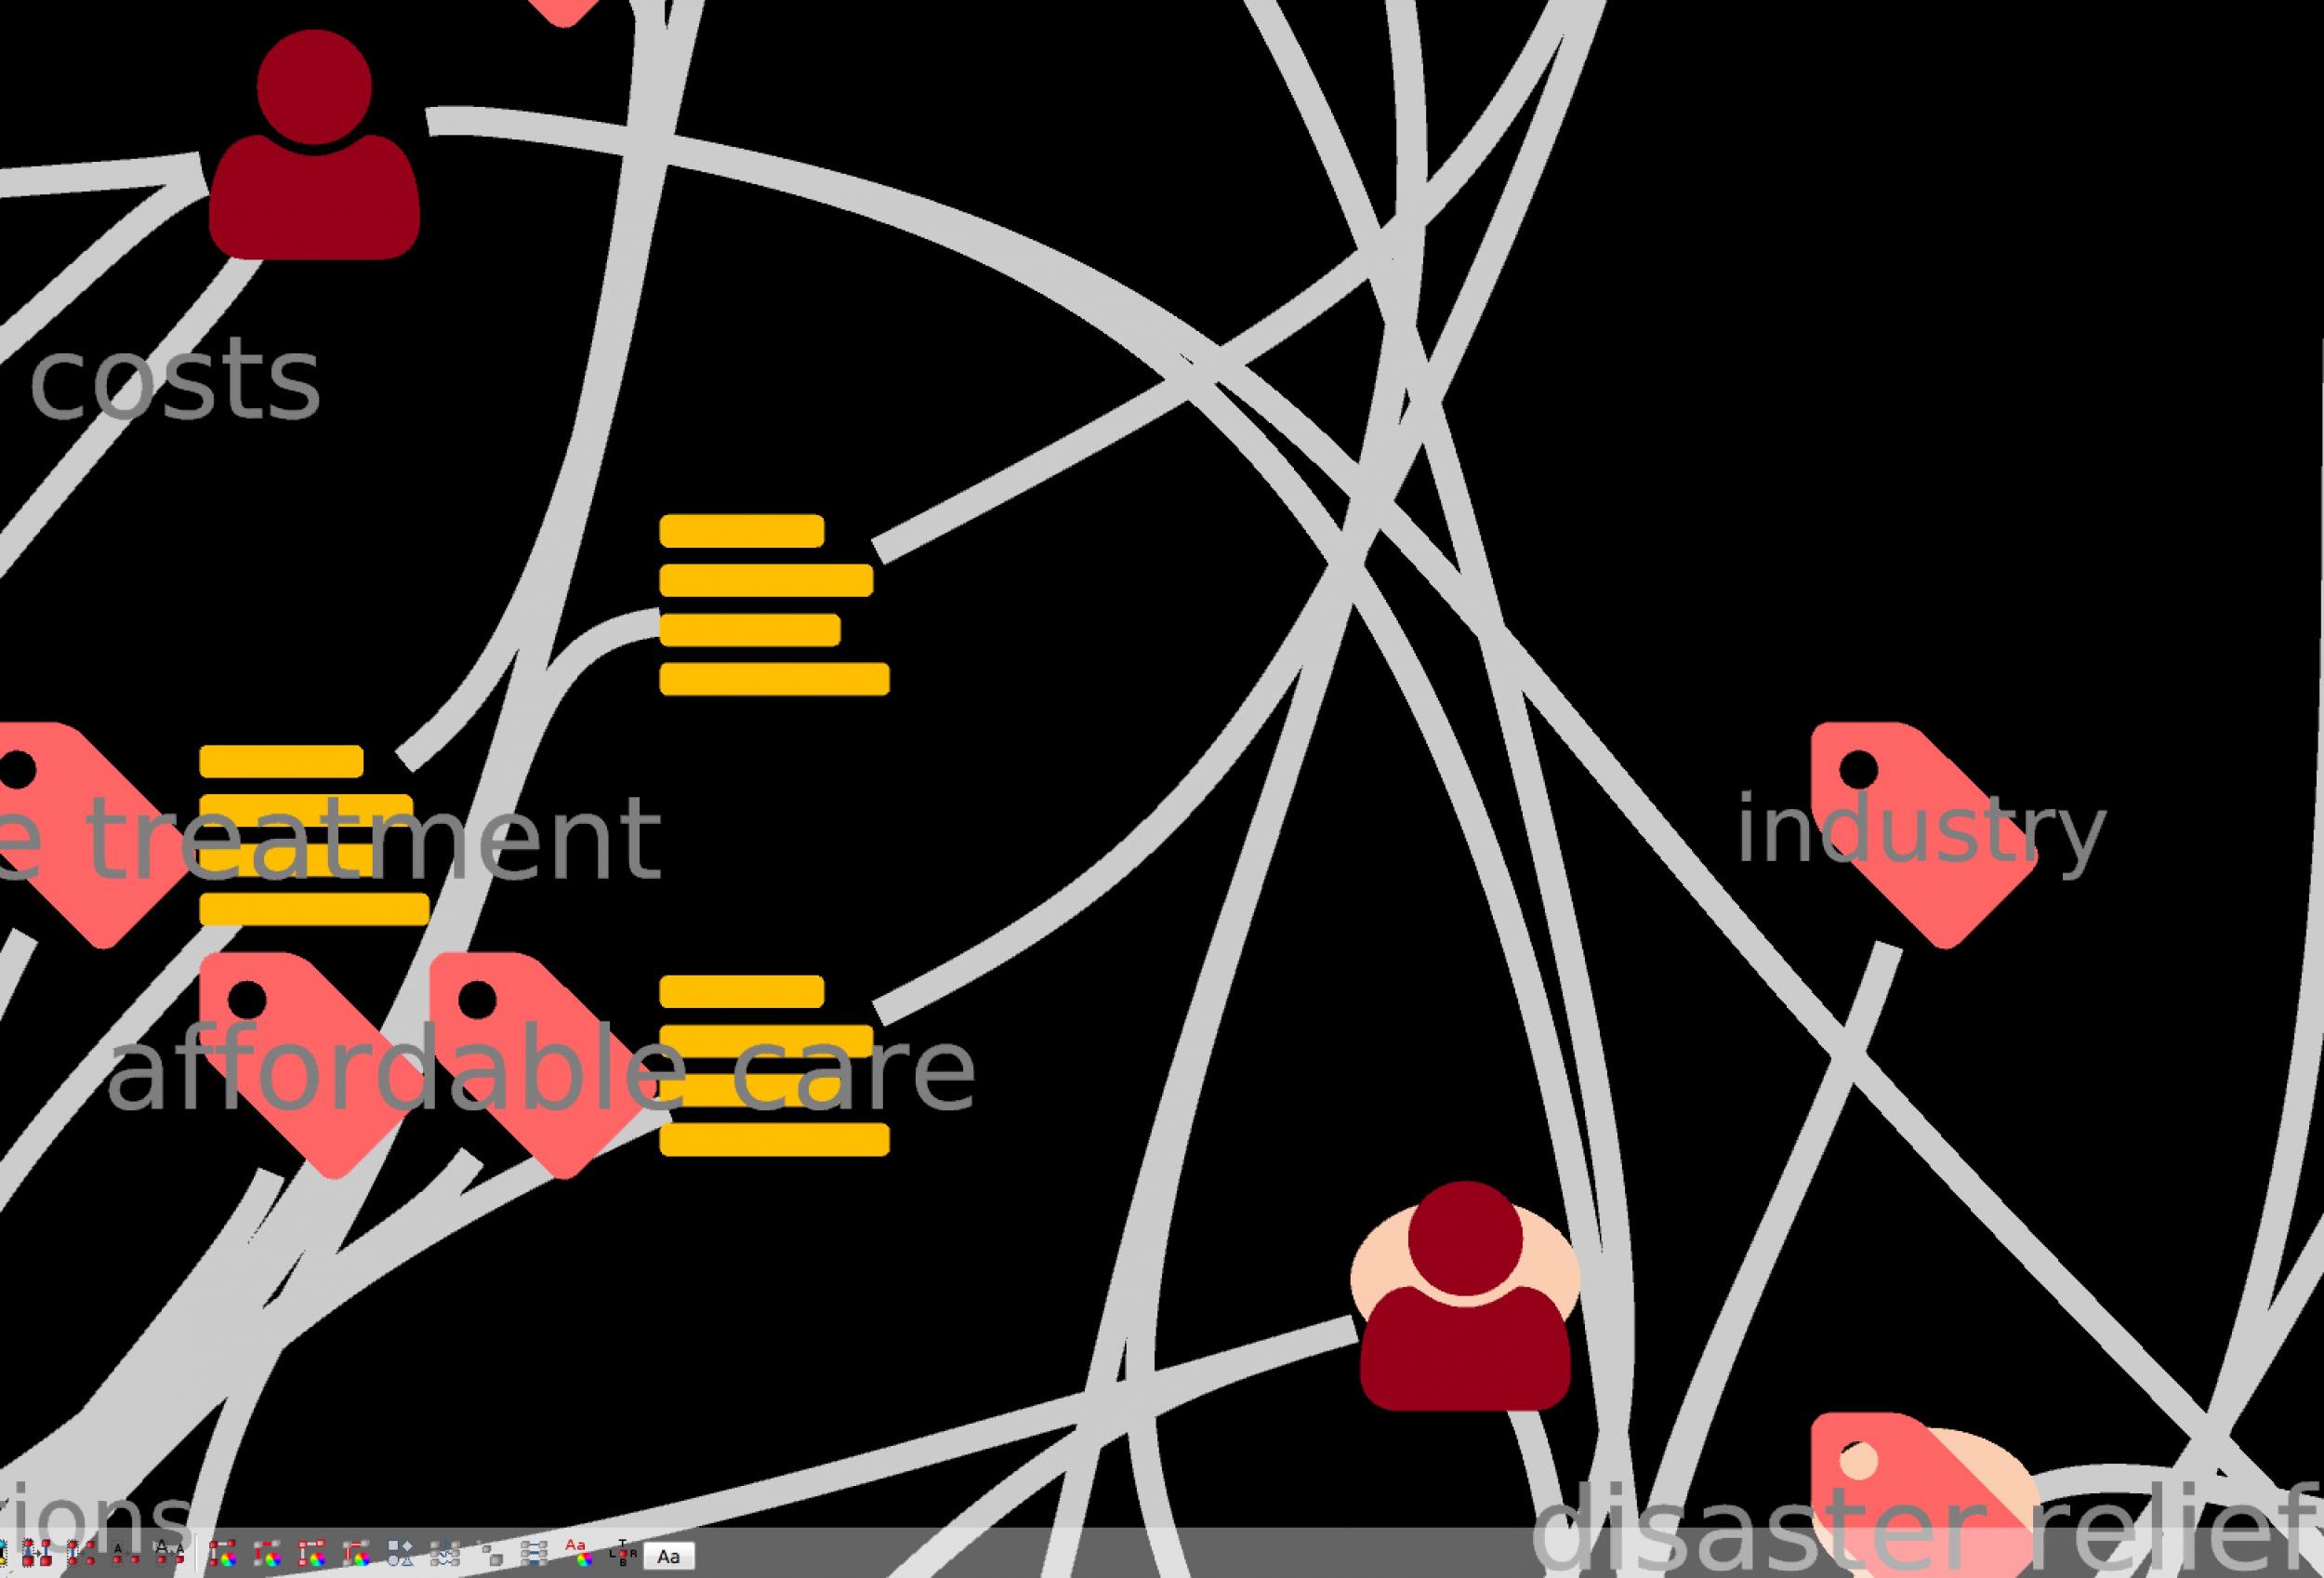
Beautiful… but overwhelming.

So here is what happens.

  1. Jason is already quite advanced in building a navigation interface. The idea is this: you start from a graph representation, and then you follow the various links, from ethno code to people and their content. For example: start with a code you are interested in, say "refugees", and see other codes it might be connected to, for example "France". Click on the edge between "refugees" and "France" to find content that is coded with both codes, like @Alex_Levene 's beautiful posts on The Jungle. 
  2. The problem we are facing is how to filter this mass of information so that the (human) analyst is not sidetracked into relatively unimportant things (unless she wants to be). So we have to come up at filtering techniques. 
  3. We decided the right place to start is the code-to-code graph. But that is also overwhelming: even this early in the study, Amelia identified 460 tags, connected by 5,116 co-occurrence edges. And back to the question above: how to filter it?

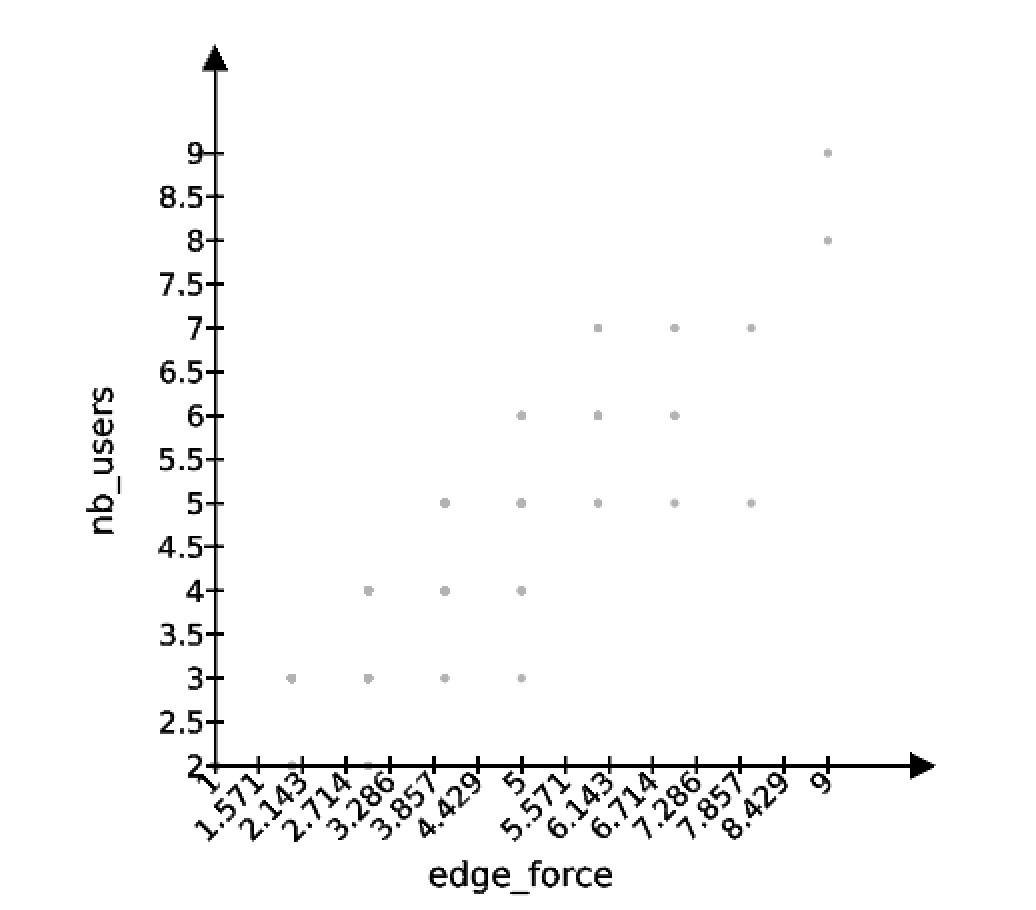
Below you can see our first shot. The scatterplot shows co-occurrences of ethno codes. On the x-axis, we have the number of co-occurrences (edge force); on the y-axis, we have the number of different users who authored contributions that host that co-occurrence.

Example. Suppose the co-occurrence of  “refugees” and “France” has x = 5 and y = 3. This means that in opencare there are 5 posts or comments, authored by 3 different users, that have both the “refugees” and the “France” tags.

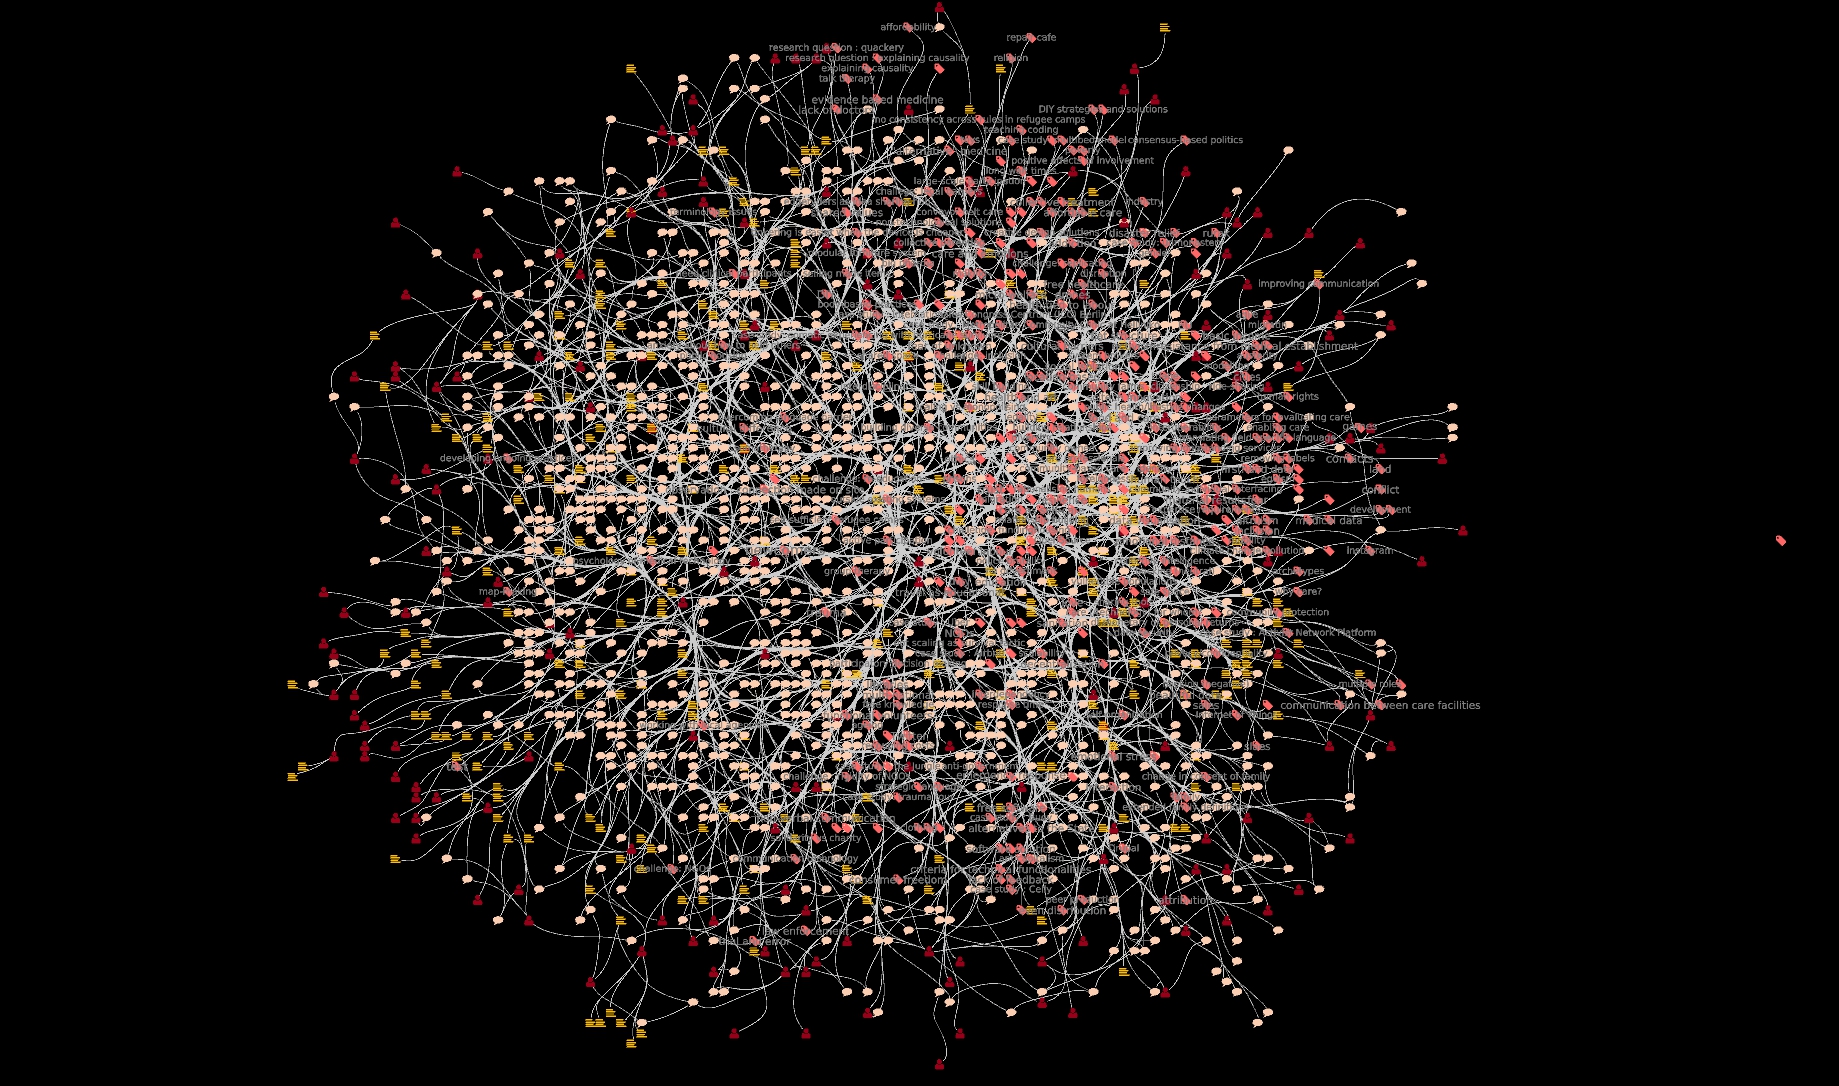
We used the scatterplot to reduce the code-code graph, selecting only the codes that co-occur at least twice, by at least two different users. This is now much more readable: 180 codes, with 678 edges. We plotted it below:

At this point, you can start to explore the graph. It’s quite a beautiful experience. I see it as exploring someone’s association pattern, except “someone” is not an individual, but the whole opencare community.  It’s, well collective intelligence!

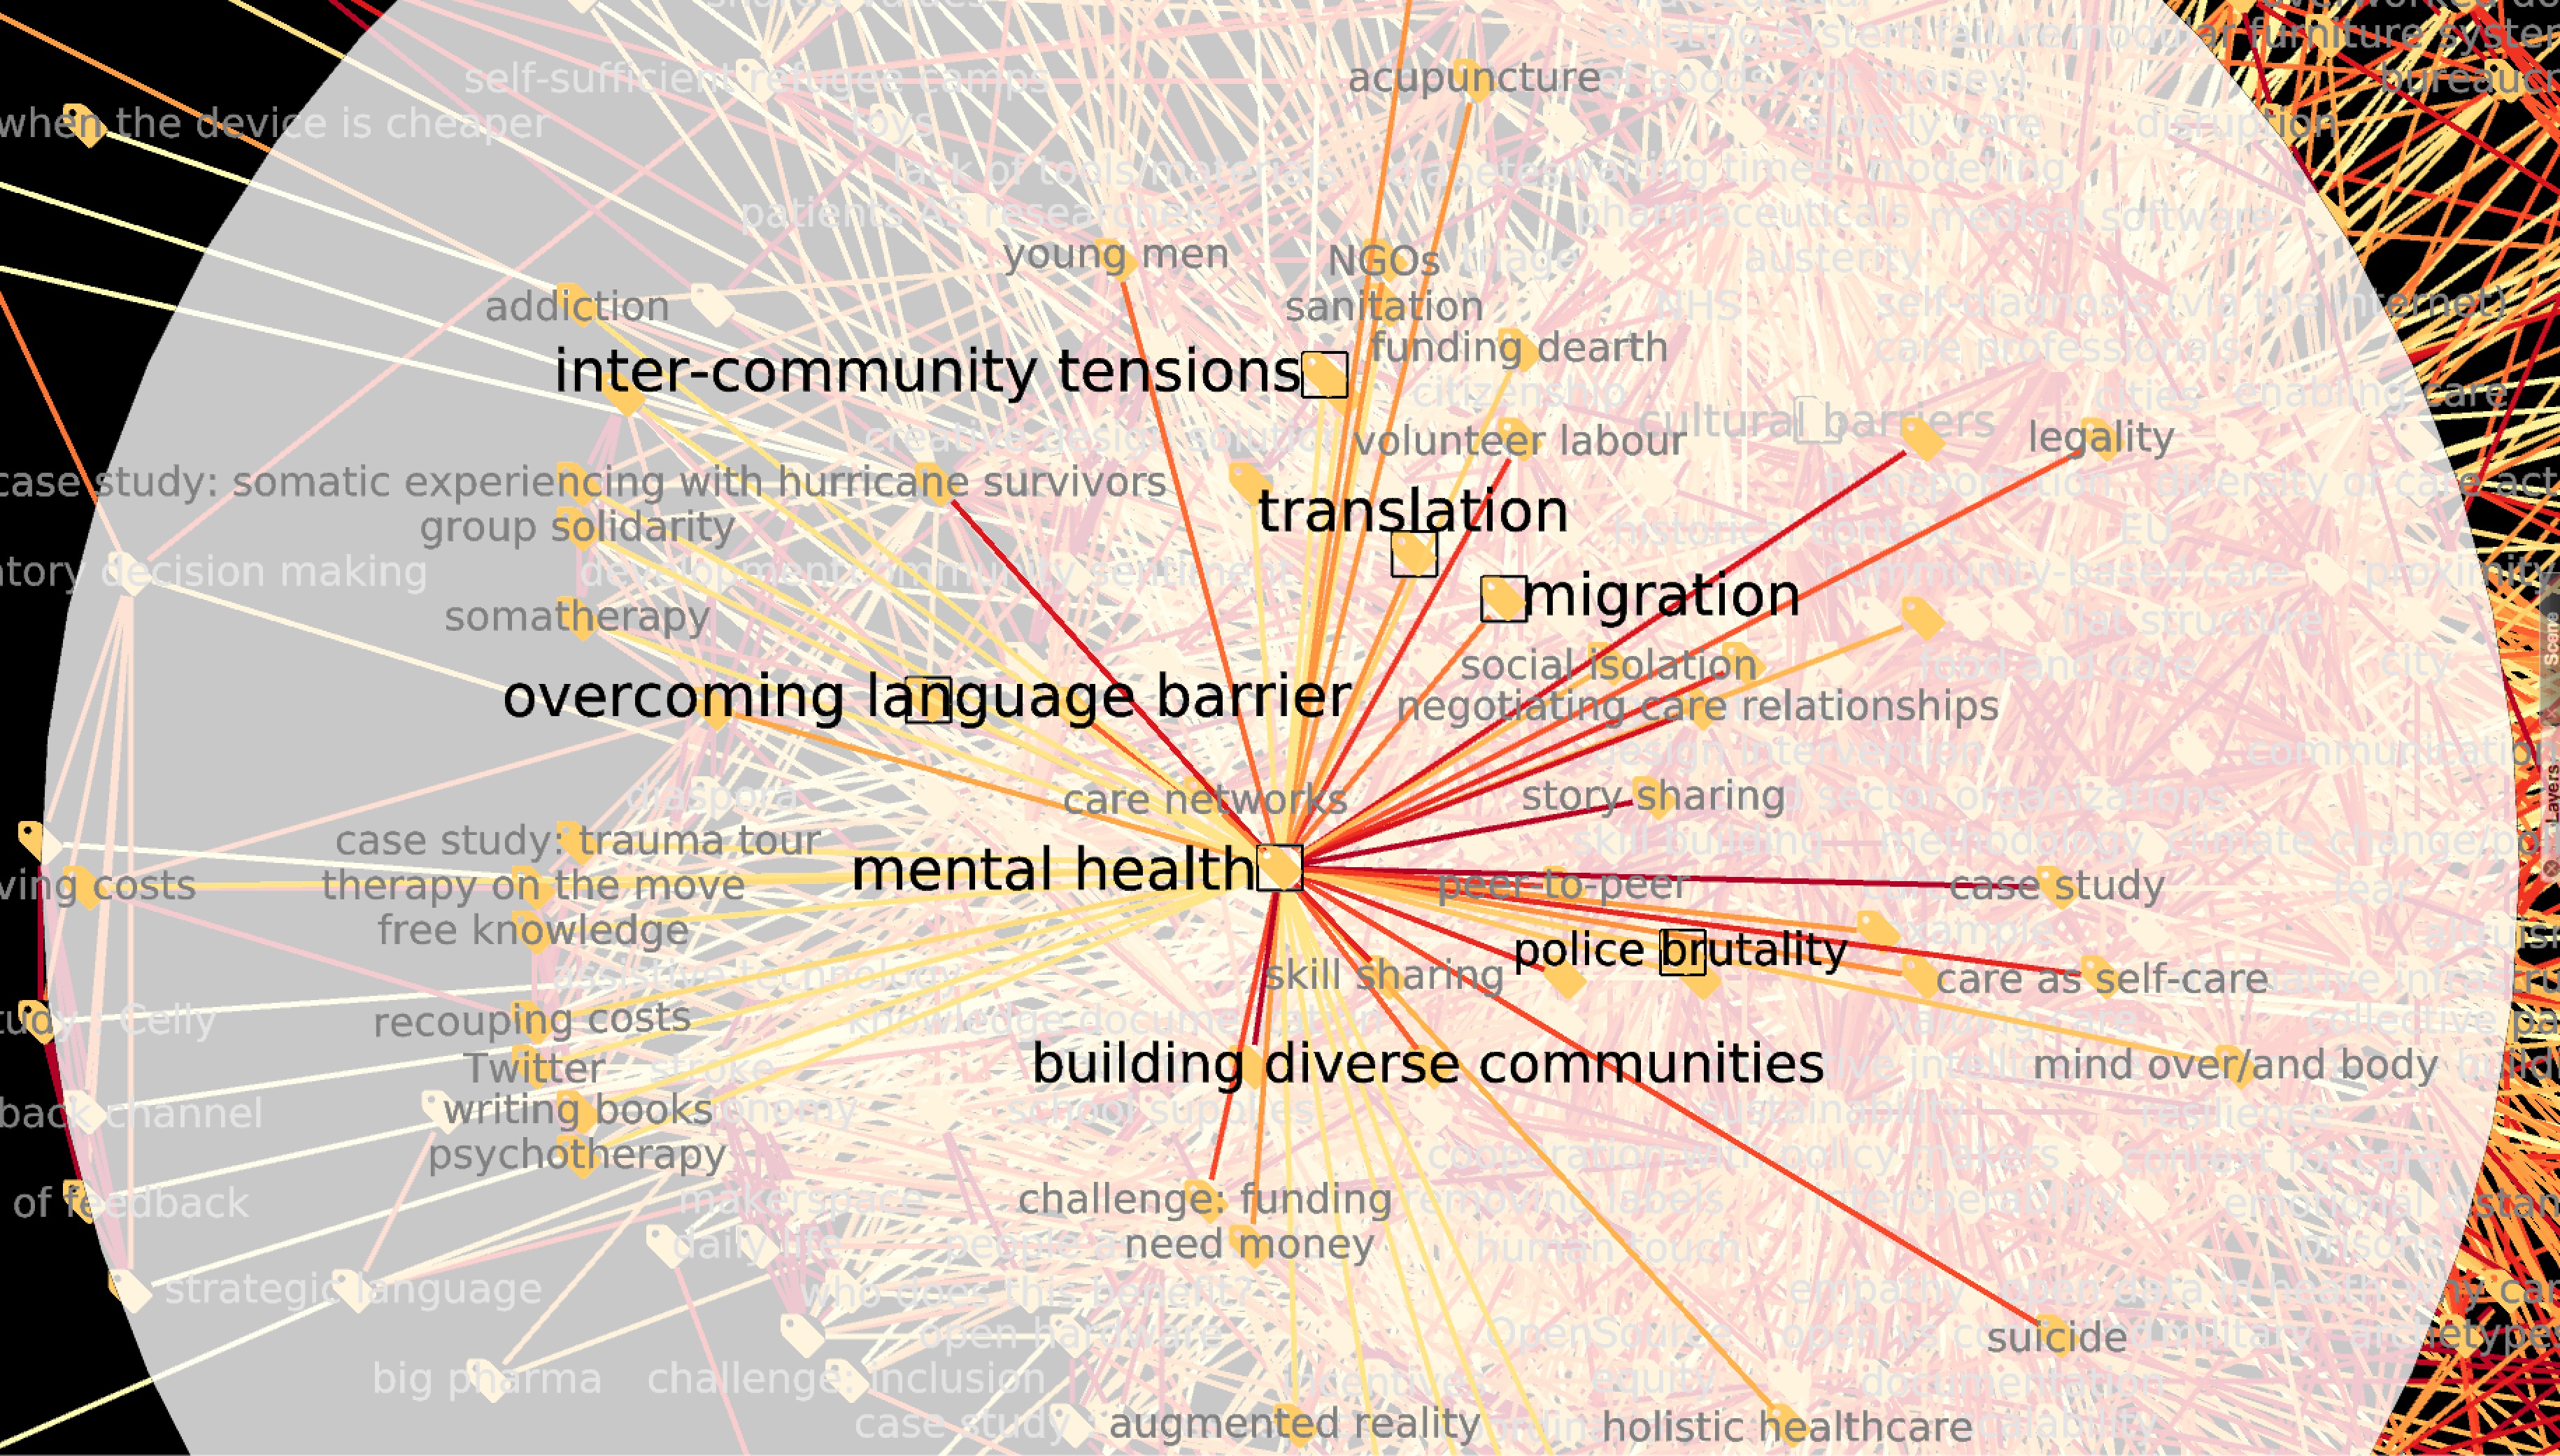
For example, look at the codes co-occurring with “mental health”:

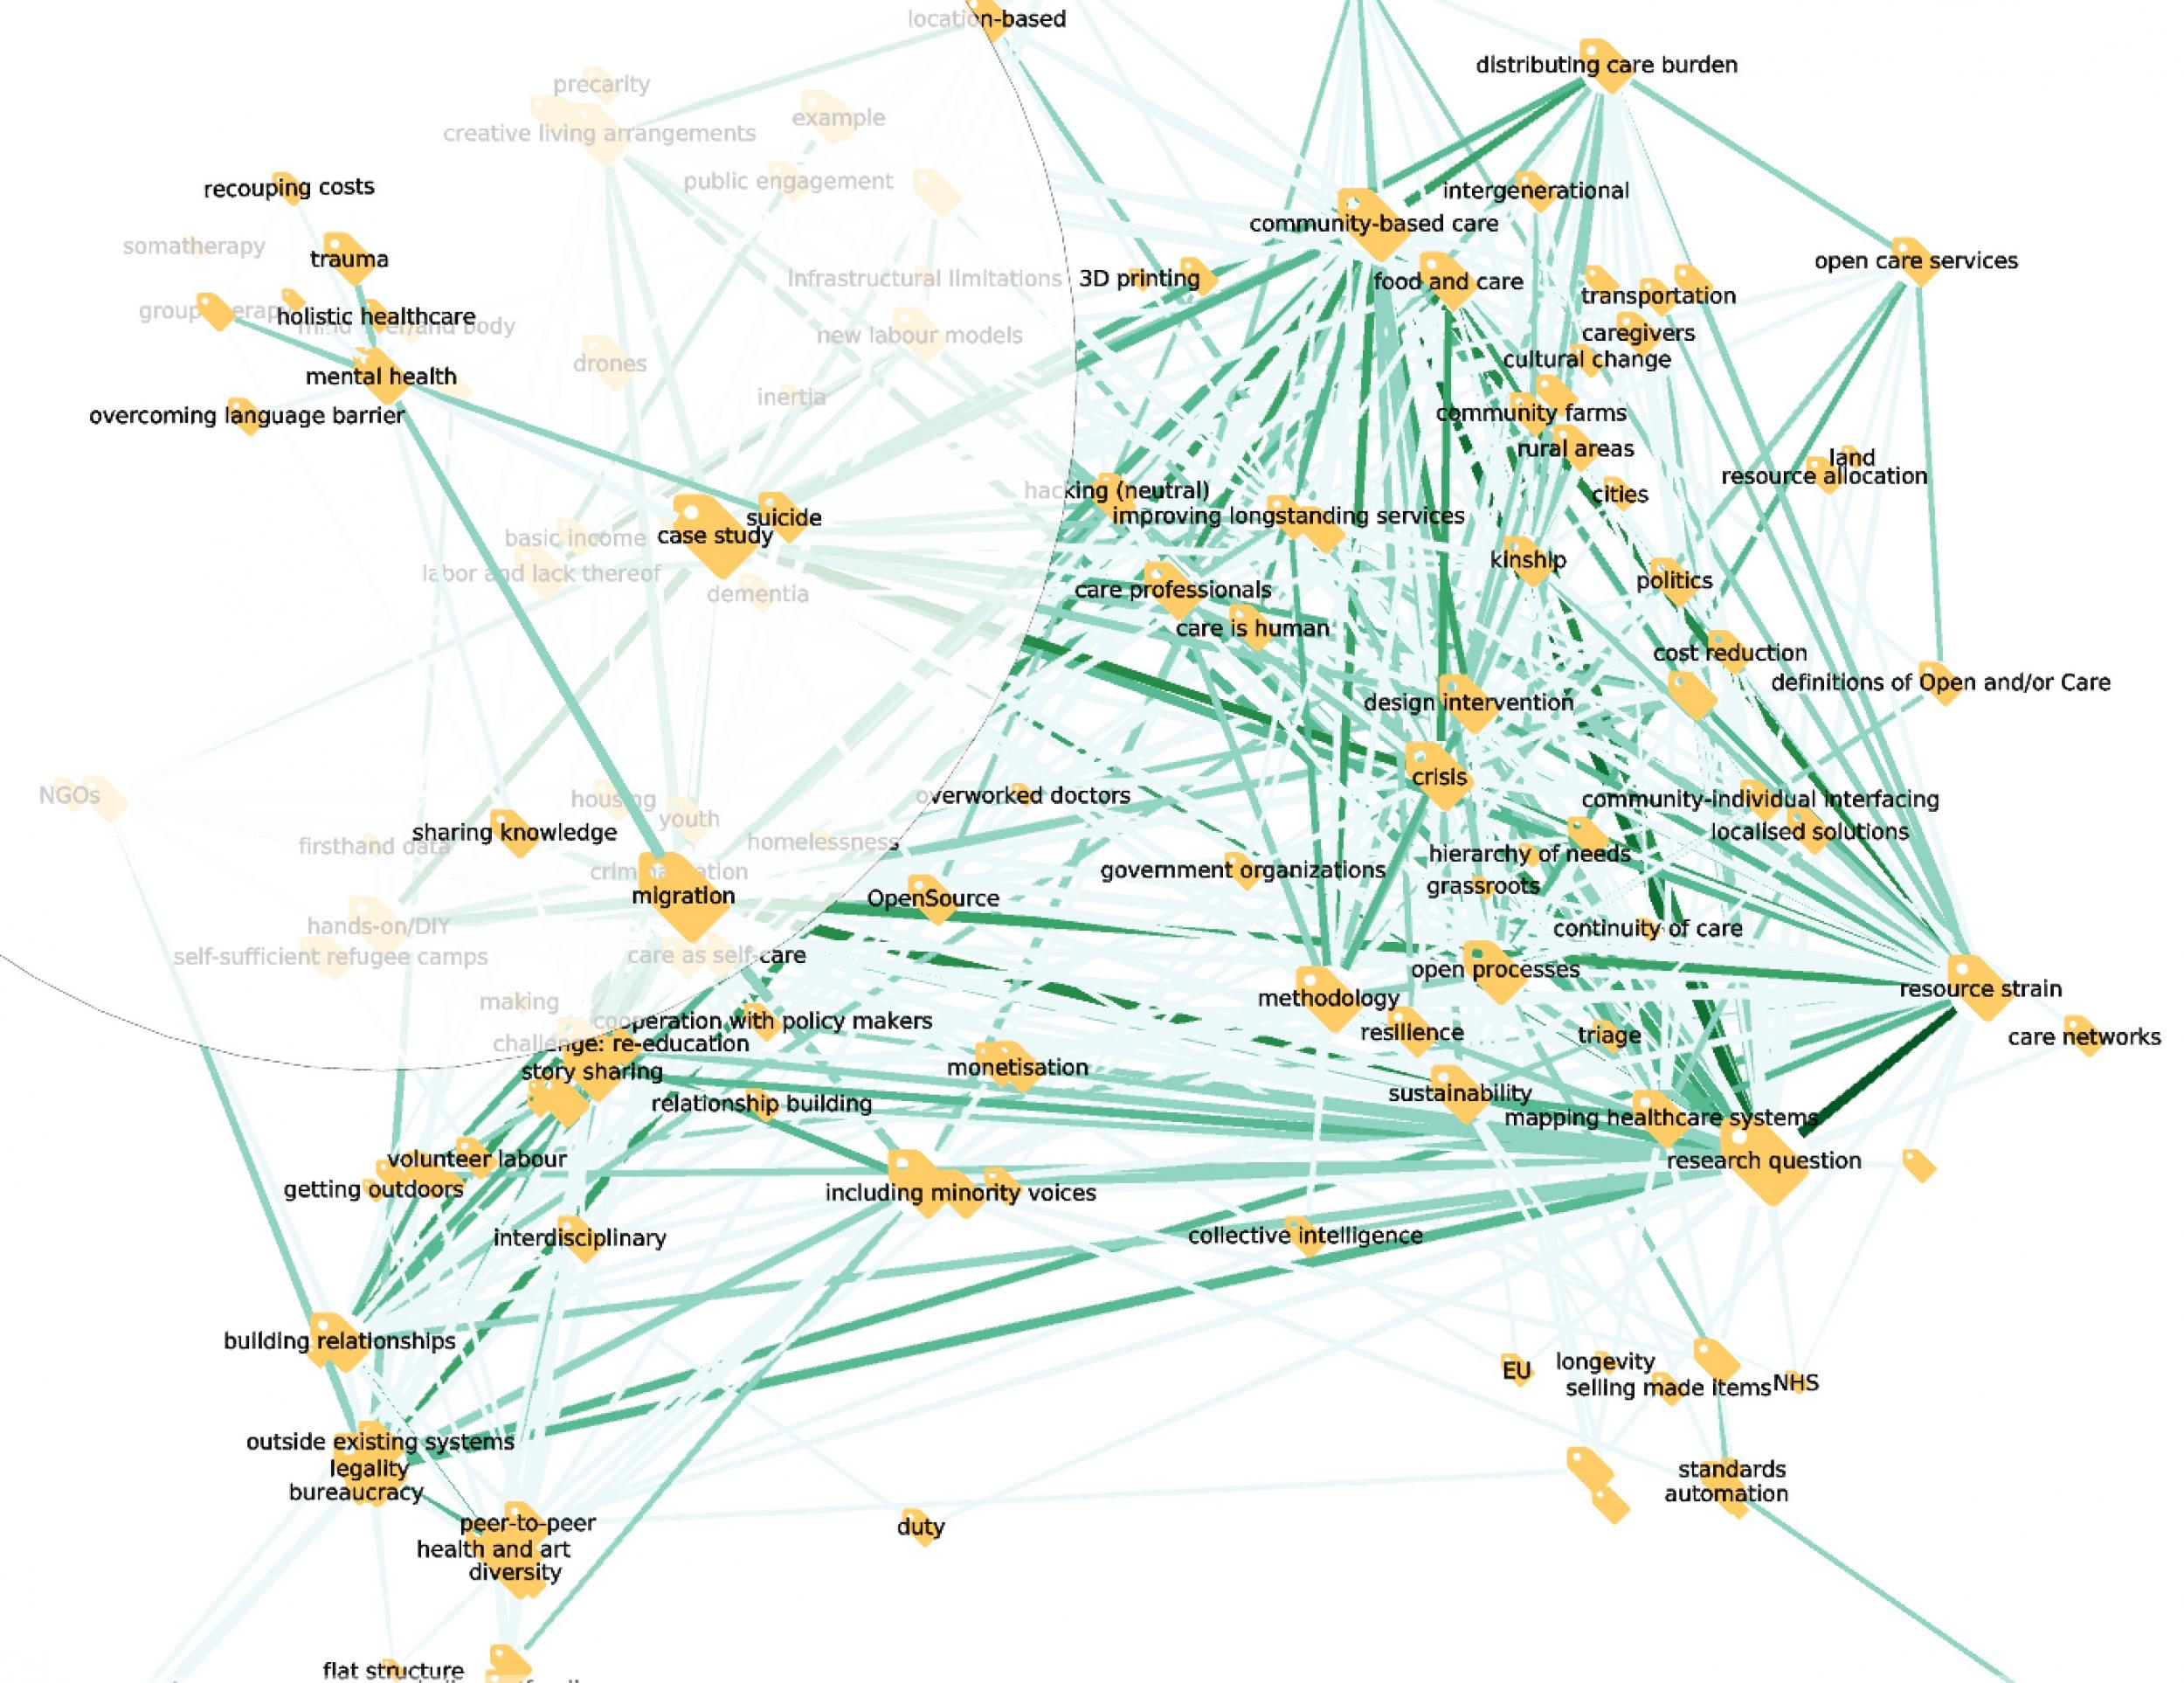
The community is saying there is a strong connection between migration, trauma and mental health. It is tempting to interpret this as an indication of priority: other things are surely important (eating disorders, for example), but these connections, and not others, are top of mind.

Another example: youth.

Very clear: you see the problems (housing, resource strain, discrimination) and the strategies deployed to face them (creative living arrangements, migration, skill sharing).

We can go much further. In fact, we already are. We can now induce the social network

So, I think we have a very, very promising research methodology on our hand. But we also have questions for Amelia. There are codes we do not understand, like “research-question” and “case-study”. They would make sense as meta-codes, categories of codes, but they are not, they are directly associated to snippets of texts. I guess doing open notebook ethnography, with people like me asking questions even while you still are coding, is more difficult! :slight_smile:

3 Likes

Research questions

This is very exciting!

Research question is a special kind of code— I am hoping at the end of this I can aggregate all the research questions members of the community have raised and suggest areas of collaborative/collective future research emerging directly from the project. This tag is linked specifically to the text, so if one clicked on it one would get a list of all the interesting questions people have posed thus far.

case study is indeed a meta-code and I shall make the structure reflect this.

It is fascinating to be able to see the connections you are making with such a preliminary and partial coding! Imagine what it will look like later on— promising indeed.    The open book ethnography is a cool experience so far from my perspective :slight_smile:

More from me soon!

2 Likes

Kind of a hack :slight_smile:

Aha. This explains research-question. You have found a hack :slight_smile:

Ok, we’ll drop it from the graph representation. You need to tell us more about the process of generating research questions from the responses.

I also find very valuable to inventory the questions being asked by the community members.

It feels like we are moving into methodology territory. The code we write, the way you code text, and the way we do community management are all intertwined. It would be fun to write a speculative paper, outlining a vision for ethnographic research in the age of collective intelligence.

2 Likes

Could use same concept to work on the paper

There are quite a few places throughout edgeryders where we talk about methodology ---- I like the idea of writing a speculative paper, and I could bring those together by grabbing them and tagging them “ethnographic methodology” or something along those lines. Then when we feel we have time/are ready to get writing, we’ll have our thoughts up to this point collected to ruminate on as we write.

I could even imagine an ethnographer using the tool like this on a more abstract-level pass, like if they are trying to aggregate information for a specific report or paper (along the lines of the one @Noemi is trying to put together on acupuncture). So perhaps Noemi goes through, clicking existing tags/codes to find annotations on acupuncture, alternative medicine, etc. Then she highlights the specific annotations she likes and tags/codes them “for acupuncture paper” or something like that. Then when she is done, she has a list of relevant quotations, etc, ready to go for her paper writing.

1 Like

“True” and “False” codes

Not sure I understand, @Amelia .

“Methodology” would be a genuine code, would it not? Unlike “research question”. It seems to me:

  • True codes indicate the topic of conversation encoded in the content.
  • False codes indicate the role played by the content, for example "Issue", "question", "pro-issue-argument" etc. False codes are the stuff of IBIS and the literature on argument mapping: https://github.com/catalyst-fp7/documents/blob/master/201401_interoperability_presentation_MK/ibis_simplified.png

As to “for acupuncture paper”, it feels like a genuine code (indicates the topic of discussion, acupuncture), but sloppily named.

True and False codes are both totally legitimate. But we go back to open methodologies: if we are are going to make ethnography collaborative, we’ll need conventions and documentation about what constitutes a code. -)

Clarifying Terminology

Ok, I need to change my terminology (I am indeed being sloppy). As you say, I am not talking about true codes in the second example. The first is a legitimate organizing code that we could nonetheless use to write the paper.

The second (Noemi’s paper) is more along the lines of what we discussed very early on with OE (and what is discussed a bit here )---- that people could have their own individual annotations. They could have their own codes (true codes), but I am suggesting that they could also use OE to create more of a project or paper workspace.

As an example: if I am working with my own data on my own machine as an ethnographer, and I am writing an article on people’s feelings about their medical devices, I would go through my own data and pull out sections of interviews and field notes and assemble them in another document, while leaving the original documents with the interviews and the field notes intact.

But we are doing collective ethnography---- so it would be useful, within the tool, to be able to organize these pieces of information as they are relevant to a particular project in a computational way. So in the case of Noemi’s project, say she clicks on pre-existing tags like “acupuncture” and “alternative medicine” and finds some pieces of information within those tags that she wants to use for her paper. She highlights them and tags them “Noemi project.” Then she can go and see all the annotations assembled under her project, and write her paper from there. Perhaps we would need to specify a different kind of tag ---- like a “project tag” as opposed to a code or normal tag (true or false).

I could see this being done really easily using the existing infrastructure, and it would be another step in promoting open notebook science when it comes to all stages of the ethnographic process. Does that make a bit more sense?

Prettified ego network of “mental health”

… in the unreduced code-to-code graph (we have included co-occurrences found in only one author). We have higlighted the co-occurrences that suggest a link between migration and mental health issues. “Translation”, “inter-community tensions”, “building diverse communities”, even “police brutality”…

This should of course not be taken as evidence per se. But it does suggest a correlation. The researcher can then click down and go read the posts that associate “mental health” with those other tags, and get points of view of people on the ground.

1 Like

Just to clarify

In the post you say that we need a way to help filter useful connections search from unuseful searches. Does this mean that in the end the aim is to work out the tool so that complete newcomers who have not been part of the conversation can browse through it and play without going through original content?!

This would be amazing, a highly effective visual way of browsing Edgeryders!

Well done guys!

2 Likes

Only at very high level

We are building a very high level (thus very aggregate) visual summary of the conversation.

  • The code occurrence frequency distribution is a known tool, standard in RQDA and all ethno software. It simply tells you that "co-operation" was the code occurring most frequently, with 64 occurrences, "football" was number 2 with 42, and "rocket science" occurred only once. 
  • The code co-occurrence network is a map of association patterns. It tells you which pairs of codes occur together, and how "strong" is their connection. 

It is a big improvement over a word cloud, but the basic concept is the same: replace a lot of text with a few keywords.

Additionally, we use this graph as an interface towards the full text of the conversation. For example, clicking on a code you can get all the posts/comments in which this code occurs; and all the names (or ids) of the users that authored those posts/comments. Same thing for co-occurrences: clicking on an edge between two codes you get a list of posts/comments where those codes appear together, and one of their authors. You are then encouraged to read the actual content.

In our example, “mental health” co-occurs with “translation”. You might want to explore this particular connection. What’s the story here? Why are people making this particular connection? You can then quickly reach the posts and comments where the connection is made – it will be only one, or at most four or five, out of the whole corpus of documents.

Is that a bit clearer?

Of course

Clear, thanks! As I was expecting. But since clickability is what we’ll have then it will be easy to just skim through - I can imagine some edgeryders will find it useful to get the conversation as a glance, at least those thinking in ontologies. Maybe we get to test it agains the Channels page which we also made for browsing so to speak. No need for too much rigour if you’re using it as a community management and browsing tool…

Anyway, don’t let me sidetrack this thread from its original intention: looking into co-occurences will make for an interesting sense-making at the community level, which we will be able to do as soon as we’ll have a working tool for broad use…

Very cool - this looks genuinely useful!

A few interface questions come to mind:

  • could you (eventually) query the involved users in a code item (e.g. via tool tip)?

  • could one align the view normal to a user’s “axis of interest” (i.e. a perspective on the code item cluster that maximises the visibility edges connectes to a specific user, so you would likely look at a cloud with the topics most on the mind of the user in the center area)?

Thanks @alberto @amelia et al!

No idea

Over to @melancon .