Coming to EdgeRyders to work on social media I have taken a look at what kind of insights our analytics data from the past year can provide us with - in terms of where our audience is coming from and how effective our social media strategy has been in reaching new users. With this blog post we will start by establishing a general overview of our social media presence and the contribution it plays towards the development of the platform.
Measuring social engagement
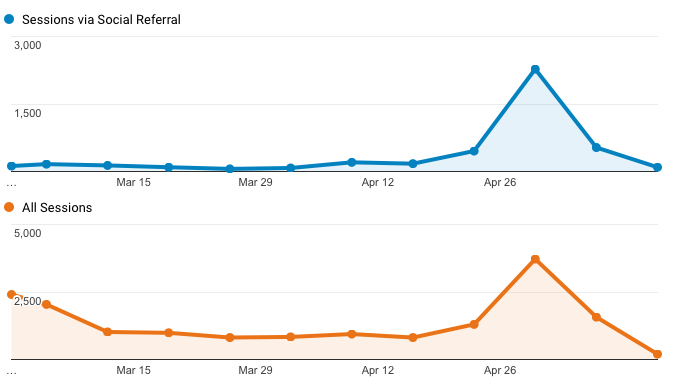
A simple place to start is to compare the number of visitors coming to edgeryders.eu via social referral to the total number of sessions on the site. Using Google Analytics we can gain a better understanding of how these metrics correspond to one another.

If we look at the past month (in this case, from March to April 2017) we can see that the two are working closely in tandem, with a spike in traffic from April 30th to May 6th driven by a greater number of social media referrals (2276 visitors, or 61% of total traffic) than usual.
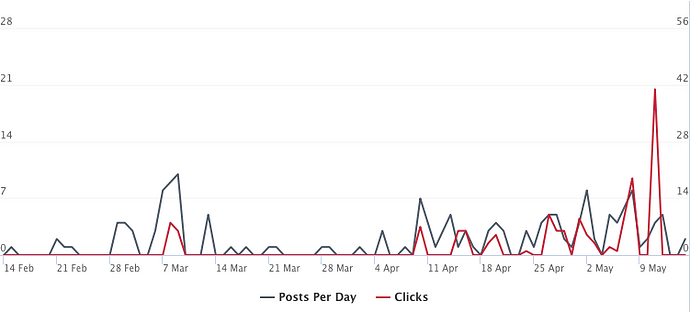
Buffer, our main social sharing service, offers further insight into how the frequency of our posts contributes to overall engagement with the site.
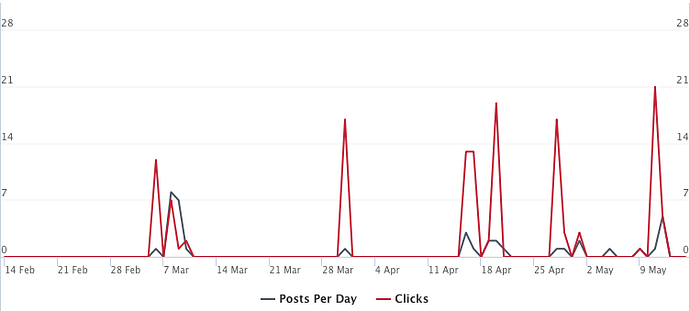
Looking at a 90 day period this time, there is a direct correlation between sharing frequency and links clicked. This may seem obvious at first, but we do not want to run the risk of oversharing content to an absent audience - the frequency of posts plays an important role in controlling this signal to noise ratio. Twitter for example is a high frequency medium, with a near constant flow of information and discussion, so posting once a week will not draw much, if any attention. Conversely, publishing a blog post or sending out a newsletter on a weekly basis alone can provide a strong signal boost. The key is to find the optimal frequency range for each service, which I will write about in my next post.
What platforms are being used most effectively?
The Social Overview report (found under the ‘Acquisition’ tab in the sidebar) in Google Analytics provides us with information on which social networks are sending traffic to the site, and more importantly to us, what kind of traffic.
Looking at the top 5 traffic providers, Facebook leads the field and is responsible for 3067 visits in the month of April, or 80% of social referrals. While this tells us that Facebook is sending a large number of users to the site, it is just as important to understand what these users are doing once they get here. Twitter contributed far less traffic, with about 14% of all referrals, but we also see that the average time spent on the site is longer (by 3 minutes and 9 seconds) and the average number of pages visited on the site higher (3.12 to 1.6) than the average Facebook user.
While the difference may seem small, these statistics reflect the central tendency of a group of users - with half of Twitter users spending longer than 4 min 34s on the site, this is a very decent average. The reality is that visitors from Twitter will spend more time engaging with the site than those from Facebook. While a smaller audience, it is also a more targeted group of users that we should continue to invest in.
What data matters?
We’ve had a brief and very general overview of how much weight social media carries in bringing users to the Edgeryders community and a general breakdown of the services providing the most amount of traffic.
In the search for meaningful metrics we can easily lose ourselves in a statistical stew of data such as reach, conversions, leads, impressions, engagement, amplification percentiles and so forth. In my next post, we will be looking at the data that matters for Edgeryders and what this should tell us about our long term objectives for the community.
For now though, what are your thoughts on these metrics and how do they fit within our social media strategy? What audiences should we be targeting that we are not already, and how can we improve engagement with our existing users?


