Rethinking the structure of data for SSNA in network form

We are trying to reduce the brittleness in our software for SSNA (aka SenseStack). Right now, the situation is:

  • Ethno coding is done in OpenEthnographer. OE is a piece of our Discourse platform, and so pretty robust. All the ethno data are saved in the same (relational) database as Edgeryders content.
  • Graph analysis is done in GraphRyder. GraphRyder is not robust, just a prototype so far. GR does not build graphs directly from OE; it first imports data, and stores it in a Neo4J (graph) database and then builds a JSON version of this data which is stored in memory and served to GraphRyder.

This wiki is a concept map of important entities in SSNs, and of the relationships linking those entities. The idea is that, by doing this, we set the scene for improving the stack. We might also get ideas to streamline it and make it more robust.

Logic

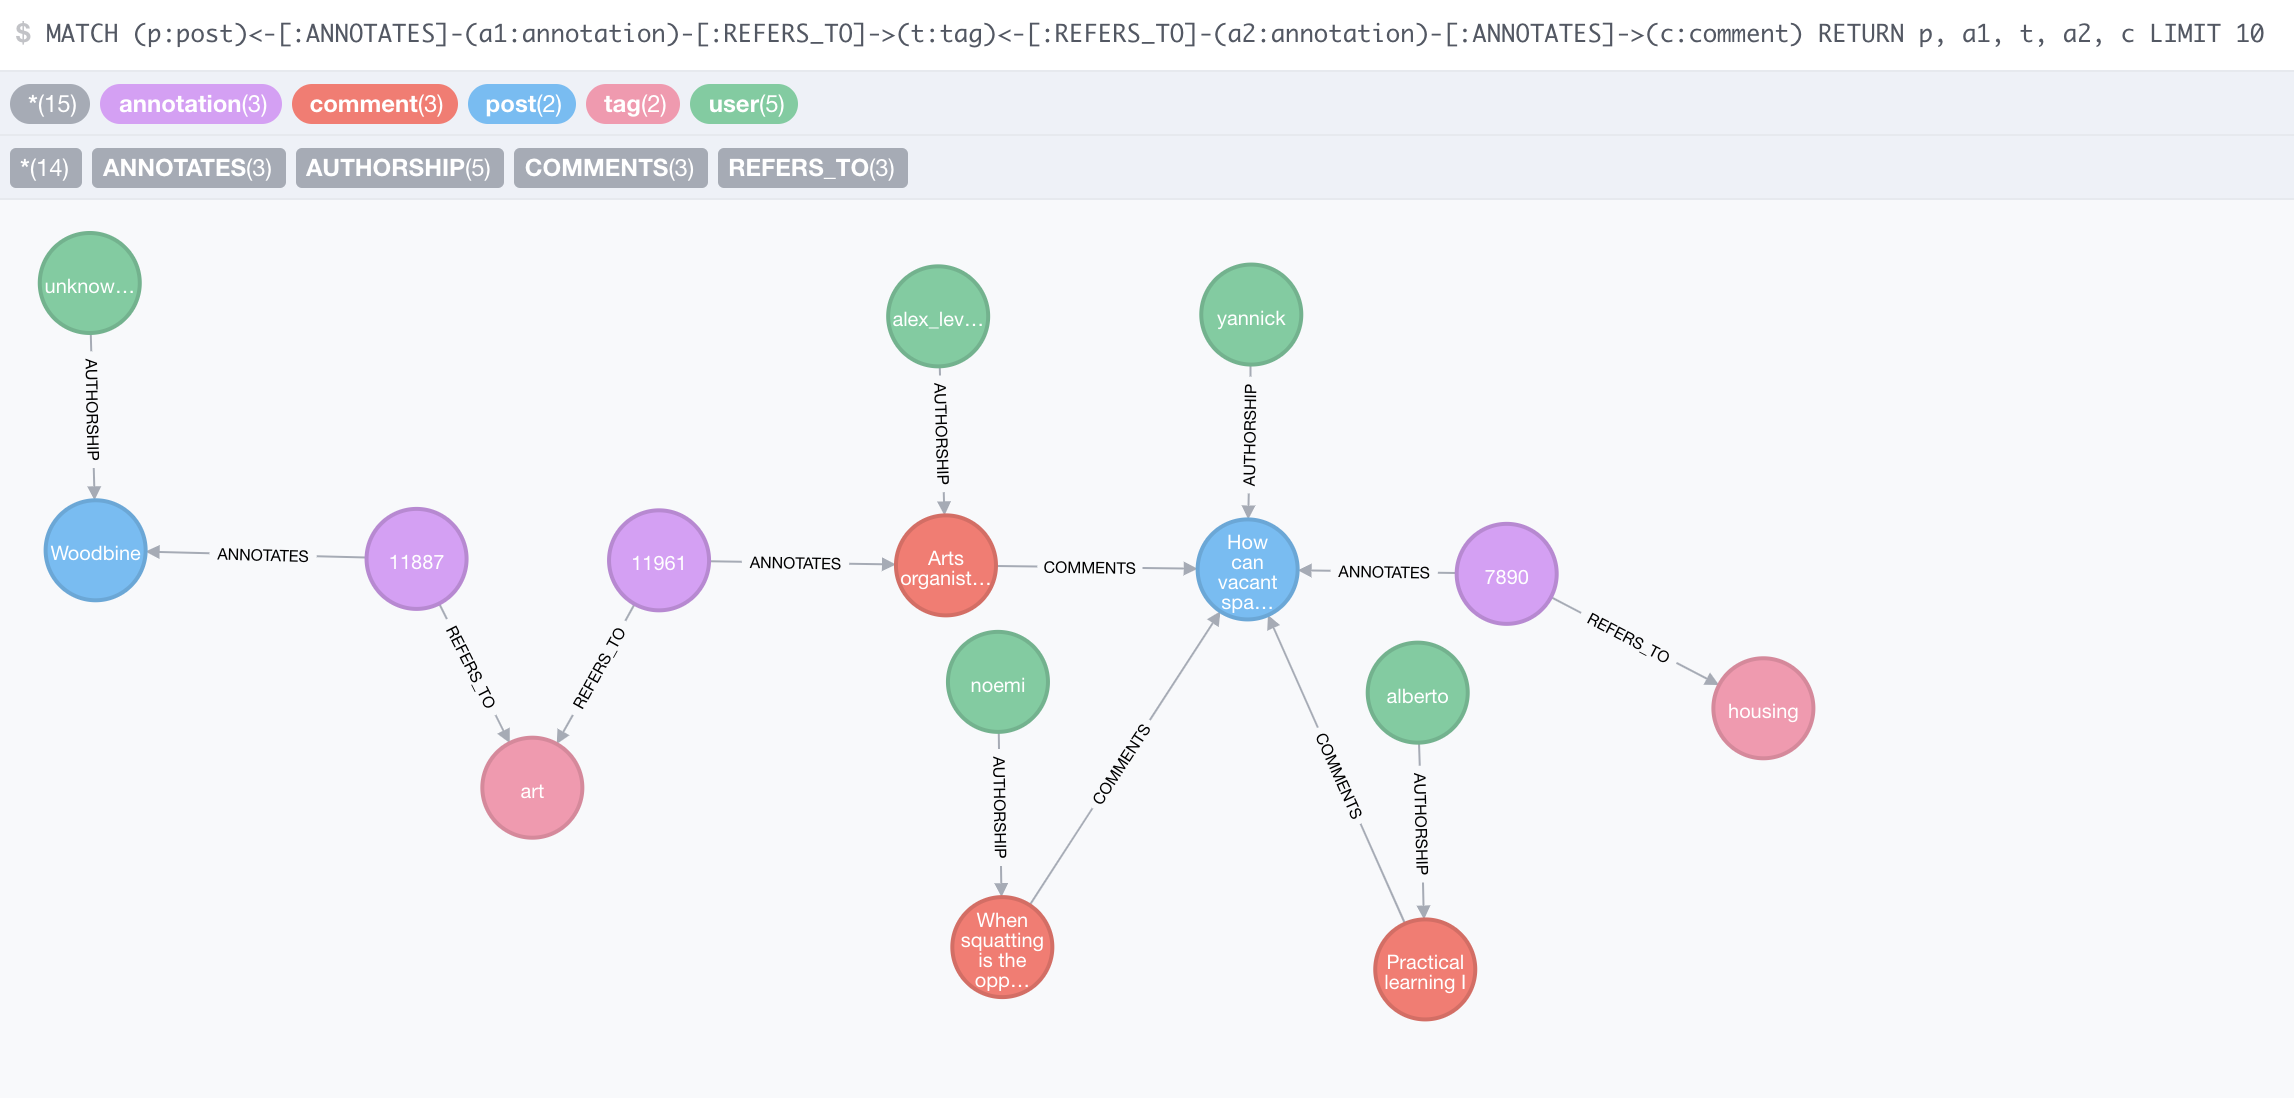
We follow the logic of the graph database. The annotated corpus is represented as a network. This network, however, is more complex than the SSN as proposed by our paper, as it includes more entites (ethnographers, collections) and more relationships.

Entities

Entities are:

  • Participants. People who participate in the conversation.
  • Contributions. Quanta of content with a unique identifier. In our case, posts on the forum.
  • Annotations. Quanta of meta-content, associating contributions to some information created by analysts.
  • Codes. Keywords used to assign semantic value to contributions.
  • Researchers. Analysts who take part in analyzing the data.
  • Projects. SSNA studies: collections of posts that make up ethnographic corpora, and of annotations thereof.

Relationships

  • participant is-author-of contribution.
  • contribution is-reply-to contribution.
  • annotation annotates contribution.
  • annotation contains code.
  • researcher is-author-of annotation.
  • researcher is-author-of code. We might even omit this, given the “wiki” nature of codes. On the other hand, different researchers and different studies might want to use the same code in different ways. This creates potential for confusion at the human level. How to solve it?
  • annotation forms-part-of project.

All relationships can also be followed backwards: for example “contribution is-authored-by participant”.

Combining these relationships one gets all other relationships, including the mathematically meaningful ones we use in SSNA proper. For example, one edge in the co-occurrence network in GraphRyder means “code1 co-occurs-with code2”, which resolves in:

code1 is-contained-in annotation1, that annotates contribution1, that is-annotated-by annotation2, that contains code2

when

annotation1 forms-part-of project1 AND annotation2 forms-part-of project1 .

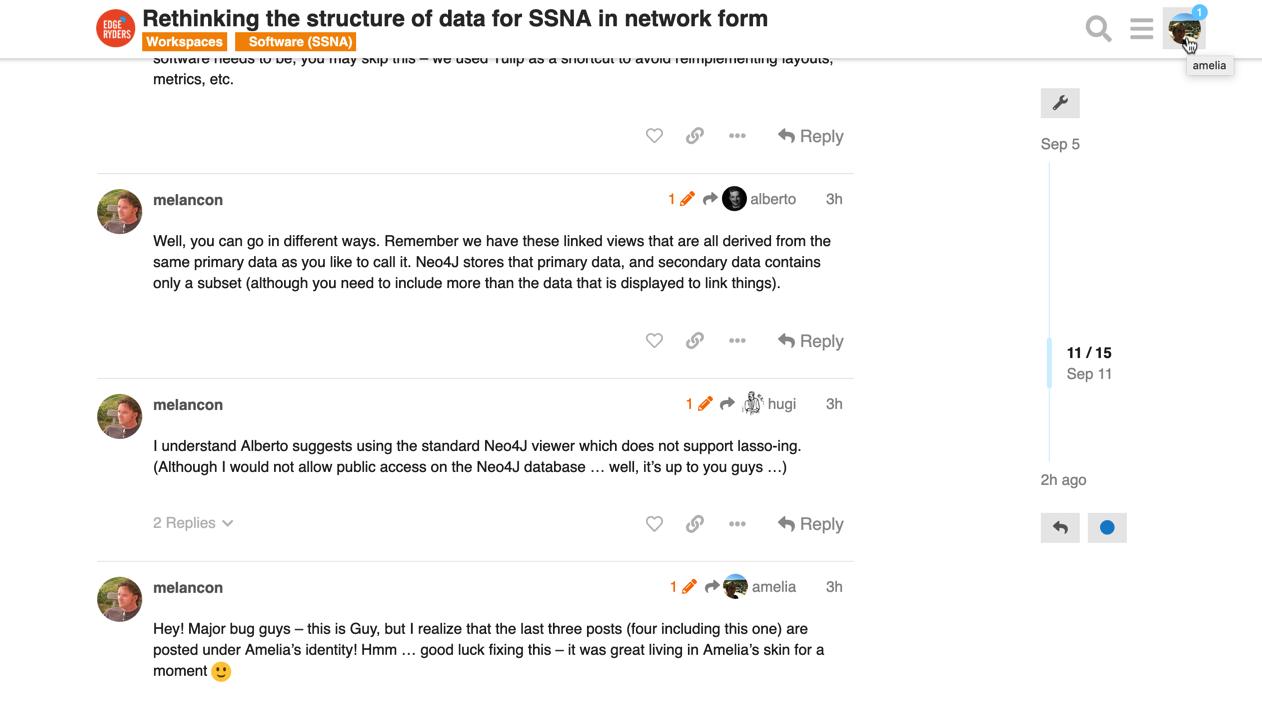
A radical approach to Graphryder functionalities would be to simply store the data in Neo4J according to this structure, then use Cypher queries to “flatten” the awkward six-mode graph into visually intuitive one-mode graphs. Neo has native layout algos, so visualization should not be a problem. There is also some limited export facilities (see).

However, if we do it that way we lose the nice lasso interactor in the Detangler view in Graphryder.

2 Likes

Once we know what we want to do with Graphryder, we can implement it in a different way.

For example, if we’d decide that we only need it for Discourse, it could become another menu item inside Open Ethnographer, and could be implemented with components that are in use anyway in the Discourse software stack (specifically, Redis with RedisGraph instead of Neo4j). And no API would be needed.

Hugi mentioned that Graphryder uses some special in-house graph libraries made by University of Bordeaux. We’d have to look into that to see if it still makes sense to re-implement it all.

1 Like

I think you are talking about Tulip. There is a Tulip server somewhere. Is that correct, @melancon ?

I was not aware of that. Why not build the JSON directly from the API? Why go through the Neo at all?

Tulip is a part of the API. When you click the buttons to regenerate the graphs in the dashboards, the API running Tulip libraries to generate JSONs describing the graphs.

I was a bit sloppy in my addition. I’ll try to explain it more clearly, including some information you already know for completeness.

Graphryder architecture

Graphryder is a dashboard, a backend API and database. Let’s call them GR-client, GR-API and GR-DB.

GR-client does all its work in the browser on your machine. It’s a static JavaScript app that runs on your end, and loads data from the GR-API which runs on the same server as GR-DB. It’s built completely in JavaScript, CSS, and HTML. It uses a whole range of libraries, which are all front-loaded when you load the client in your browser. GR-client never talks to GR-DB directly.

GR-API is built in Python and does the heavy-lifting to generate data for GR-client. In addition to Python, it has quite a lot of Cypher queries, sent to GR-DB using the python neo4j interface library. It also contains Tulip libraries, used to generate the graphs. GR-API is also responsible for building GR-DB with data from Discourse and OE in the first place. In fact, anyone can trigger a rebuild GR-DB with the latest data from Discourse and OE by simply calling the ‘hardUpdateFromEdgeRydersDiscourse’ API route from their browser.

GR-DB is a Neo4j database with data loaded into it from Discourse and OE. Here is a query result that demonstrates the data structure. I have removed some of the results from the graph for clarity.

Graphryder data

When GR-client is launched it starts by downloading a lot of data, including every single post, every user and every tag in the corpus, as well as some other data. These JSON-files are generated by processing data returned by querying GR-DB on demand every time GR-client is loaded in a browser. These JSON files are not cached on the GR-API server but freshly built every time.

In contrast to the posts, users, and tags, the JSON data containing the graphs is not front-loaded. These are instead built on-demand when the user loads a graph in the client. These are built with Tulip python libraries included in GR-API, using the available algorithms. See here for an example of how this data looks.

There are also Tulip files stored on GR-API, used to generate the JSON graphs. These are not generated on demand, but pre-built. They can be re-built with the buttons in the client settings dashboard. Clicking these buttons has no effect on GR-DB, it only triggers a rebuild of the JSON graph files using the data in GR-DB at the time.

1 Like

Not sure what you mean here. Why?

Because that way there is no GR-API anymore, “just” some canned Cypher queries. Neo produces nice visualizations in the console, as you showed me. If there is a way to pass them onto a web page running sigma.js (seems likely), then you can build graph visualization, explorable via browser, with one fewer layer of code, one fewer thing that can break. But that kind of interaction (two linked views on the database, lasso here, something shows up there) is probably not something that comes out of the box in Neo (which is, after all, a DB, not some kind of fancy app).

Much gratitude for this. Very clear. I propose to copy-paste it into here: 📗 Graphryder 1.0 Manual (Legacy)

1 Like

Ah. GR-API is what builds GR-DB in the first place. You could just run those functions as a script of-course, but then you could just as well keep the API and call the script that way, as is the case now.

It’s not recommended to have a front end client access a database directly. It can cause all kinds of problems. You would need some sort of lightweight middle layer API anyway.

A truly radical approach would be to teach the very few people who actually do SSNA how to write Cypher queries. That way they could experiment a lot more than is possible through Graphryder. It’s not very hard, could be done in a couple of webinars.

Ok, game over.

Let’s try it!

Nope, there are no Tulip server running anywhere, not really. You can build a (simple) server that answers queries and runs Tulip computations behind the scene. Depending on how sophisticated your software needs to be, you may skip this – we used Tulip as a shortcut to avoid reimplementing layouts, metrics, etc.

Well, you can go in different ways. Remember we have these linked views that are all derived from the same primary data as you like to call it. Neo4J stores that primary data, and secondary data contains only a subset (although you need to include more than the data that is displayed to link things).

I understand Alberto suggests using the standard Neo4J viewer which does not support lasso-ing. (Although I would not allow public access on the Neo4J database … well, it’s up to you guys …)

Hey! Major bug guys – this is Guy, but I realize that the last three posts (four including this one) are posted under Amelia’s identity! Hmm … good luck fixing this – it was great living in Amelia’s skin for a moment :slight_smile:

2 Likes

No, not public access. The idea was to have some bottled queries. You press a button, a script launches the query, exports the result in GraphML or whatever, then the export is passed onto something else: maybe just desktop Tulip, or maybe a Javascript dashboard. It was probably a bad idea anyway.

Ah! I see te authorship of my replies have been changed, but hey I am still connected as Amelia when I get back to the website. Have a look at the top right corner of the screenshot:
image

@matthias
This is very odd?

Yep, it is. Again, this is me as Amelia replying to myself:
image

@melancon - Occam’s razor to the rescue. Aren’t you just logged in as Amelia? I remember her borrowing your laptop at the skunkworks to show OpenEthnographer. Log out and log in as you?

1 Like

Ha, good memory. I just logged @amelia out from all devices (there’s an admin function for that). That should solve it. Only if @melancon is now able to post as Amelia again, we really have a problem …