When I last attended a ethnographers’ meeting, I heard @Jan and others wondering about the similarities and differences between the codes co-occurrence subnetworks induced by the different language fora in POPREBEL. After all, most people do not speak Polish and Czech and Serbian and English, so those fora are populated by different participants. It would not be surprising if the debates in different languages went in different directions. Do they?
I can see two approaches to this question. One is mathematical; the other is visual.
Mathematically, it’s not rocket science. You can think of the codes co-occurrence graph as a vector. Every element of the vector is an edge between two codes. If the two codes are disconnected (there is no edge), the corresponding element of the vector is 0. If they are connected by co-occurrence in k posts, the corresponding element of the vector is k. Given this, you can compute a scalar measure of distance (Euclidean, or cosine) between two vectors representing two fora, for example the Polish and the Czech. That would give you a number. To know whether this number is “high” (very dissimilar networks) or “low” (very similar networks), you can then compare the distance between the two observed vectors with the distance between either of them and a random network with the same degree distribution. If the former distance is much smaller than the latter, then you are have a proximity which is difficult to explain by random chance. This could be a sign of convergence between the two debates, but also a signature of the coding team’s work.
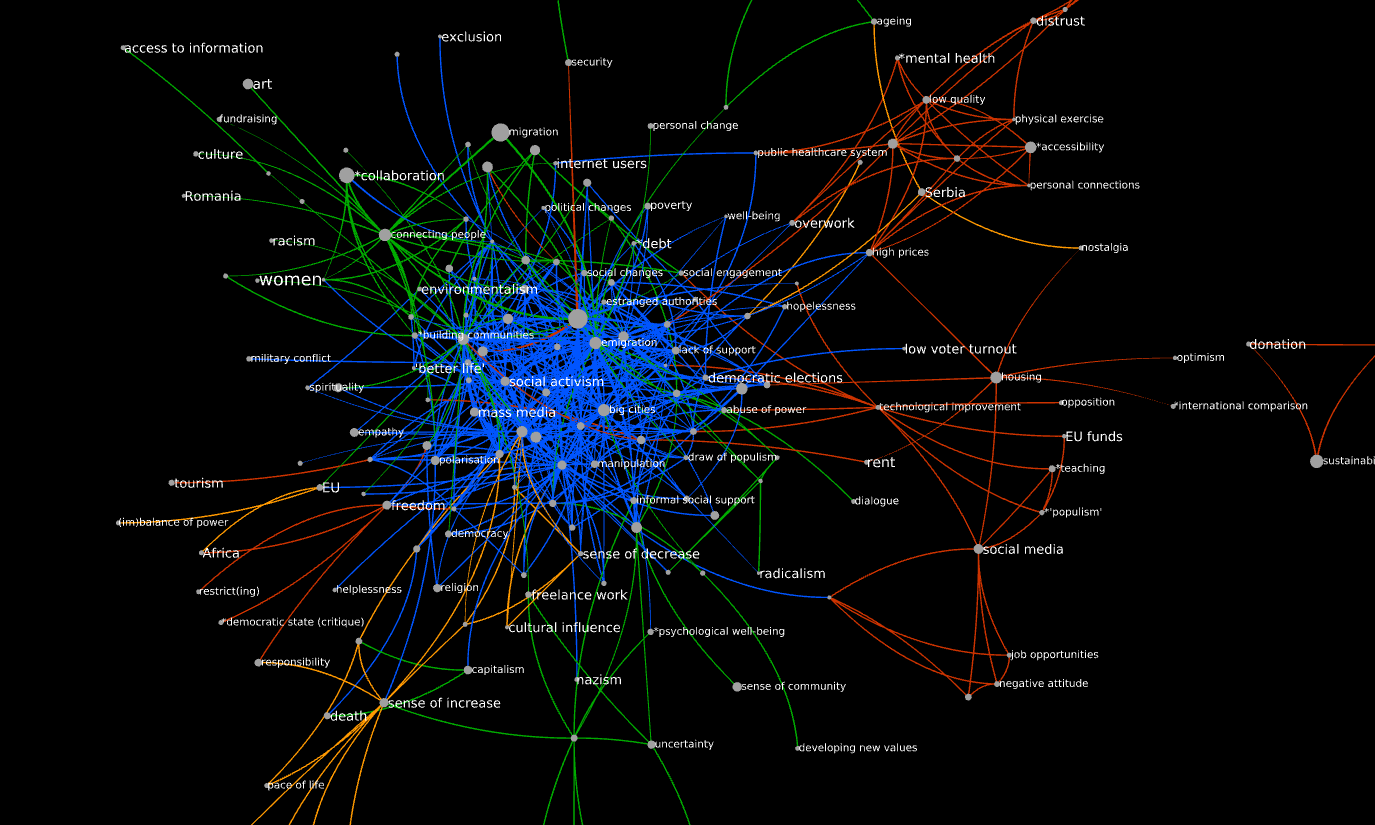
The visual approach simply draws the network. I find it potentially more generative for an anthropologist, because you can then burrow into which codes are shared across the different fora, and reflect on what this commonality might mean. Here is the POPREBEL codes co-occurrence network for k > =3. Color coding maps to the language forum, as follows:
Red => Czech
Blue => Polish
Green => International
Orange => Serbian
Grey => nodes that belong to more than one forum
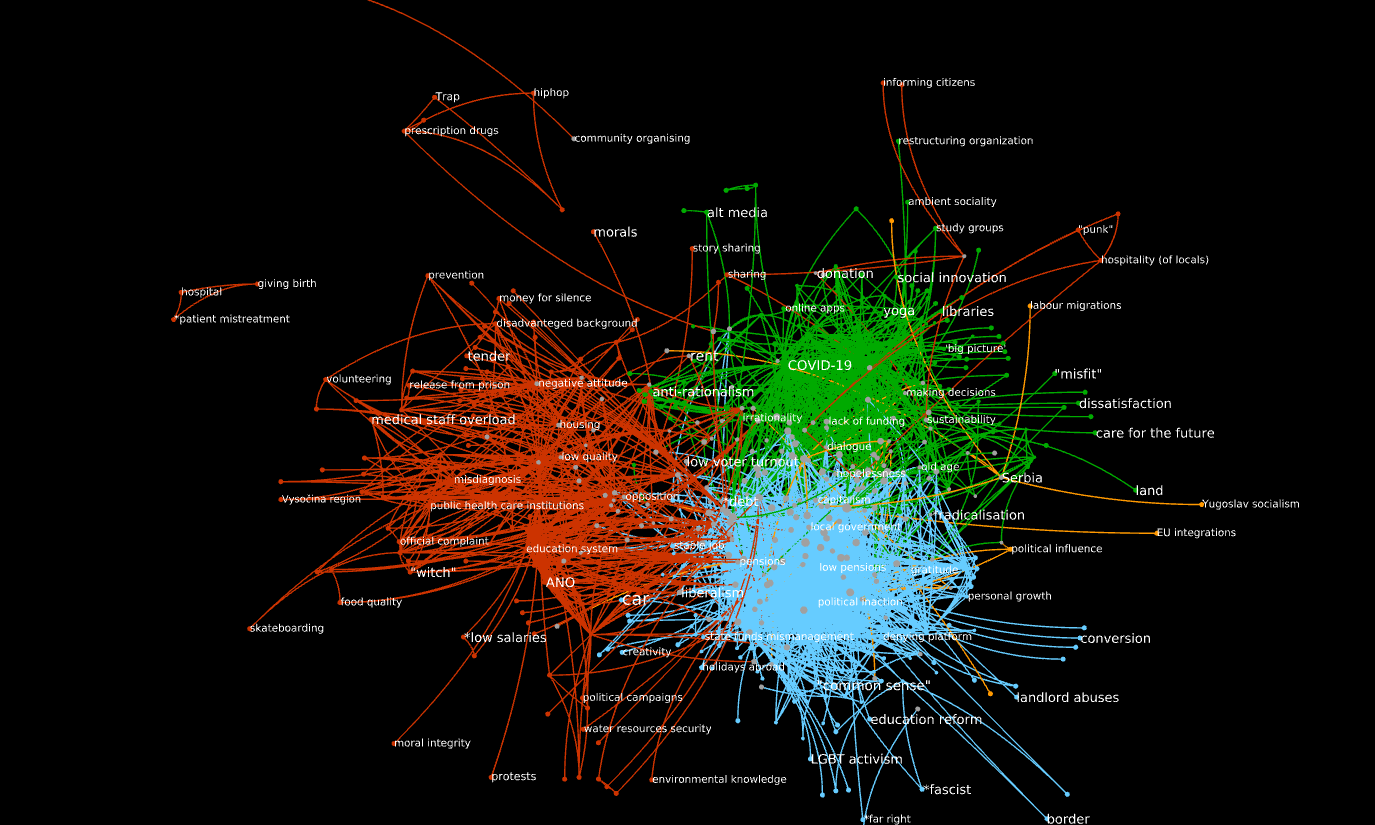
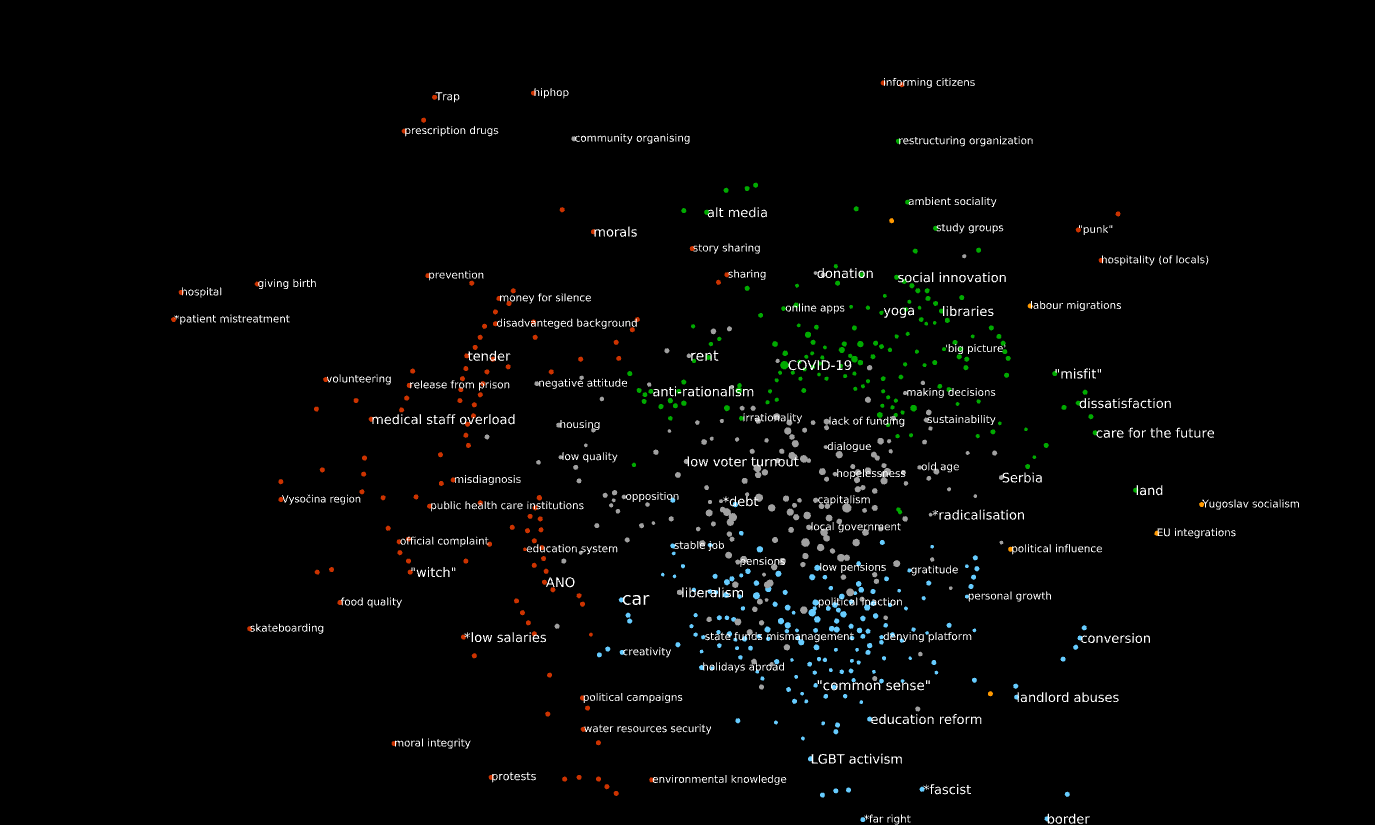
I built this version of the network representing the co-occurrences in different language fora as different edges. So, if code1 and code2 co-occur once in the Polish forum and twice in the international forum, I represent this with one blue edge with k=1 and one green edge with k=2. Graphryder would only draw a single edge, with k = 1+2 = 3. This means that there are no grey edges, though there is a fairly large group of grey nodes at the center. We can see it better by hiding the edges:
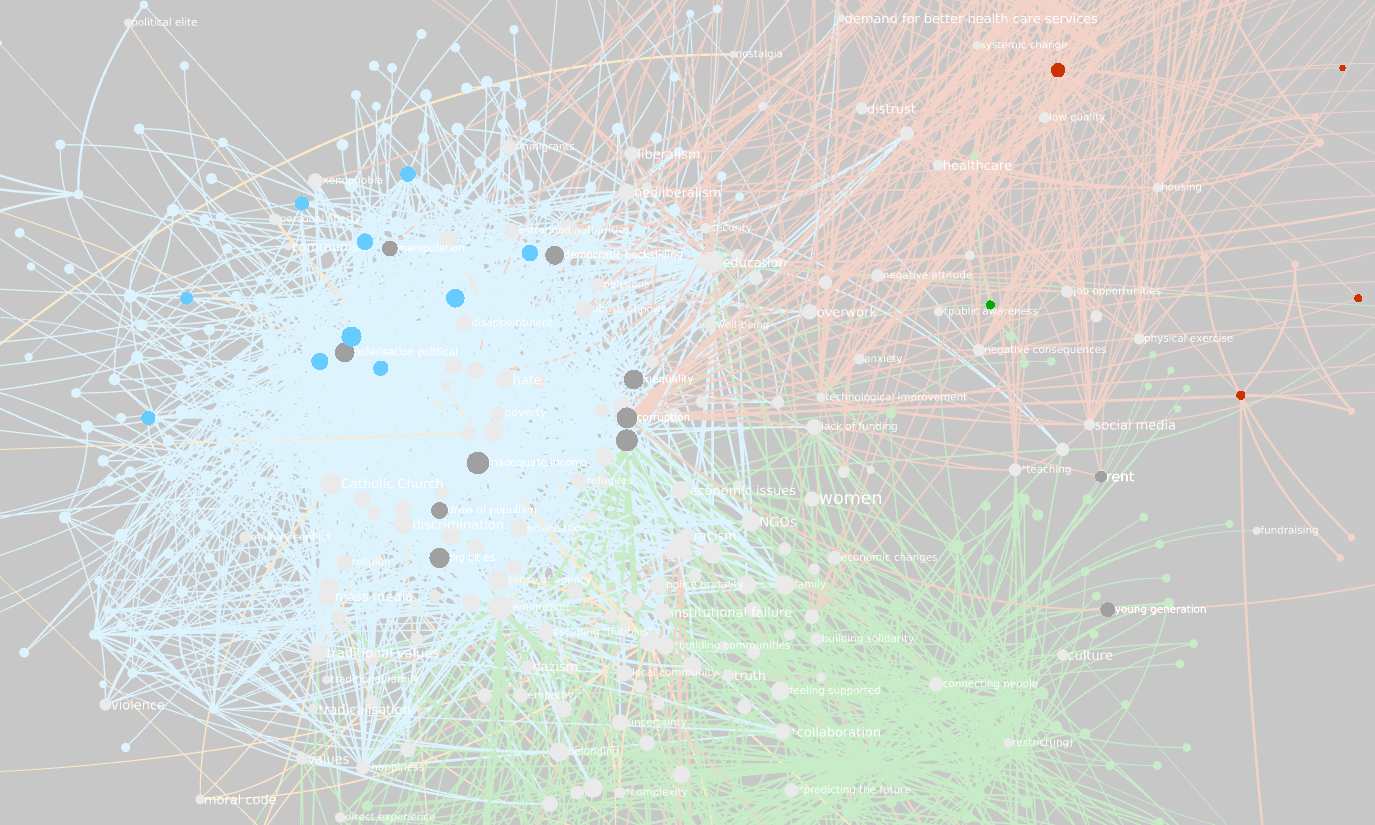
Another trick is to show the edges, but this time coloring them by interpolation of the color of the extremes. This means that, if both extremes are red, the edge will also be red; but if the edge connects a red node with a gray one, the edge will start off red and turn to gray as it approaches the grey one. Doing this shows a network of highly connected grey nodes at the center.

You can toggle these views on and off by playing with the buttons at the bottom of the node/link diagram window in Tulip.
The grey might be deceiving, because some nodes are mostly in one forum, with only few links to others. To explore this, I suggest turning off the color interpolation, zooming in if necessary, and turning on the “Highlight node neighborhood” interactor, on the top of the node-link diagram window. Hovering over nodes reveal their connections; clicking on them locks that view in place, while you can move your mouse elsewhere. This method reveals, for example, that corruption is incident to edges in the Czech, Polish and international forum; on the other hand, polarization political is incident only to Polish debate edges (at least for k>=3).
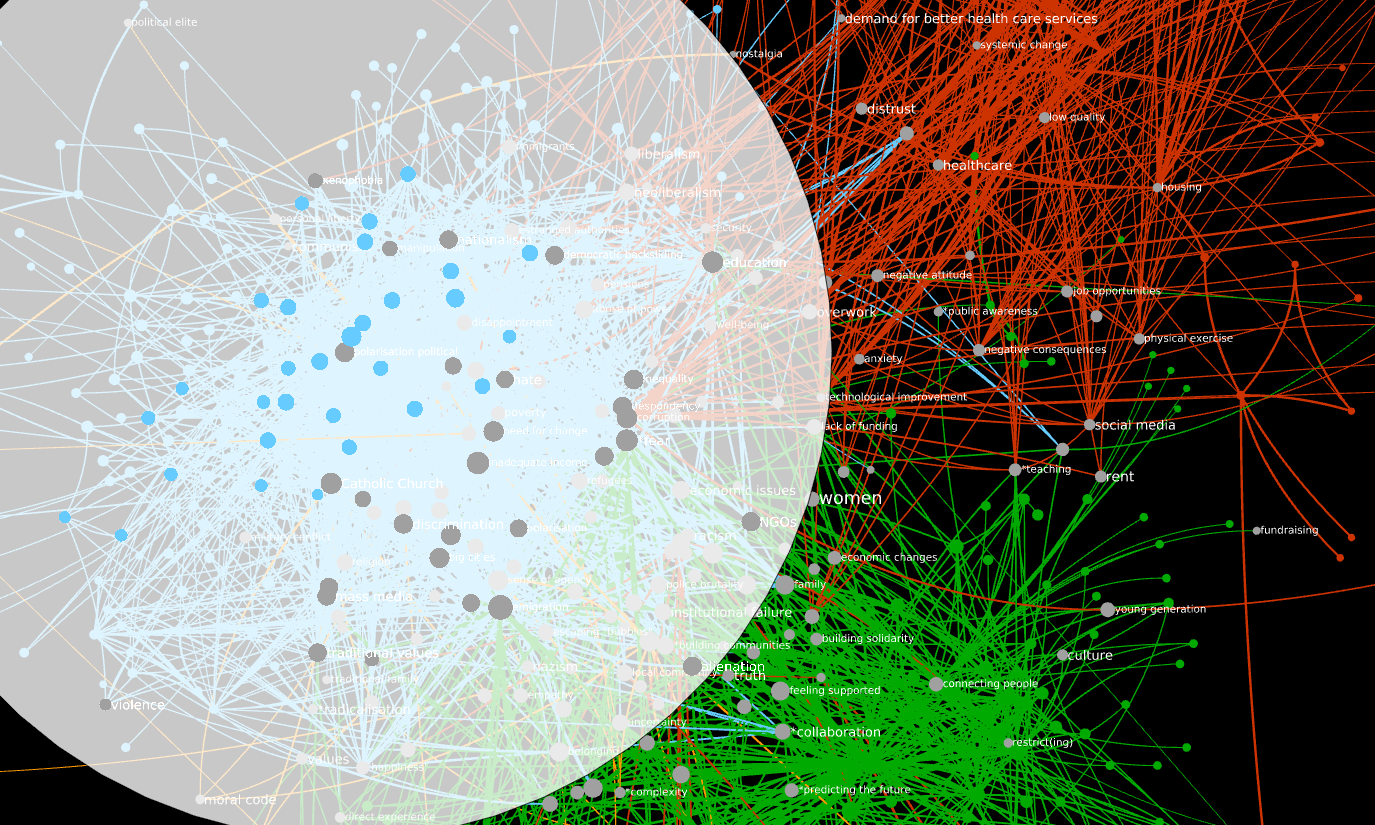
Finally, I decided to make a separate subgraph which consists only of the codes that are shared across two or more fora, and of the edges connecting them. It consists of 232 nodes and 5,645 edges. If we only take its subgraph where k >= 3 we are left with 180 nodes and 636 edges. It looks like this (I made the Polish edges a darker shade of blue so it’s easier to read the labels):
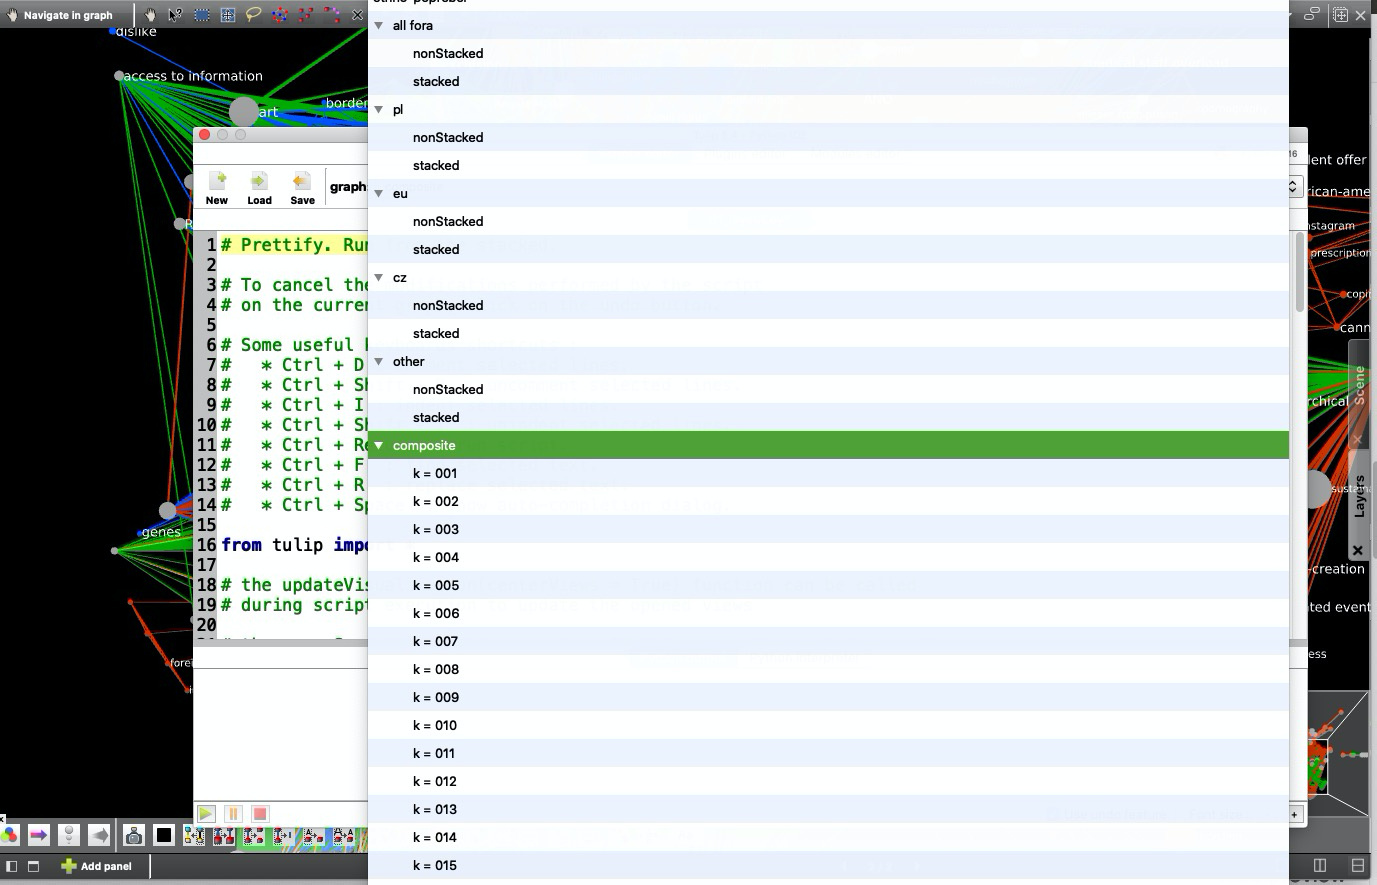
I encourage you to play with the graphs. You can download the Tulip perspective from here. The graphs of most interest to you are composite (all fora together) and intersection (all fora together, but only the nodes that are shared across two or more fora). For both I have already computed all the subgraphs at different levels of k.
Unfortunately, applying a layout algorithm to one graph messes up with the others, but no fear: only at the visualization level. Now the layout is optimized for subgraph k = 003 of intersection. If you want a pretty layout of another graph, a quick way to do it is the following:
-
Download the script d1_layout.py (you may have to click on the “Raw” button and then “save page”).
-
select the graph you are interested in, in the graph list on the left.
-
Open the Python IDE clicking on the
Pythonbutton on the left. -
Click on the
Loadbutton in the IDE and select the script you just downloaded. -
Select the graph you want to prettify from the top bar in the IDE.
-
Click on the “Play” icon in the IDE (bottom right) to run the layout script on your graph.

You can also just play with Tulip’s layout algorithms. You will find them on the top left of your Tulip window.
Have fun! @amelia @Wolha @Jan @Richard @Jirka_Kocian