In Masters of Networks: Ethnography a group of ethnographers and networks scientists gathered to make collective sense of the opencare dataset. We worked in groups, each group exploring an approach to apply network and data science to the ethnographic data.
Data are documented here. The repo for Masters of Networks: Ethnography is here. The groups were as follows:
- Networks of tag enrichment (@Amelia | @melancon ).
- Filtering the co-occurrences graph for co-occurrences happening across different threads ( @Noemi | @Jason_Vallet )
- Filtering the co-occurrences graph for n > 2 authors ( @Franca | @Medhin_Paolos | @Alberto )
- Exploring the paths between high-strength edges in the co-occurrences graph (@Federico_Monaco | @bpinaud ) .
- A machine learning approach to association patterns in groups (@brenoust ) .
In what follows I document what we did in my group.
In the co-occurrences graph (or tag-tag network) two ethnographic tags are connected to each other if they co-occur in the same piece of content. In opencare at the time of Masters of Networks 5 (late November 2016) there were about 2,500 annotations involving 587 tags. The complete co-occurrences graph is very dense (~ 7,500 edges) and unreadable. The full conversation includes 324 posts, 1,470 comments for a total of 360,000 words.
We set out to do two things:
- Use the co-occurrences graph as a way to explore the patterns of association across ethno tags throughout the opencare conversation.
- Reduce the co-occurrences graph to provide an intuitive, high-level description of the opencare conversation.
The co-occurrences graph as a gateway for exploring the conversation
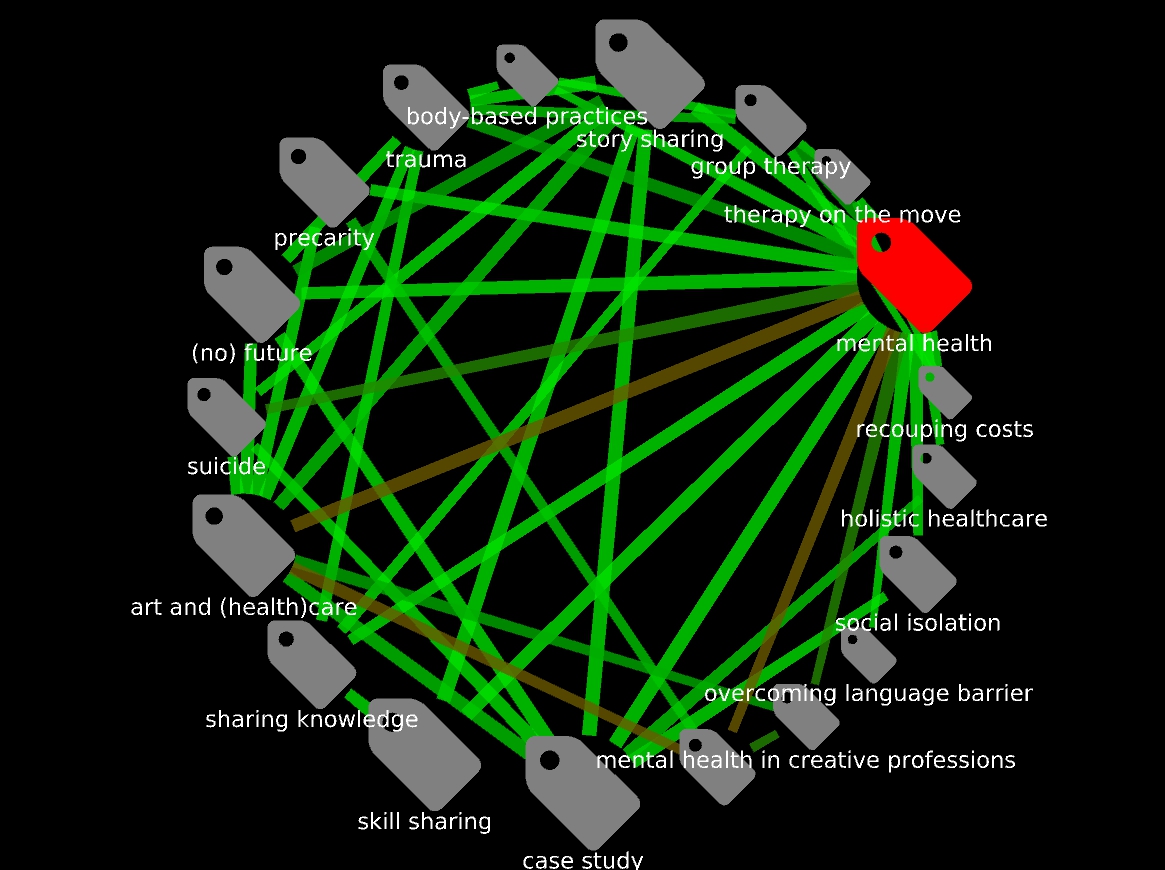
We used the ego network as our main tool of exploration:
We agreed that this is a generative method. However, there is a difficulty: the unfiltered co-occurrences is too dense to explore. So, we explored instead filtered versions of the same. At the same time, when isolating an ego network it makes sense to re-surface all connections centered on the ego tag, including those who get filtered out.
We also agreed that this way of exploring is incomplete without the possility to “drill down” to reading the post(s)/comment(s) behind the most interesting co-occurrence edges. It generates questions ("Why are people making the connection between “mental health” and “translation”?), and reading what actually people were saying when they made that connection provides answers and further insights. Fortunately, this is what the Bordeaux group is already coding.
The reduced co-occurrences graph as a high-level description of the conversation
We reduced the co-occurrences graph filtering for number of different users making the same co-occurrence at least n times.
- When
n = 1(not reduced) there are 587 tags connected by 7,489 co-occurrences. - When
n >= 2there are 261 tags connected by 944 co-occurrences - When
n >= 3there are 116 tags connected by 215 co-occurrences. - When
n >= 4there are 53 tags connected by 80 co-occurrences.
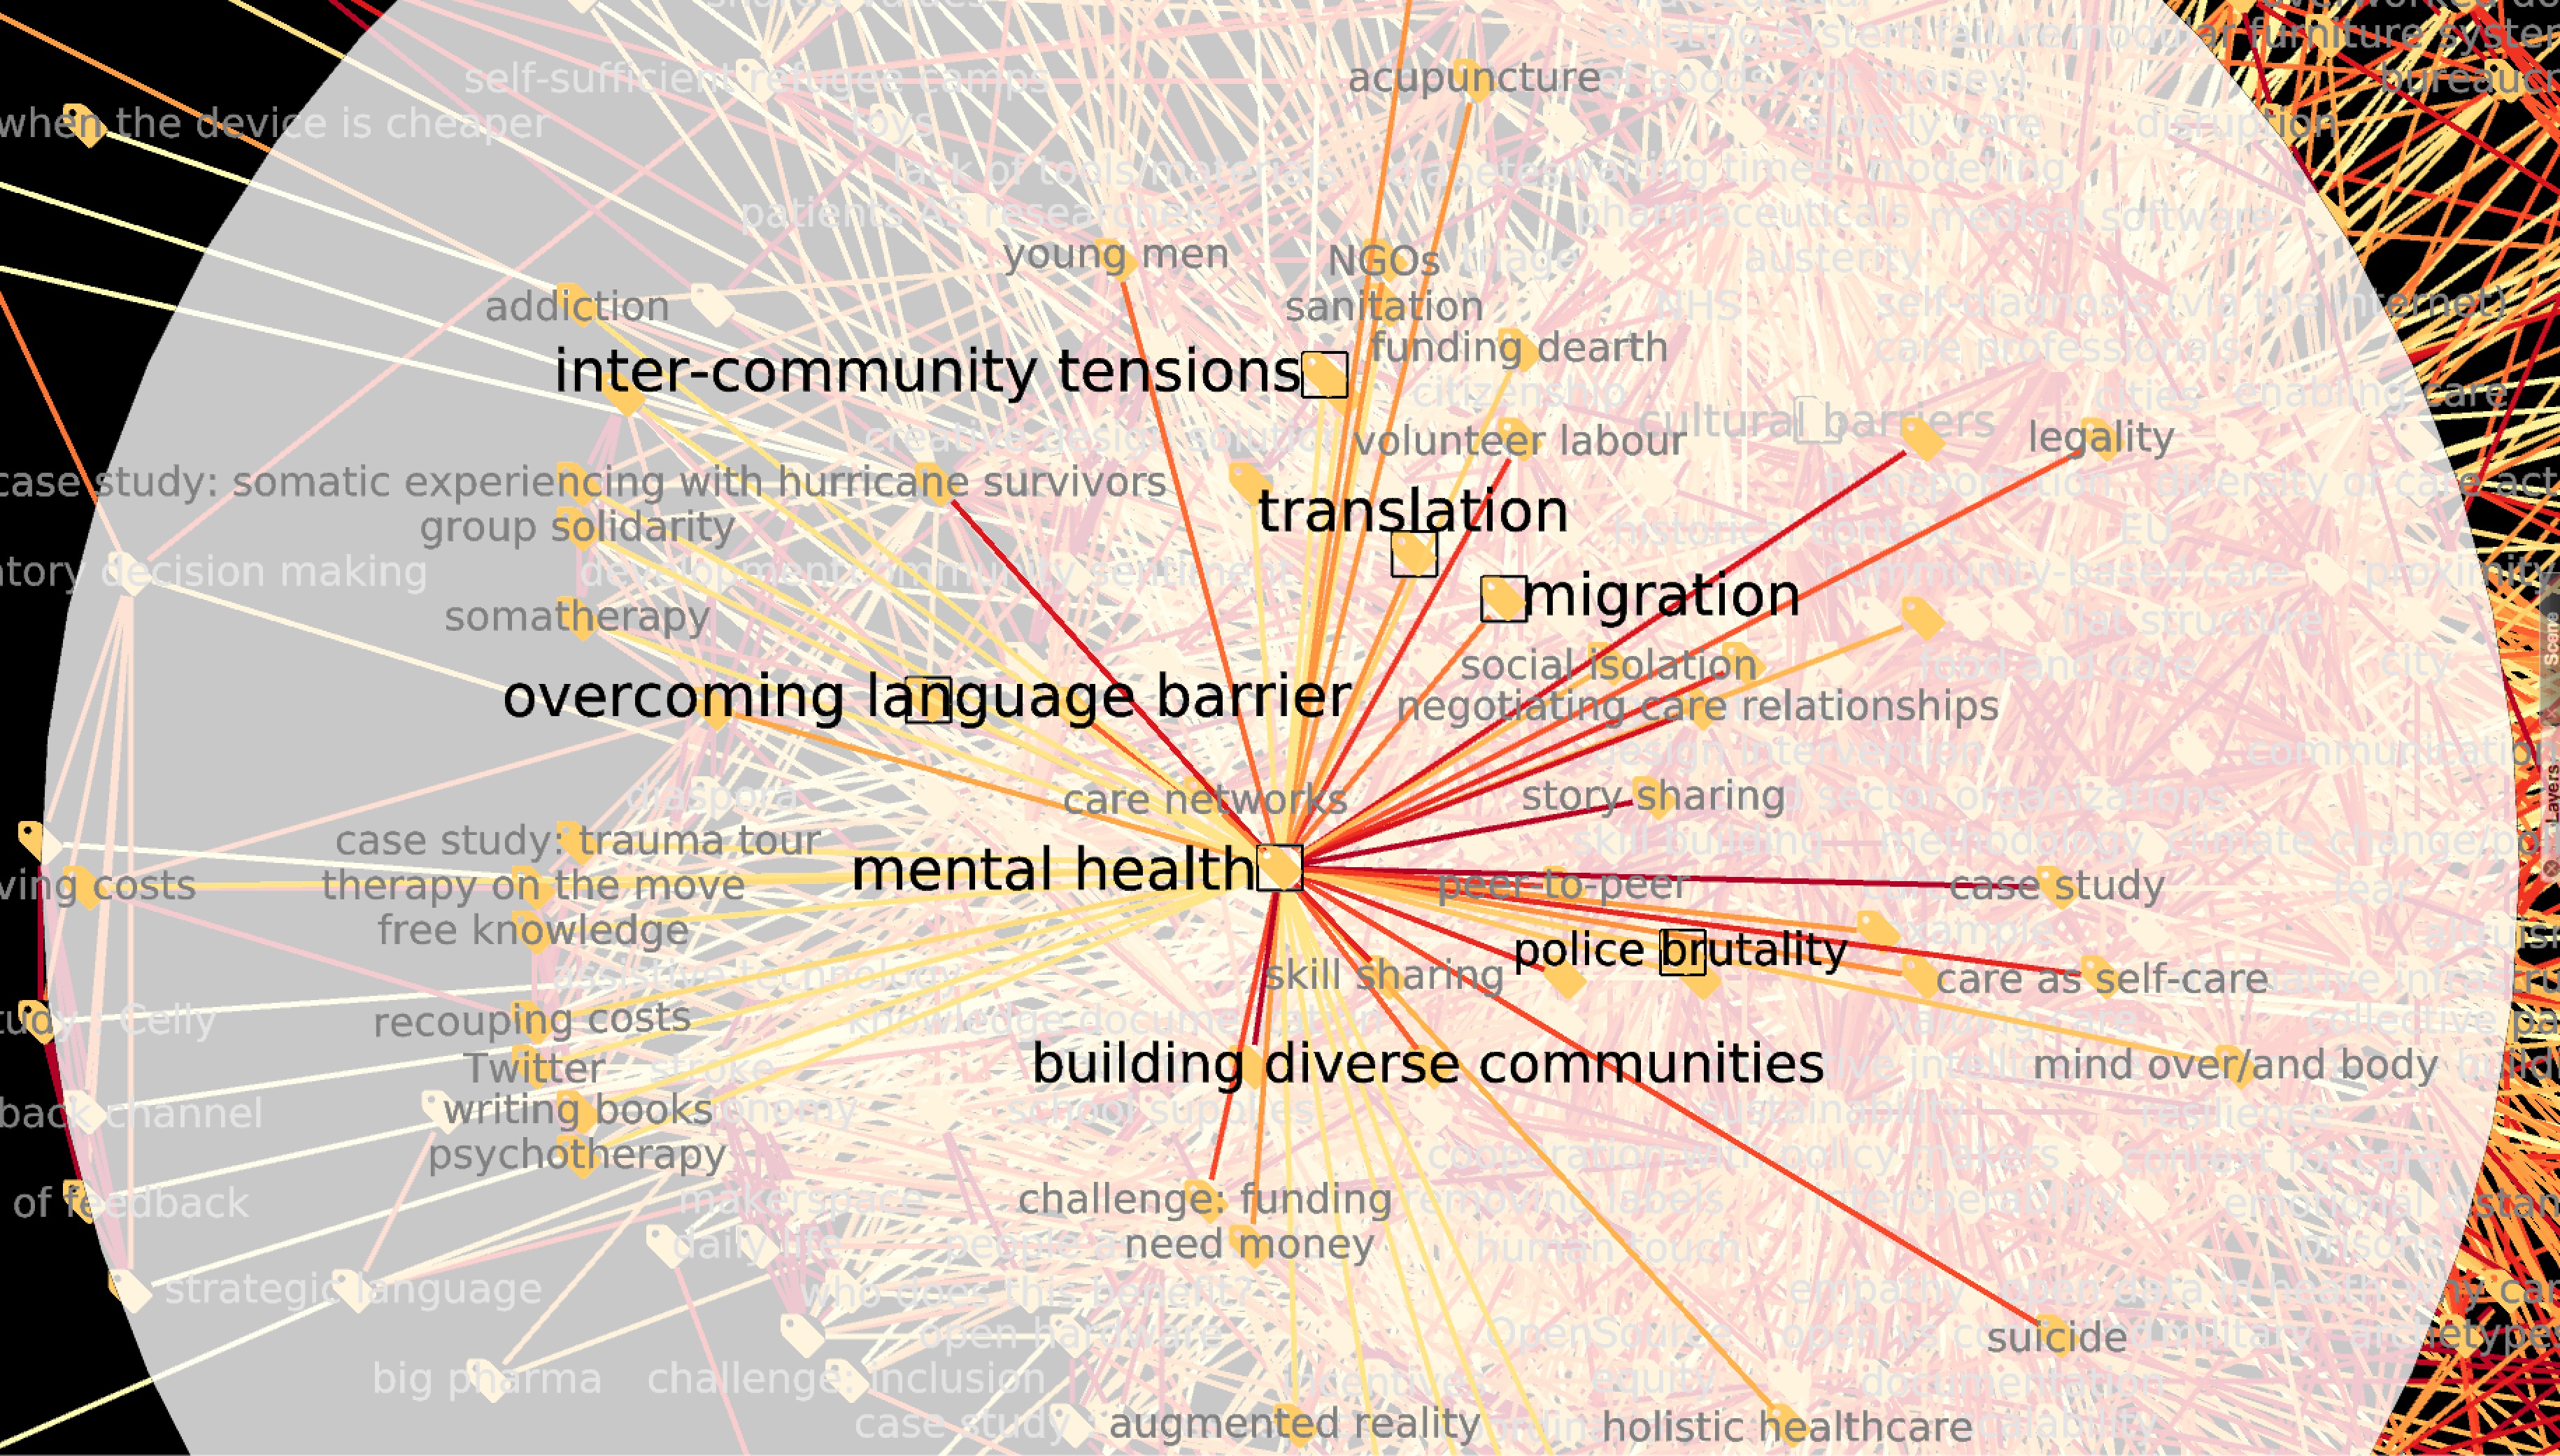
The graph reduced for n >= 4 yields the clearest results for our data:

Edges are colour-coded for number of different authors making the same association between the two tags (redder edges encode more authors. The maximum number of different authors behind an edge is 8; in the filtered graph, the minimum value is of course 4). Nodes are size-coded for degree (number of connections) in the unreduced graph.
There is clear structure in this graph. There are smaller connected components with two or three tags each; and a giant component. The latter is itself highly structured. There is a “mainland” to the west, where the most frequent co-occurrences are migration-building relationships, migration-resource strain, resource strain-crisis and community based care-distributing care burden. A “peninsula” to the west, formed of tags clustered around mental health, connects to the mainland only through one single tag, skill sharing. We can hazard several tentative conclusions, such us:
- Migration is seen by the opencare community as the biggest care issue on the table.
- Migration is closely tied to several other care issues. It is almost as migration were a compounding factor.
- Mental health and stress are a major concern for this community.
skill sharing(the only "bridge" between the mainland and the western "island") is very central in this graph. This is probably associated to the fact that upskilling community members is a central tenet of community-provided care.
What do you think? Do you see what we are seeing? Does the graph talk to you? Networks lovers, we would love to hear from you!