Hi all!
We have added several new functionalities to the dashboard http://164.132.58.138:9000; feel free to play with it and if you find issues, have some troubles, complaints, and, of course, ideas, pass them on all the same! Any sort of feedback is welcome to improve the tool ![]()
I follow hereafter with a small tutorial as initiated by Guy (see https://edgeryders.eu/en/comment/25666#comment-25666) to present the new features.
When looking at the left menu on the webpage, you can now see two different views using tags (temporarily called Tag View and Tag View Full)
1 . The first item will lead you to the view previously introduced by Guy here. We propose three permanent modules to visualise and filter the data
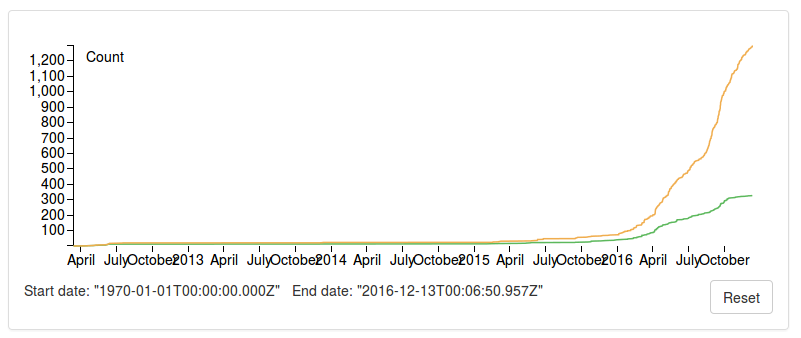
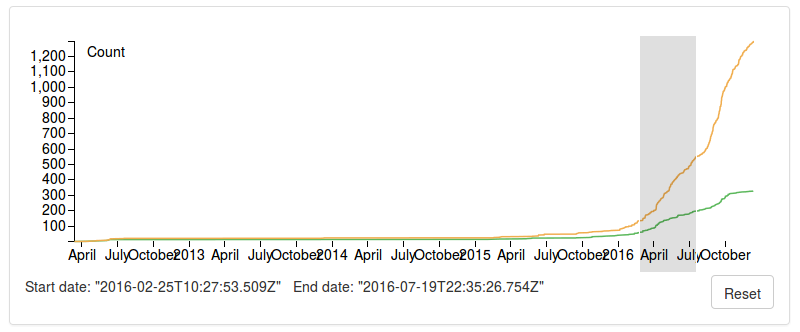
- The timeline is present for filtering purpose. Just hold-click, drag and release to select a period to use as a filter. Press the reset button to clear out the time filter.
- The node-link module shows a graph of the tag-tag relations. By default, you will start with a simple radial representation of the relations between a focused tag and the others linked to it, which looks like this:
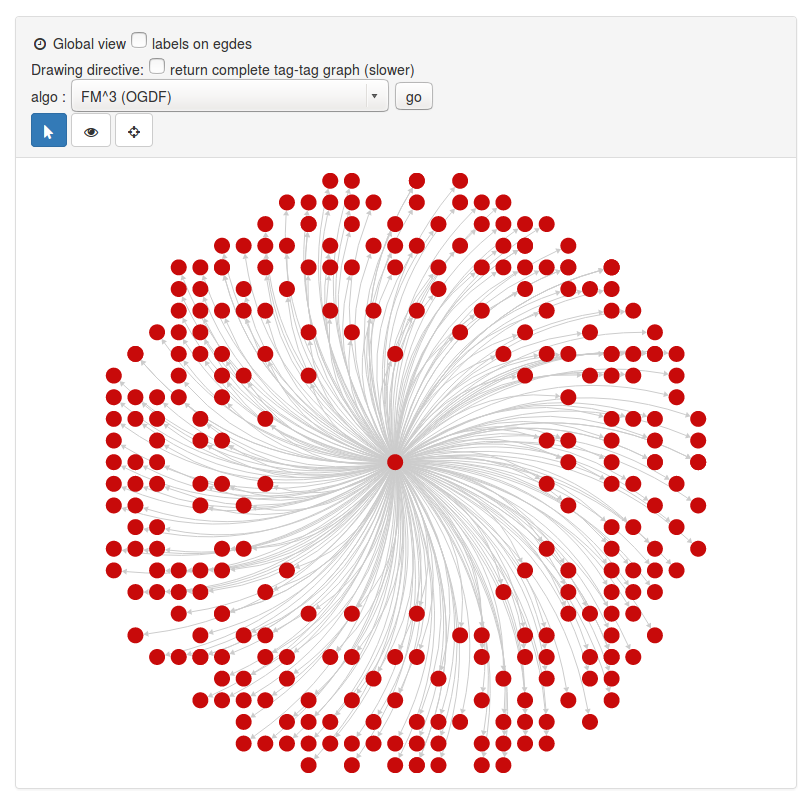
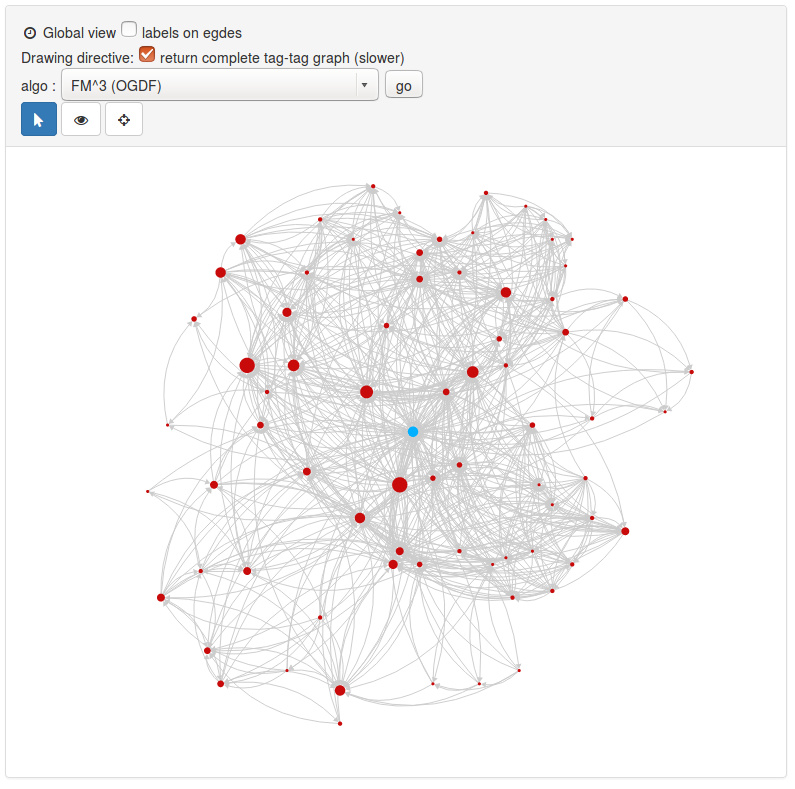
- By checking the option

at the top, you can end up with the complete tag-to-tag relation graph still focused on a single tag (now coloured in blue to ease its identification). This layout can take a few seconds to compute for heavier tags like “research question”:
- You can change the graph layout using the drop-down list

- We have added some interactors
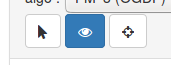
(click to select, hover for legend) to, respectfully, navigate the graph (hover the element using the cursor, zoom, move), show details (see underneath), or focus on another tag (click on another tag to make this element the main interest and to visualise the relations of this peculiar tag).
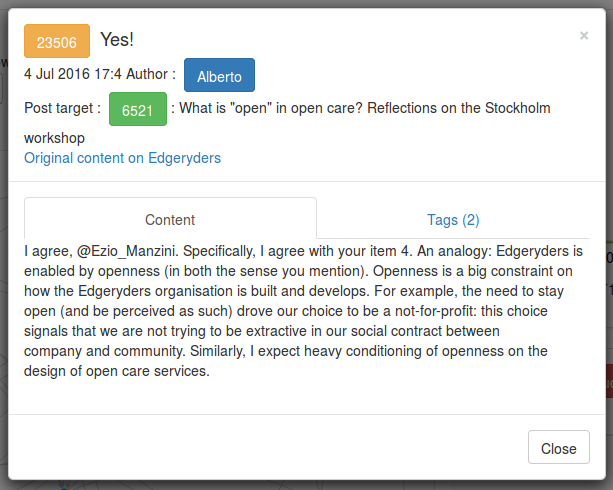
- Using the interactor show details on a node creates a "pop-up" listing the comments and posts annotated by the tag
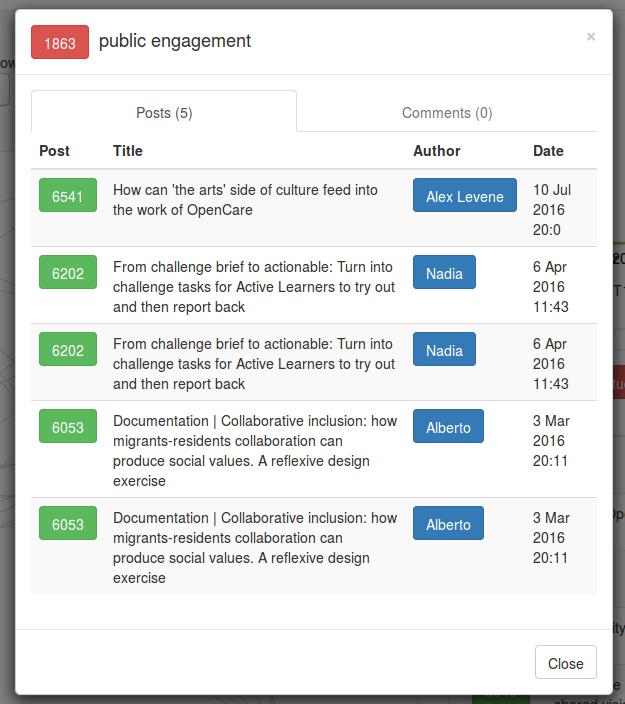
- You can click on the blue/green/yellow buttons to access the referenced content (with a link allowing a direct access to the element on Edgeryders)
- Using the interactor show details on an edge between two tags will insert a new module on the right of the page, under the timeline, listing the posts and comments annotated by these tags. Press the "Clear" button to discard the module.

- The last module on this view is a list of the most popular tags for the currently selected time period. When clicking on the tag, you will change the focus of the graph in the same way that the interactor focus on another tag and recompute the visualisation (can be a bit long for the most common tags). You can use this module to display up to a hundred tags at the same time.
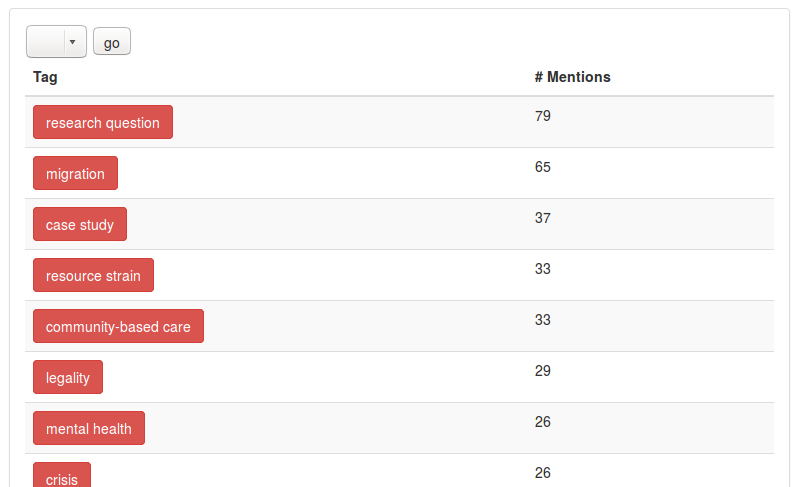
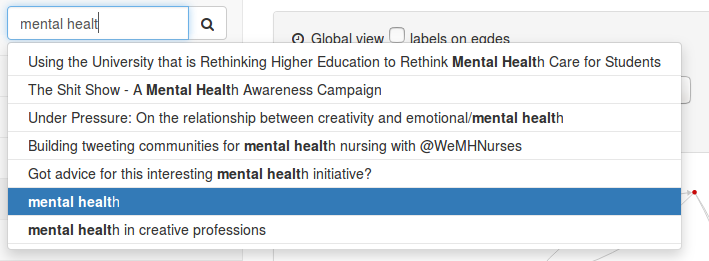
- To change the focus on another tag, you can also use the search field on the top left to type the tag you are looking for. Once the choice is validated, the visualisation will update
That’s all for the first view, let’s take a look at the second one.
2 . The Tag View Full is much simpler and aims at simply exploring the tag-to-tag relations and filter them based on their strength (number of co-occurence). This exploratory need was discussed during the Master of Network session in Milan (2016/11/27) and the underlying principles have been developed by Alberto in a previous post.
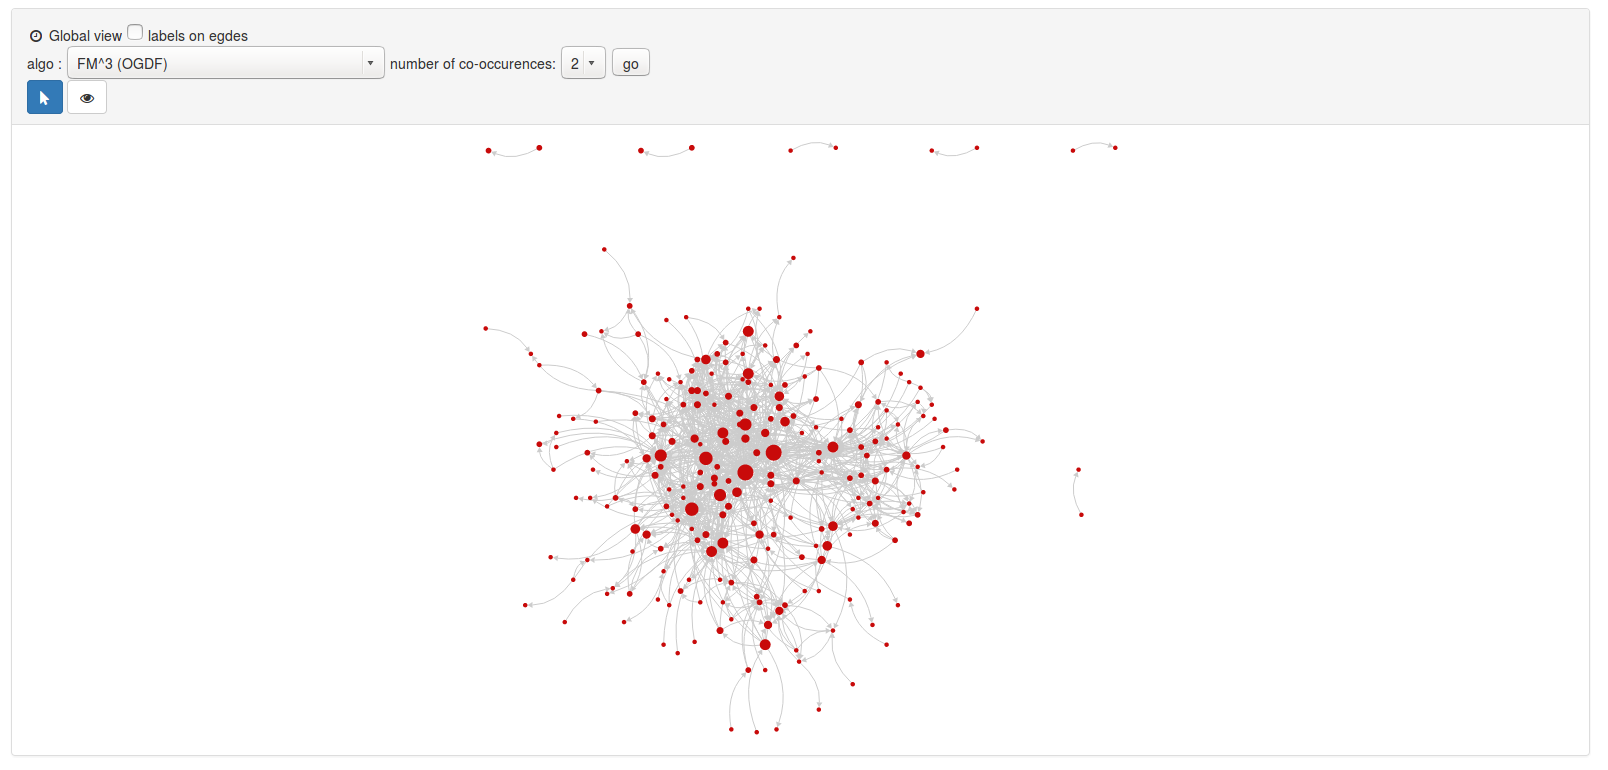
- This view only shows a single permanent panel to visualise the node-link representation of the tag-to-tag relations.
- The sole filtering tool for now allows to choose the minimum number of co-occurences an edge and a tag must possess to be displayed; the default value is set to 2 and can go up to 8.
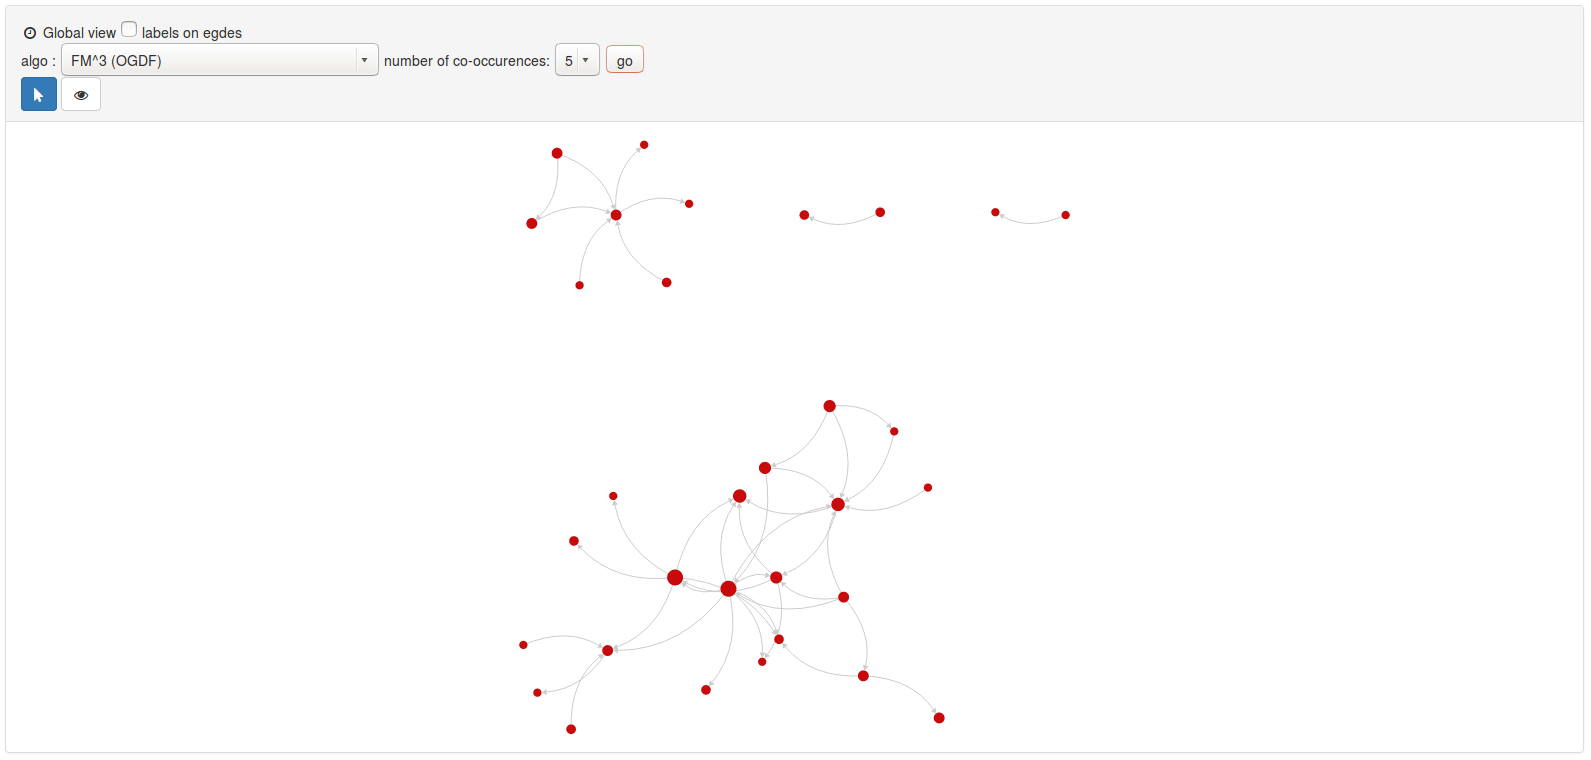
- We reuse two of the interactors introduced earlier to navigate the graph and show details. The pop-up mechanism displaying information when clicking on a node is similar to the other view and the list of comments and posts showing when clicking on an edge is added this time beneath the main module (press "Clear to discard it).

This is it for now, more will come later to take a look at the dynamics of innovation. As I have said at the begining, if you have any ideas of tasks, or ethnographic question in mind, we may be able to make up something easily or improve what is already there, so share your thoughts!
Cheers!