Why
This week I have spent some time looking at SSNA data. My goal was to find out if there is any reliable way to identify posts that are interesting for ethnographers before any ethnographer reads them. The payoff of doing so are potentially large, because it turns out that annotations (a proxy of meaning, or semantic density) are very unevenly distributed across posts. We could make coding efficient by showing ethnographers only the ones with the highest predicted semantic density… if we could predict reliably which ones are those.
Here’s what I did.
Data and code
I used the SSNA datasets from three projects:
- OpenCare
- PopRebel
- NGI Forward
Only the first one was completed. The other two are not as reliable, because coding follows posting at some distance. For this reason, some of the newer posts might be semantically very dense, and still have no annotation yet. In practice, the concatenated dataset with all three projects (8,512 posts, 10,146 annotations) behaves in a very similar way to its subset containing only OpenCare data (3,700 posts, 5,769 annotations).
Edgeryders APIs offer the following information about a post:
posts_in_topic, number of posts in the same topic (or thread).char_count, the length of the post.reply_count, the number of direct replies that specific post (as opposed to the whole topic) received.reads, the number of times that post was read. This is a bit of an estimate: Discourse has infinite scrolling: when you visit a topic your browser loads its first 20 posts, if you keep scrolling it loads 20 more and so on. ‘readers_count’ is the number of unique visitors that viewed that post. These two metrics are almost perfectly collinear.incoming_link_countis the number of links pointing to the post (including those generated by search engines during searches).quote_countis the number of times this post is quoted in other posts.scoreis an overall quality score, pre-baked by Discourse. It is a weighted average of some of the indicators above.- The number of
annotationsis of course the number of times each post is annotated. I compute this via some wrangling of data downloaded from theannotations.jsonendpoint.
My code is here.
Frequency counts and correlation
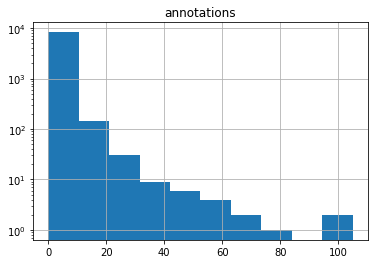
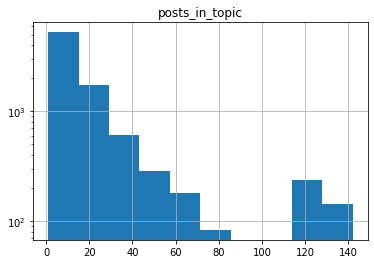
annotations and several of the quality metrics have exponential-ish behavior: their frequency counts looks more or less like a straight line on a log-linear plot.
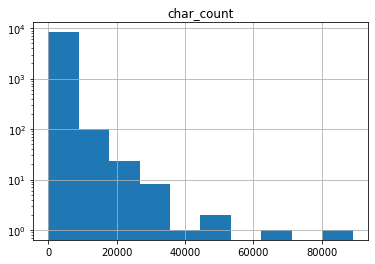
The correlation matrix looks like this:
| annotations | posts_in_topic | char_count | reply_count | reads | readers_count | incoming_link_count | quote_count | score | |
|---|---|---|---|---|---|---|---|---|---|
| annotations | 1.000000 | -0.063251 | 0.314787 | 0.035931 | 0.053185 | 0.053182 | 0.106176 | -0.022958 | 0.114783 |
| posts_in_topic | -0.063251 | 1.000000 | -0.112495 | 0.182892 | 0.409954 | 0.409959 | -0.005901 | 0.120444 | 0.013525 |
| char_count | 0.314787 | -0.112495 | 1.000000 | -0.017715 | 0.056545 | 0.056542 | 0.178403 | -0.017490 | 0.191785 |
| reply_count | 0.035931 | 0.182892 | -0.017715 | 1.000000 | 0.167755 | 0.167748 | 0.015386 | 0.091541 | 0.047727 |
| reads | 0.053185 | 0.409954 | 0.056545 | 0.167755 | 1.000000 | 0.999999 | 0.240466 | 0.165700 | 0.302308 |
| readers_count | 0.053182 | 0.409959 | 0.056542 | 0.167748 | 0.999999 | 1.000000 | 0.240468 | 0.165699 | 0.302310 |
| incoming_link_count | 0.106176 | -0.005901 | 0.178403 | 0.015386 | 0.240466 | 0.240468 | 1.000000 | -0.009352 | 0.991238 |
| quote_count | -0.022958 | 0.120444 | -0.017490 | 0.091541 | 0.165700 | 0.165699 | -0.009352 | 1.000000 | 0.000815 |
| score | 0.114783 | 0.013525 | 0.191785 | 0.047727 | 0.302308 | 0.302310 | 0.991238 | 0.000815 | 1.000000 |
I find this surprising. Correlations go mostly in the expected directions, but they are lower than I expected. It seems that semantic density as perceived by ethnographer is only weakly correlated to measures like reads or quote_count, which arguably represent quality as perceived by participants in the conversation. That said char_count is far and away the algorithmic indicator with the strongest covariance with annotations.
Regression
I tried two things.
- Linear regression of
annotationsover all quality measures (exceptreadersandscore, to avoid collinearity issues), plus 272 dummy variables representing the 272 authors. - Logit regression of
annotations > 0vs.annotations==0over the same set of variables as above.
Results: linear model
- All user dummy variables are highly significant (t-statistics around
|5| -|10|9: the probability of a post being annotated depends heavily on who the author is. char_countvery highly significant, t-statistic = 25.incoming_link_countalso significant, but only few posts have those, so it is not a universally useful indicator.reply_countbarely significant.- All other variables not significant, including the length of the topic (
posts_in_topic). This comes as a surprise, as @amelia and I had been informally using it as a proxy of quality. I think what’s going on is this: a long topic is almost certain to contain some semantically dense posts, but it is also likely to contain several irrelevant ones. So, as the topic lenghtens, it contains more semantics, but it does not become more semantically dense. - R-square = 0.36: model only explains 36% of the total variance.
- Heteroskedastic – in particular, residuals get larger (the model predicts less well) as the number of annotations in a post gets larger. This could be indicative of non-linearities.
Results: logit model
- All participants with no annotations, and all participants who authored only one post, annotated or not, are discarded.
- Once that’s done, the dummy variables encoding the identities of authors are no longer significant.
char_countstill highly significant. No other variable is significant at the 99% confidence level.- Pseudo R-square = 0.13. Not great explanatory power.
- Proabaly also heteroskedastic. Much more difficult to test for heteroskedasticity in logit/probit models, so I am not going to go into it until someone requests it.
Conclusions and next steps
The length of an individual post (but not of the topic that contains it) has a robust and positive correlation with its semantic density. The long form is simply more conducive to coding. By implication, SSNA projects would do well to encourage thoughtful, long-form exchanges over rapid-fire, chat-like ones.
As a next step, we could
- verify these results with more data. This means either waiting for the current projects are completed, or (better) selecting a subset of posts that were already processed by ethnographers.
- attempt training a classifier to predict, based on the data, which posts are more likelyh to be codable.
