These are here
This is here
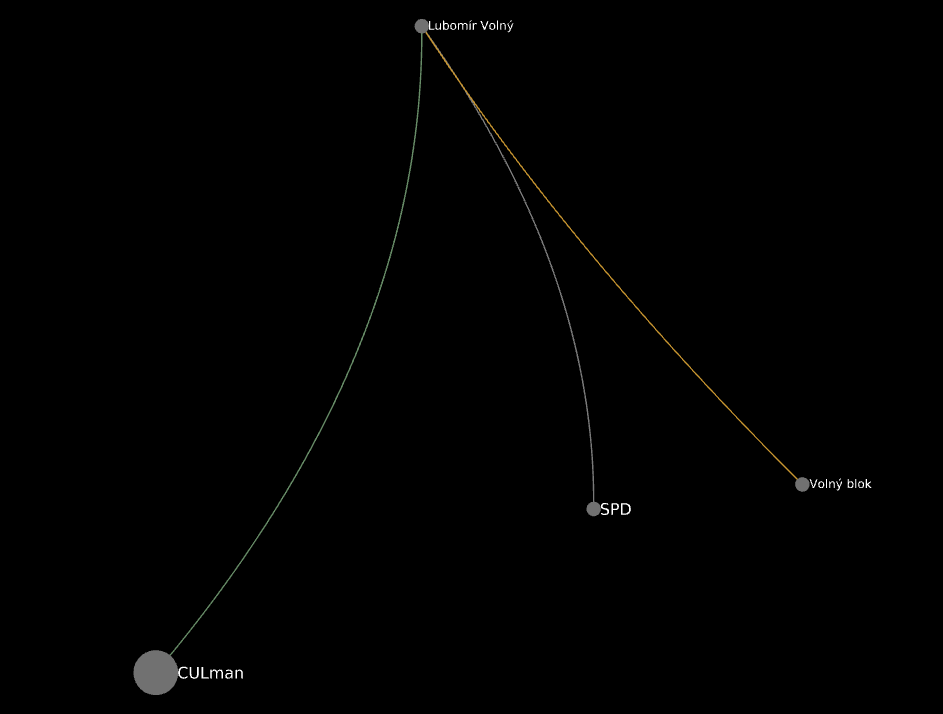
Lubomír Volný in the usual b>=4 graph:
Lubomír Volný
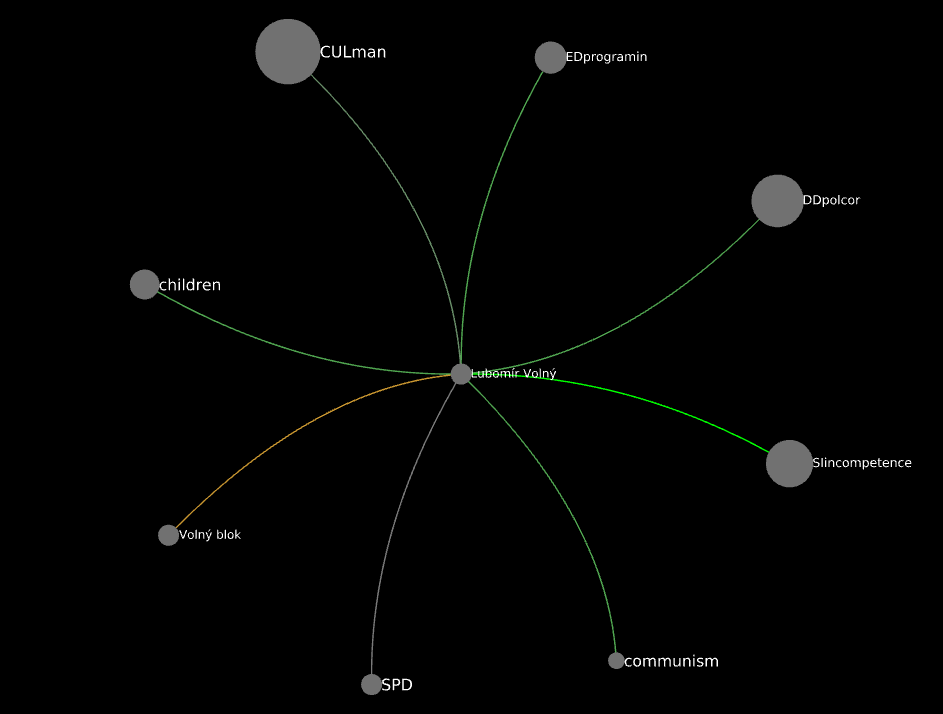
Lubomír Volný at b>=3:
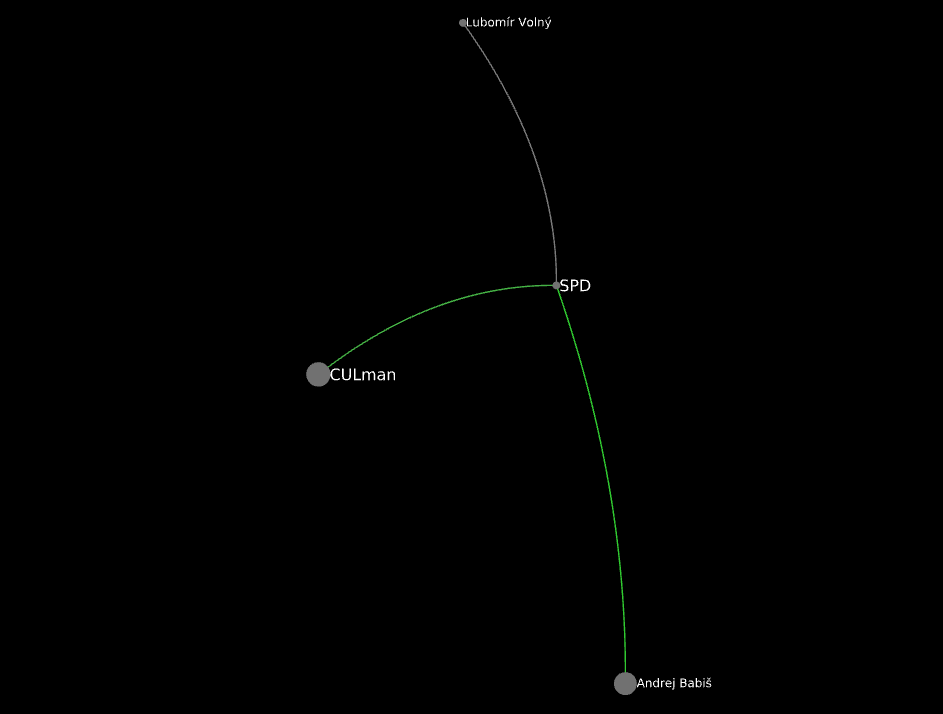
SPD:
SPD
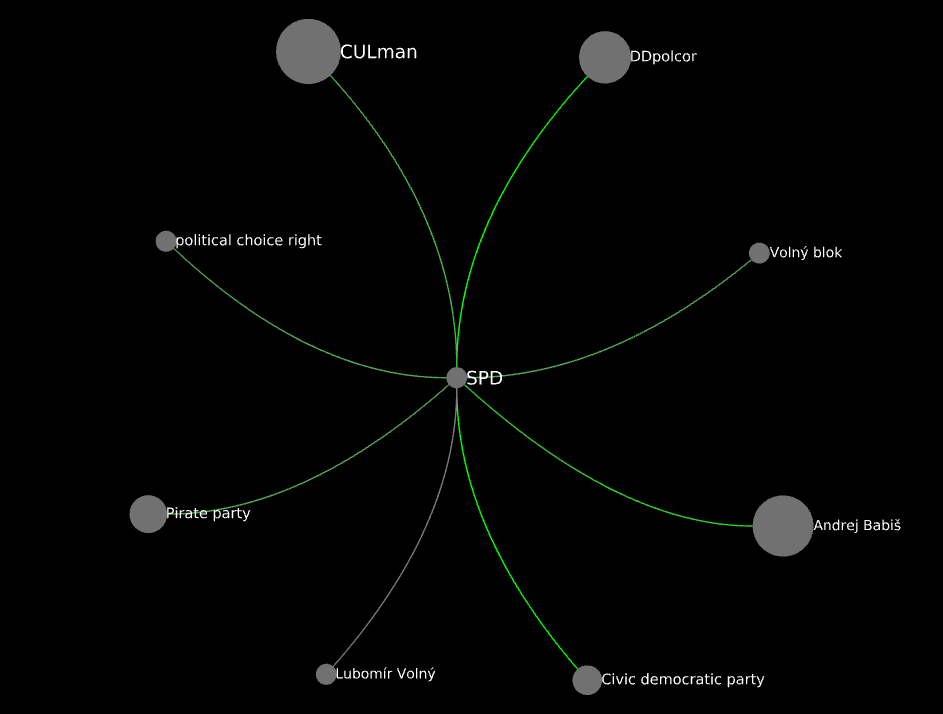
SPD at b>=3:
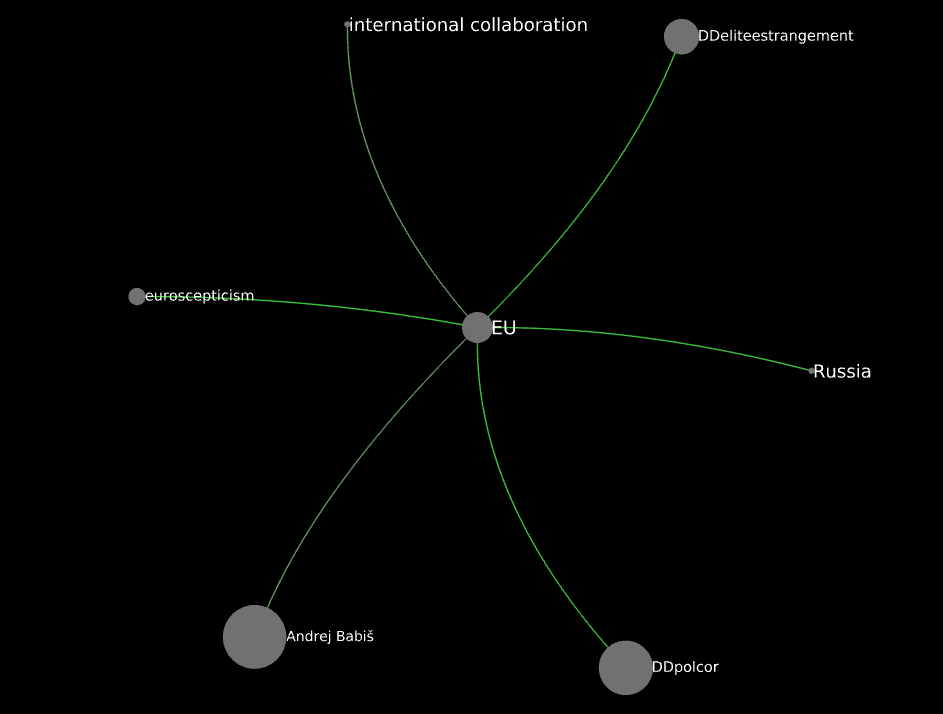
EU:
EU