Experimenting with visualizing gender in co-occurrence networks

In POPREBEL we have information on the gender of informants. I have been thinking about how to integrate this information with our approach based on visualizing networks of co-occurrences (CCNs henceforth). In this post I would like to explain what I came up with so far.

Gendered edges

Our method is all about associations (by co-occurrence) between codes, rather than lists of codes. A natural way to think about genders in this context is to assign a gender to the edges of the co-occurrence networks. Let’s say that Alice, a female informant, answered a question in an interview, and her answer was coded with code1 and code2. As we always do, we represent this by creating an edge between the two codes; now, we also attribute Alice’s gender to the edge itself: e = (code1, code2, "female").

In the next phase of our approach, we stack all edges between code1 and code2: this allows us to compute the edge’s strength and, consequently, to reduce the CCN. So, what happens if an edge represents a co-occurrence between codes that appears in the transcripts of both female and male informants? Imagine the informants were Alice (female), Bob (male) and Carol (female). Then

e(Alice) = (code1, code2, "female") +
e(Bob) = (code1, code2, "male") +
e(Carol) = (code1, code2, "female") =

e(all) = (code1, code2, female_prevalence = 0.67)

In natural language, for each stacked edge I compute the statistics

female_prevalence = number of female edges / total number of edges

A value of 1 obtains when all the informants who associated code1 and code2 are female. A value of zero indicates that they are all male. Values around 0.5 indicate gender balence. In the example above, 0.67 results from dividing the number of female informants (2. Alice and Carol) by the total number of informants (3, including Bob too). This statistic can then be visualized by color coding.

So, how does that play out in POPREBEL data?

Polish corpus

A look at female_prevalence

In the Polish corpus, female_prevalence has a mean value of 0.6. This means that female informants have contributed slightly more than male ones to the breadth of the edges. female_prevalence is uncorrelated with association_depth and association_breadth. Its frequency distribution looks like this:

image

The shape reflects that the fact that most of the 11K+ edges have breadth 1, and therefore they can only assume a value of female_prevalence of 0 (if the single informant is male) or 1 (otherwise). If we filter for b >= 6, the frequency distribution shows a peak between 0.5 and 0.7:

image

The average value of female_prevalence in the reduced network is 0.66. There are no “all-male” edges at all, while there are 15 all-female ones. We conclude that female informants made more of a contribution to this CCN than male ones. Maybe females agree with one another more, and contribute disproportionately to the broader edges in the network?

Below, I have redrawn the CCN. Edge color no longer codes for strength, but for female_prevalence, on a three-color scale:

More green => lower female_prevalence
More gray => female_prevalence around 0.5
More orange => higher female_prevalence

image

And this is the same Polish CCN, but filtered for b >= 6:

image

It can be interesting to explore this network to see which associations are predominantly made by informants of either gender. Consider the neighborhood of pandemic:

image

And that of civic platform/coalition:

image

Czech corpus

A look at female_prevalence

female_prevalence in this corpus has a mean value of 0.56, so close to gender balance. Here, too, it is uncorrelated with measures of edge strength.
The overall pattern is very similar to that in the Polish corpus. Frequency distribution for the whole corpus:

image

The broadest edges in the Czech corpus also skew female, but less so than in the Polish one. Frequency distribution for the reduced network (b >= 4, with 84 codes and 184 edges):

image

The average value of female_prevalence in the reduced network is 0.46, so very close to perfect balance. There are 11 “all-male” edges, and 9 all-female ones.

Drawing the reduced network for b >=4, there seems to be more separation:

image

The center sees a larger prevalence of gender-balanced gray edges. To the west, male-heavy green edges prevail; to the east, it’s more female-heavy orange ones. Let’s see a few example of ego networks; here’s lockdown:

image

´DDpolcor`:

image

Andrej Babiš:

image

Some final questions

  • Does this way of visualizing gender speak to you, @rebelethno? If so, would you like to see a different reduced network? The ego networks of other codes? Any other curiosity?
  • If not, what it is that you would like to see? What are your research questions that involve gender, and how can we serve them by appropriate data analysis and visualzations?

Hi @alberto, would it be possible to show genered ego networks of “CULman” for Polish and for Czech?

Czech

image

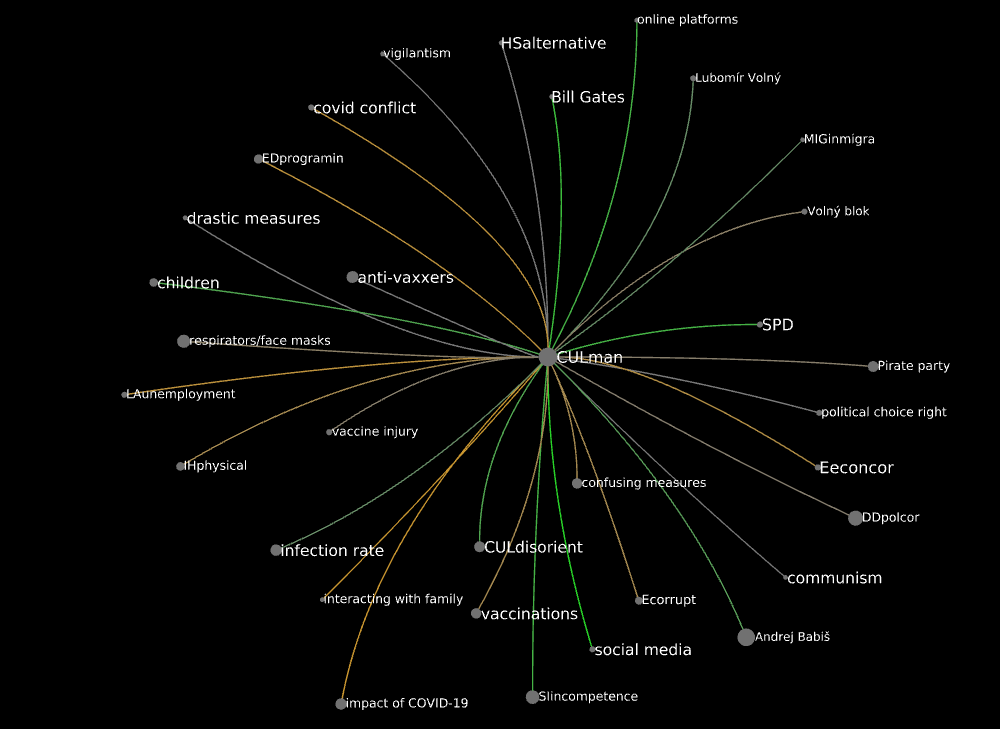
List of the codes co-occurring with CULman in the Czech corpus
Andrej Babiš
anti-vaxxers
Bill Gates
children
communism
confusing measures
covid conflict
CULdisorient
CULman
DDpolcor
drastic measures
Ecorrupt
EDprogramin
Eeconcor
HSalternative
IHphysical
impact of COVID-19
infection rate
interacting with family
LAunemployment
Lubomír Volný
MIGinmigra
online platforms
Pirate party
political choice right
respirators/face masks
SIincompetence
social media
SPD
vaccinations
vaccine injury
vigilantism
Volný blok

Polish

image

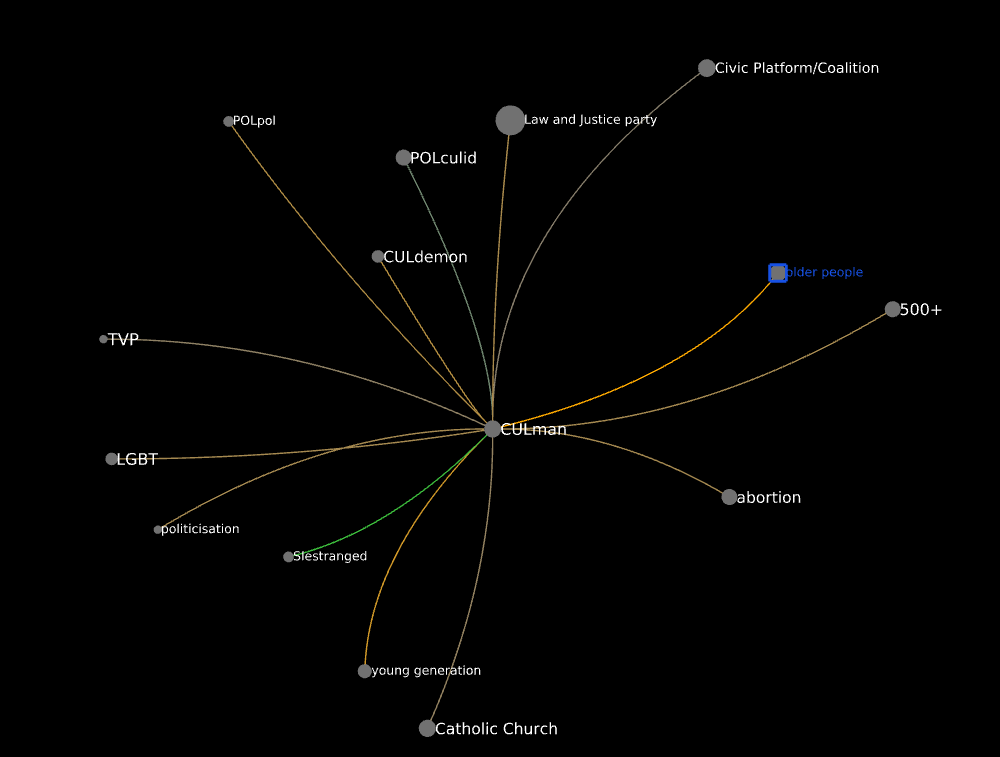
List of the codes co-occurring with CULman in the Polish corpus
500+
abortion
Catholic Church
Civic Platform/Coalition
CULdemon
CULman
Law and Justice party
LGBT
older people
POLculid
politicisation
POLpol
SIestranged
TVP
young generation

Dear @alberto or @hugi. Is it possible, that the http://server-2021.edgeryders.eu/ does not load any corpuses of data? I can not select any platform from the roll-down window as it is empty. Or is it only my computer? (It worked around 8 a.m. CET today, but since around 10 a.m. it is not working.) Thanks for letting me know. Best, Zdenek

It looks like it, yes. I will look into it now.

1 Like

Problem has been found, the database stopped running. We are working on fixing it.

Let me know, @hugi, once it is done, I just wanted to do some graphs for our Sexuality in the Media Poprebel corpuses. Thank you.

1 Like

Unfortunately it is taking a bit longer than I had hoped to fix this. There was a server security upgrade that broke the database connection. I have asked @matthias for help.

@SZdenek - the selection menu on the landing page is still acting strange, but you should now be able to access through http://server-2021.edgeryders.eu/dashboard/edgeryders/ethno-poprebel - just change the ethno-poprebel part to whatever corpus you want to work with.

2 Likes

@alberto @Maniamana @Wojt @Nica @Richard @jitka.kralova @Jirka_Kocian @SZdenek @SantosCardonaPR @Djan

Dear All,

please have a look at pages 30-31 of the emerging deliverable: https://docs.google.com/document/d/1GZijje2TLq3cDBK5oKzRU4mqlwwlhUHqW31n_SSpoq8/edit#.

I finally managed to do what I always wanted to try: analyze an important relationship (in this case abortion and the Catholic Church) by manipulating the levels of co-occurrence. I hope this may be a good model to follow - but please let me hear your reactions and criticisms. I have to admit that it got me quite excited, but what do I know after 10 hours of working… Ciao!

5 Likes

I guess you are talking about the section called “Values, politics, and the politics of values: freedom”? Now it is no longer at page 31…

Anyway, I like what you are doing there. The chain from data to network visualization is quite long, with much potential for glitches and false interpretation. So, it is prudent to turn to the most robust results, those that surface more or less regardless of the precise visualization you build, and of the reduction technique you use.

Also, a technical note: Graphryder reduces by association depth, but it uses a slightly different definition of depth. I can go into details, if you want, but the point is that it is better (at least in the text) not to put too much stock in the precise values of d. Of course, d in Tulip and d in Graphryder are very highly correlated, likely in excess of 99%, so the result is still valid.

2 Likes

@alberto @Maniamana @Wojt @SZdenek @Jirka_Kocian @jitka.kralova @Nica @Richard

Dear All, I am afraid I will be able to participate today (November 25) only until my 9:30 (14:30 in London). We have at SSEES a funeral that I will attend online and Richard in person in London. It starts at 9:30 EST. We lost our amazing colleague, Philippa Hetherington, a rising star of late Russian imperial and early Soviet history, who was just 37, to breast cancer. To our dear female colleagues: please be meticulous in monitoring your bodies - it is quite preventable if detected early. Yours, Jan

@alberto I am working on the deliverable today - it is begining to be quite impressive. I am meeting with Nica in 20 minutes (at my 10:00 - it is Thursday, December 1, BTW). I would like to have a chat with you on several issues. When are you available? Hope all is good with you. Yours, Jan

Hi Jan, actually I am a bit swamped, but… could offer Saturday, and I will even be on NY time. Need to check exactly when, likely in the afternoon.

@alberto Saturday is great. I iwll be working the whole day… Just let me know when you can be available. Many thanks! HOpe you are OK. Yes, I know “swampiness” all around.

1 Like

Hi guys, I am running late, won’t make it to the meeting today, please let me know if there is anything I need to know or do:)

Hello @Jan, from now to, say, 16.30 EST would be OK. Can you ping me though? I am on the road, limited bandwidth. We’ll probably need a VOIP call (not video).

Hi @alberto Sure, I can ping. What would be the best way? Do you have a number I can use? I can do at 3:30?

Moving to direct message.