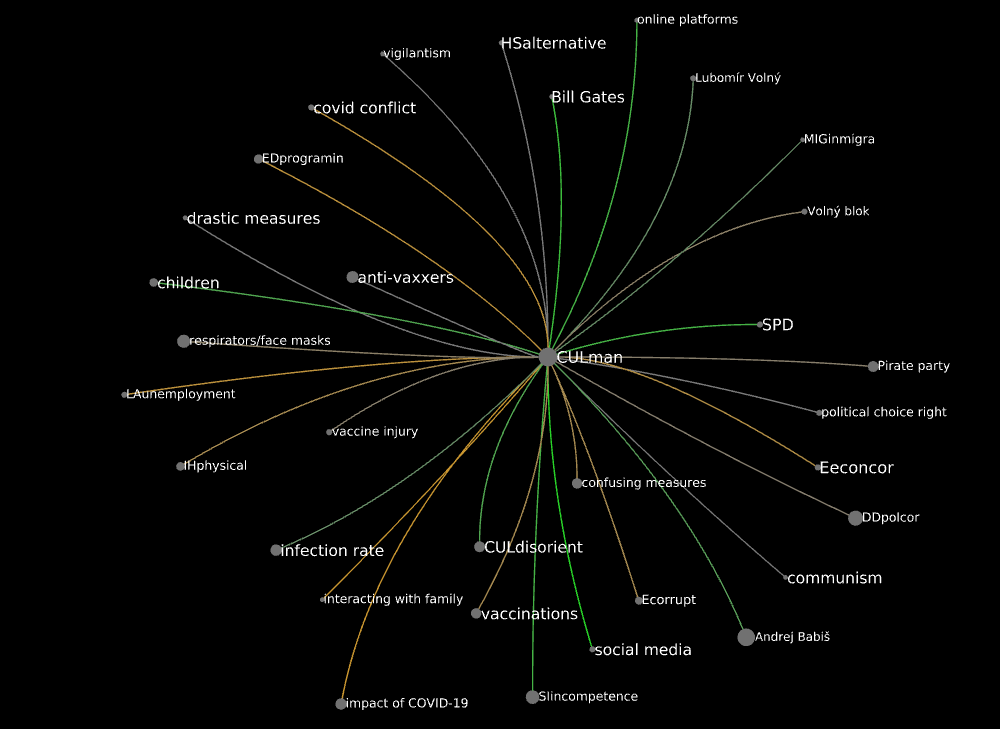
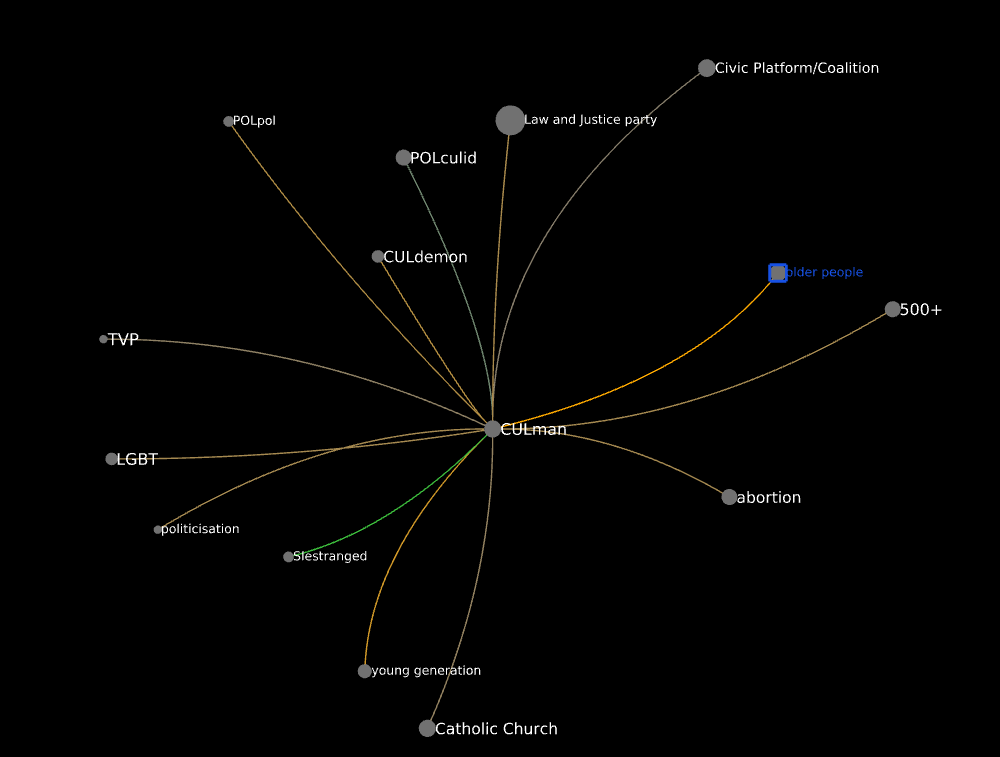
In POPREBEL we have information on the gender of informants. I have been thinking about how to integrate this information with our approach based on visualizing networks of co-occurrences (CCNs henceforth). In this post I would like to explain what I came up with so far.
Gendered edges
Our method is all about associations (by co-occurrence) between codes, rather than lists of codes. A natural way to think about genders in this context is to assign a gender to the edges of the co-occurrence networks. Let’s say that Alice, a female informant, answered a question in an interview, and her answer was coded with code1 and code2. As we always do, we represent this by creating an edge between the two codes; now, we also attribute Alice’s gender to the edge itself: e = (code1, code2, "female").
In the next phase of our approach, we stack all edges between code1 and code2: this allows us to compute the edge’s strength and, consequently, to reduce the CCN. So, what happens if an edge represents a co-occurrence between codes that appears in the transcripts of both female and male informants? Imagine the informants were Alice (female), Bob (male) and Carol (female). Then
e(Alice) = (code1, code2, "female") +
e(Bob) = (code1, code2, "male") +
e(Carol) = (code1, code2, "female") =

e(all) = (code1, code2, female_prevalence = 0.67)
In natural language, for each stacked edge I compute the statistics
female_prevalence = number of female edges / total number of edges
A value of 1 obtains when all the informants who associated code1 and code2 are female. A value of zero indicates that they are all male. Values around 0.5 indicate gender balence. In the example above, 0.67 results from dividing the number of female informants (2. Alice and Carol) by the total number of informants (3, including Bob too). This statistic can then be visualized by color coding.
So, how does that play out in POPREBEL data?
Polish corpus
A look at female_prevalence
In the Polish corpus, female_prevalence has a mean value of 0.6. This means that female informants have contributed slightly more than male ones to the breadth of the edges. female_prevalence is uncorrelated with association_depth and association_breadth. Its frequency distribution looks like this:
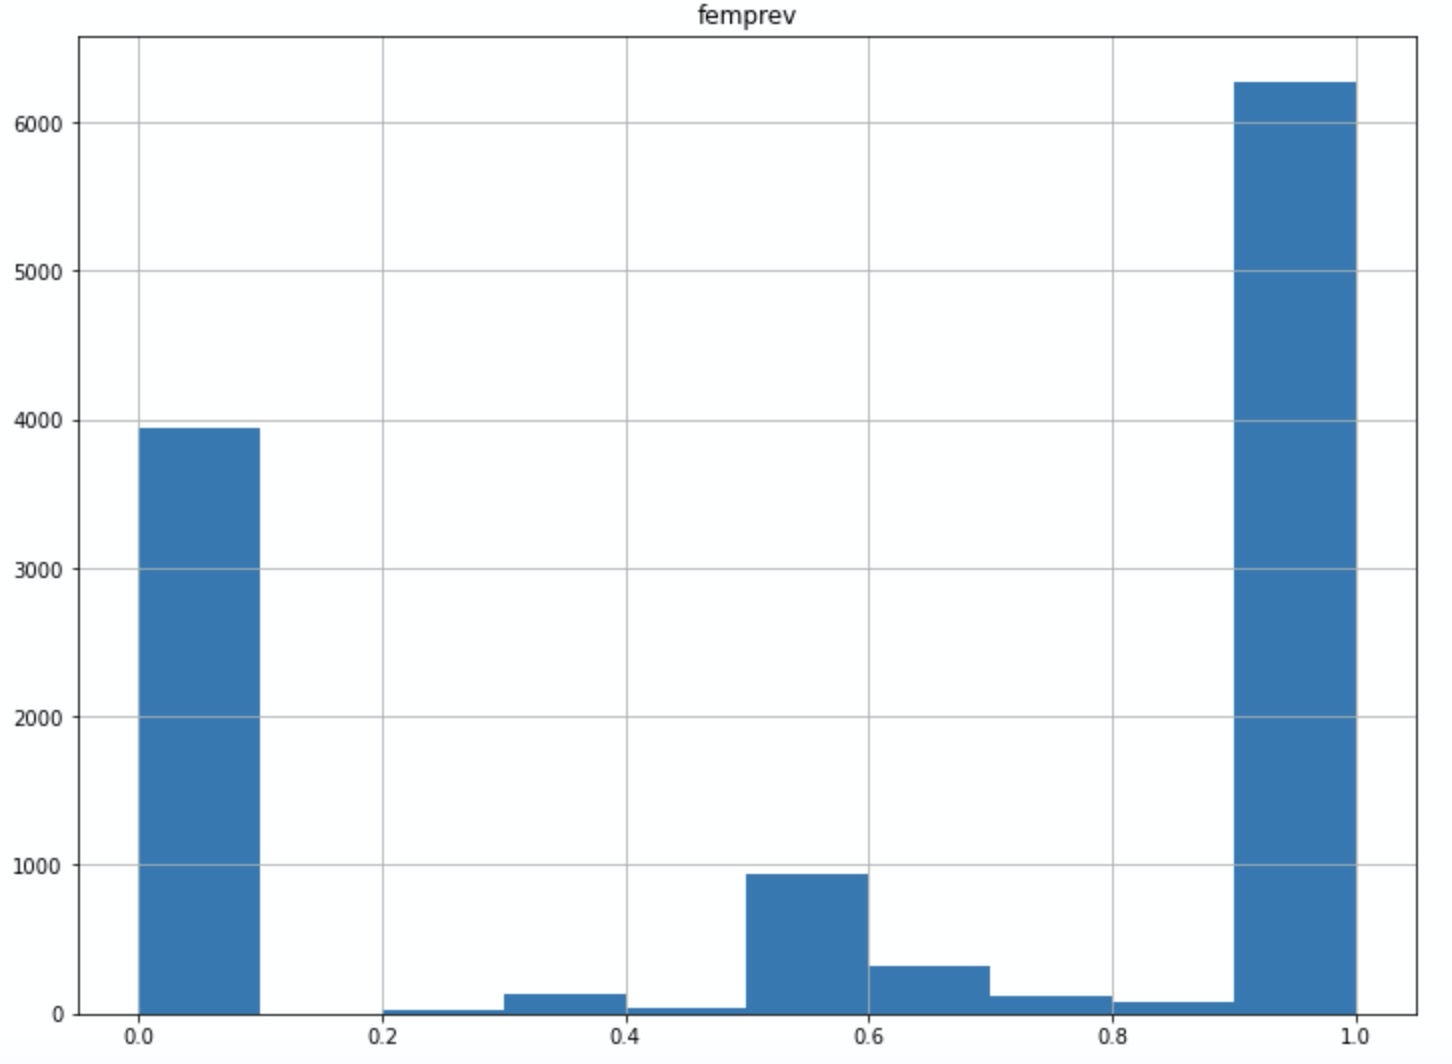
The shape reflects that the fact that most of the 11K+ edges have breadth 1, and therefore they can only assume a value of female_prevalence of 0 (if the single informant is male) or 1 (otherwise). If we filter for b >= 6, the frequency distribution shows a peak between 0.5 and 0.7:
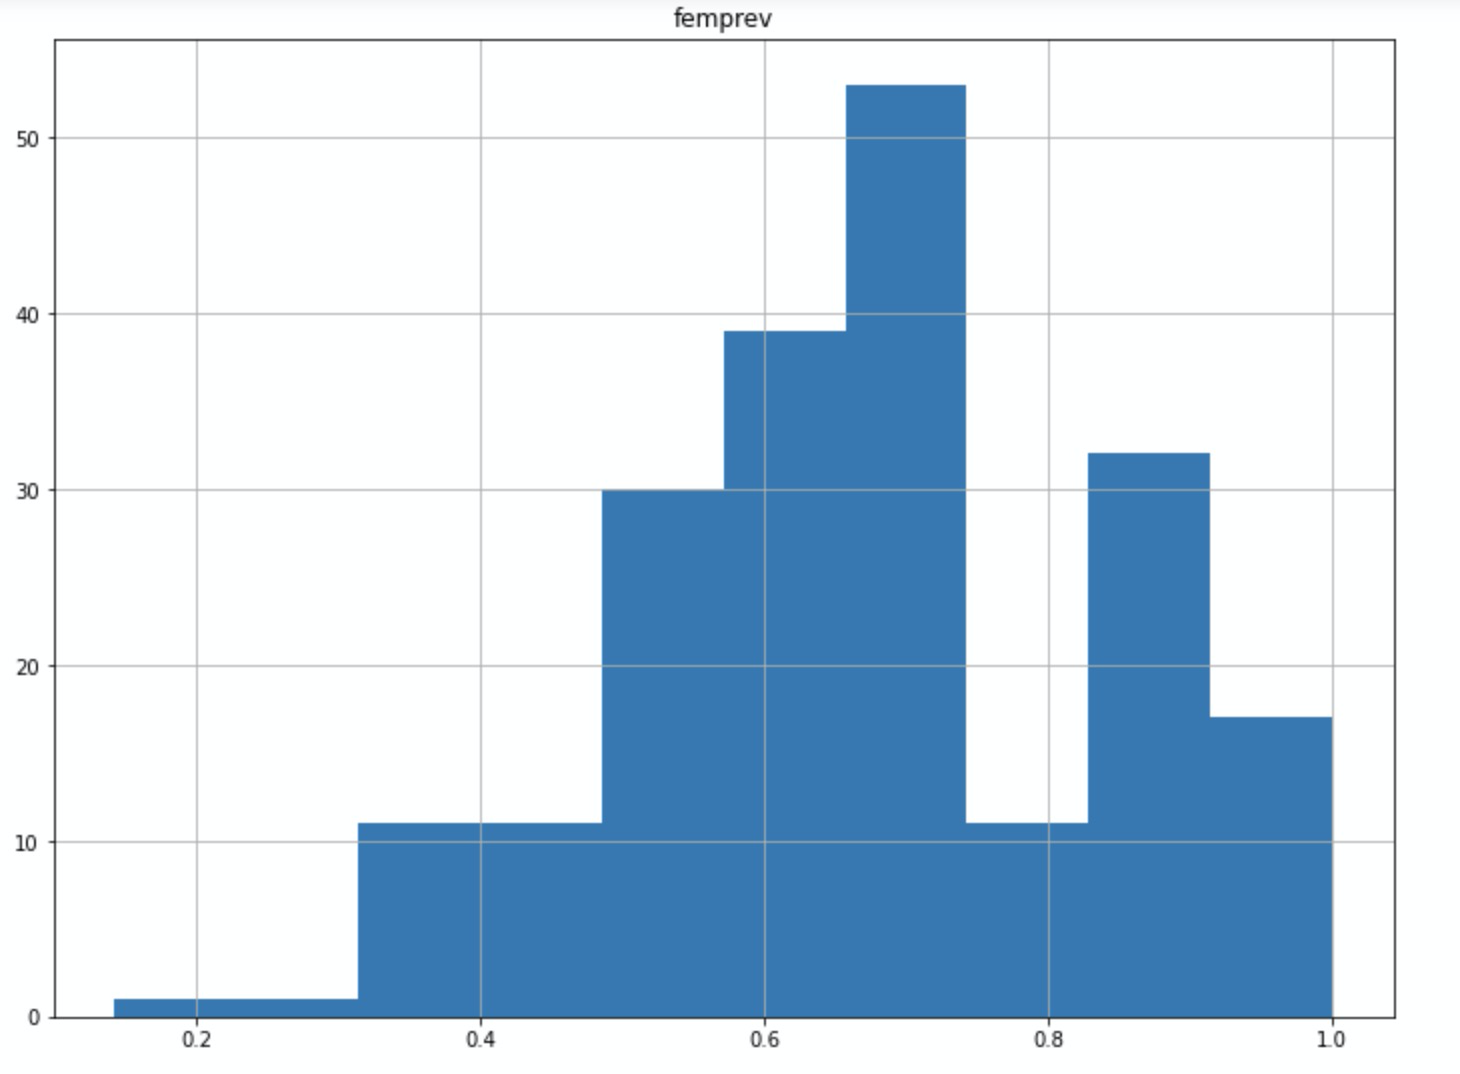
The average value of female_prevalence in the reduced network is 0.66. There are no “all-male” edges at all, while there are 15 all-female ones. We conclude that female informants made more of a contribution to this CCN than male ones. Maybe females agree with one another more, and contribute disproportionately to the broader edges in the network?
Below, I have redrawn the CCN. Edge color no longer codes for strength, but for female_prevalence, on a three-color scale:
More green => lower female_prevalence
More gray => female_prevalence around 0.5
More orange => higher female_prevalence
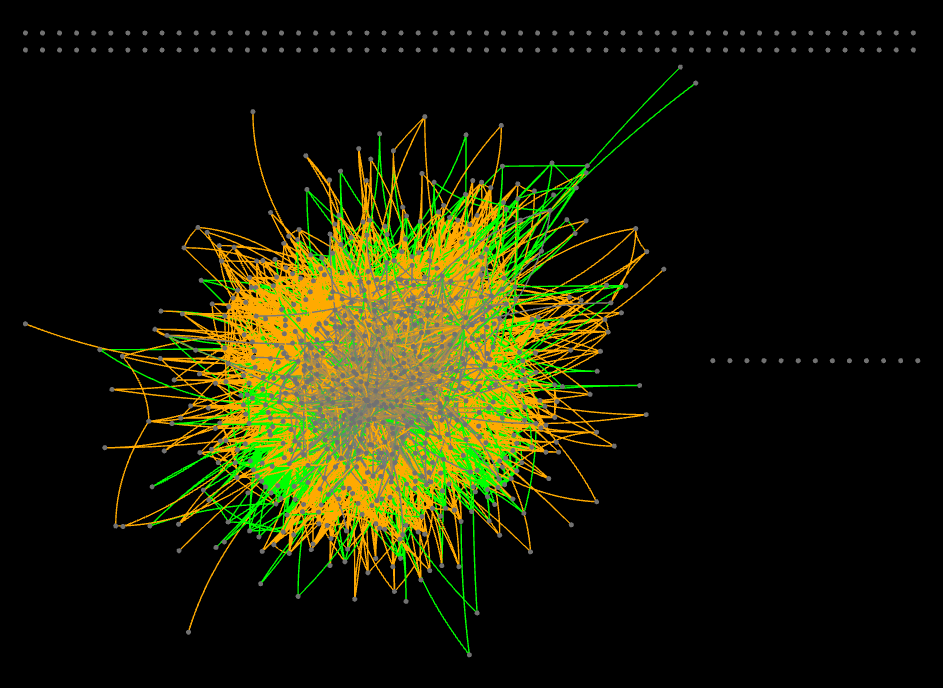
And this is the same Polish CCN, but filtered for b >= 6:
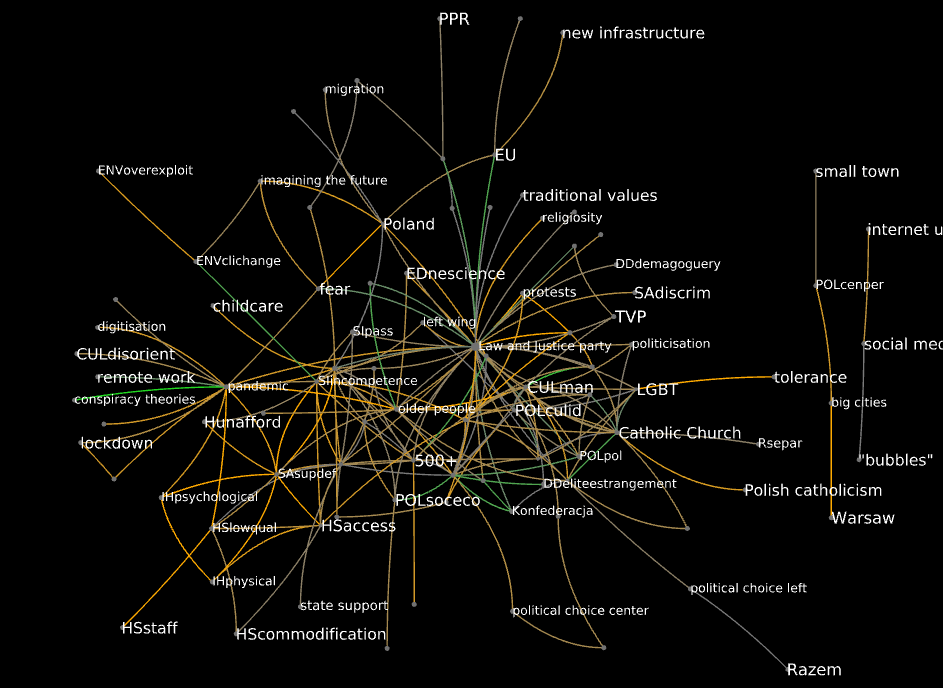
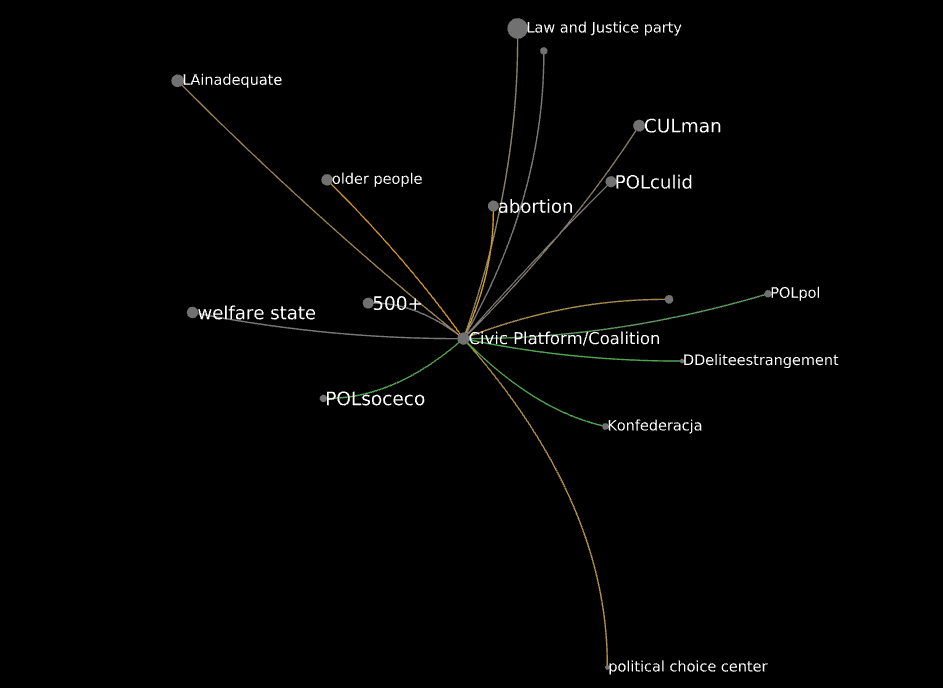
It can be interesting to explore this network to see which associations are predominantly made by informants of either gender. Consider the neighborhood of pandemic:

And that of civic platform/coalition:
Czech corpus
A look at female_prevalence
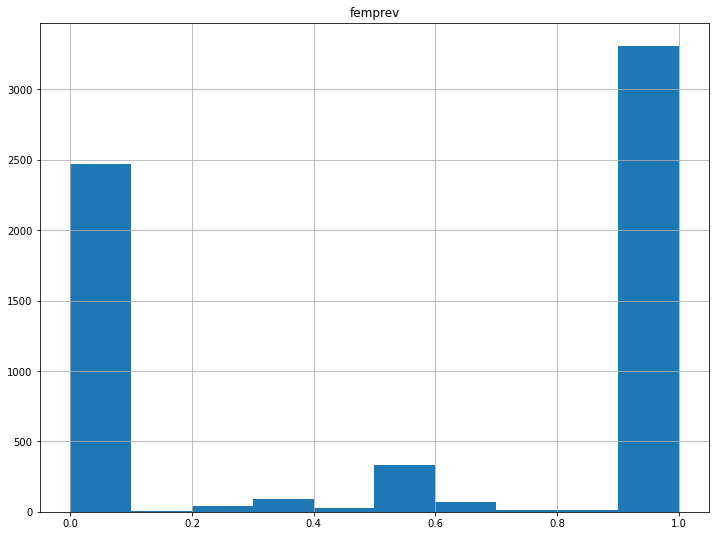
female_prevalence in this corpus has a mean value of 0.56, so close to gender balance. Here, too, it is uncorrelated with measures of edge strength.
The overall pattern is very similar to that in the Polish corpus. Frequency distribution for the whole corpus:
The broadest edges in the Czech corpus also skew female, but less so than in the Polish one. Frequency distribution for the reduced network (b >= 4, with 84 codes and 184 edges):
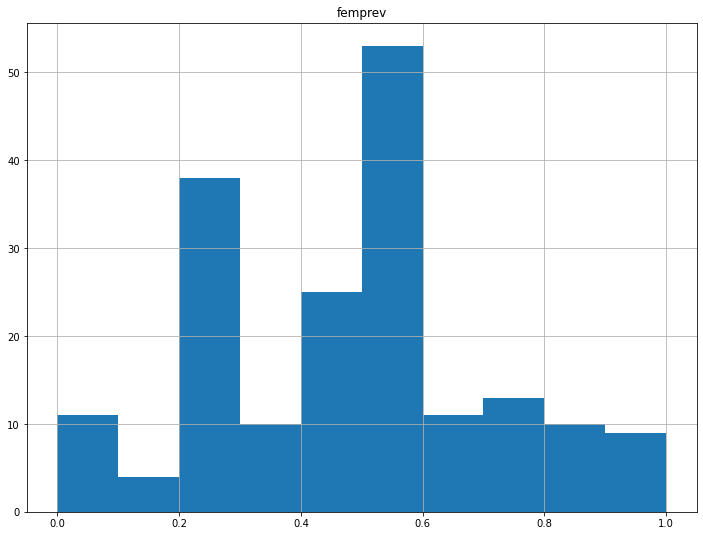
The average value of female_prevalence in the reduced network is 0.46, so very close to perfect balance. There are 11 “all-male” edges, and 9 all-female ones.
Drawing the reduced network for b >=4, there seems to be more separation:

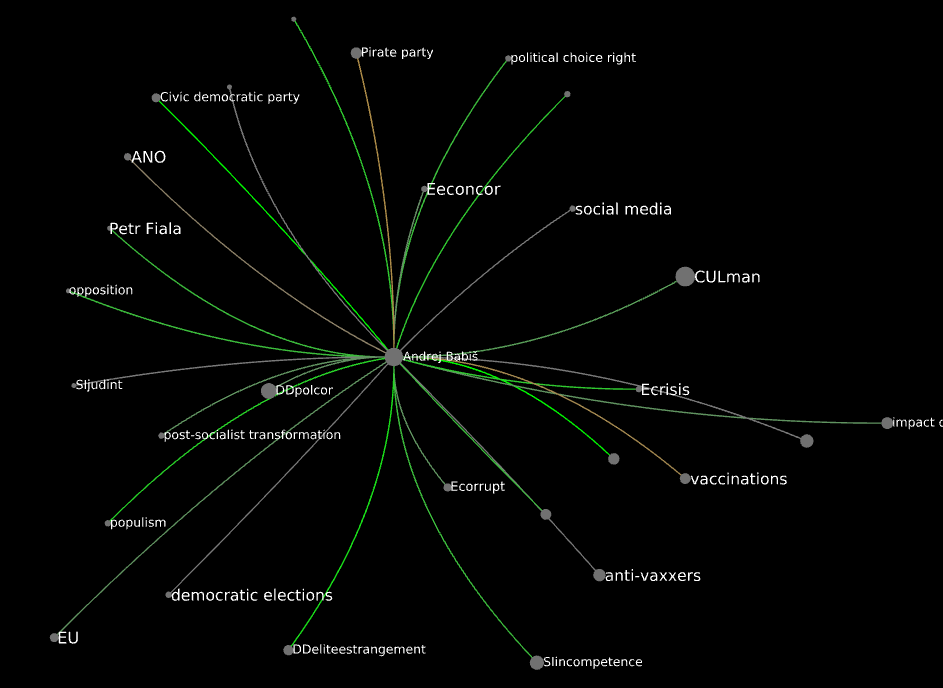
The center sees a larger prevalence of gender-balanced gray edges. To the west, male-heavy green edges prevail; to the east, it’s more female-heavy orange ones. Let’s see a few example of ego networks; here’s lockdown:
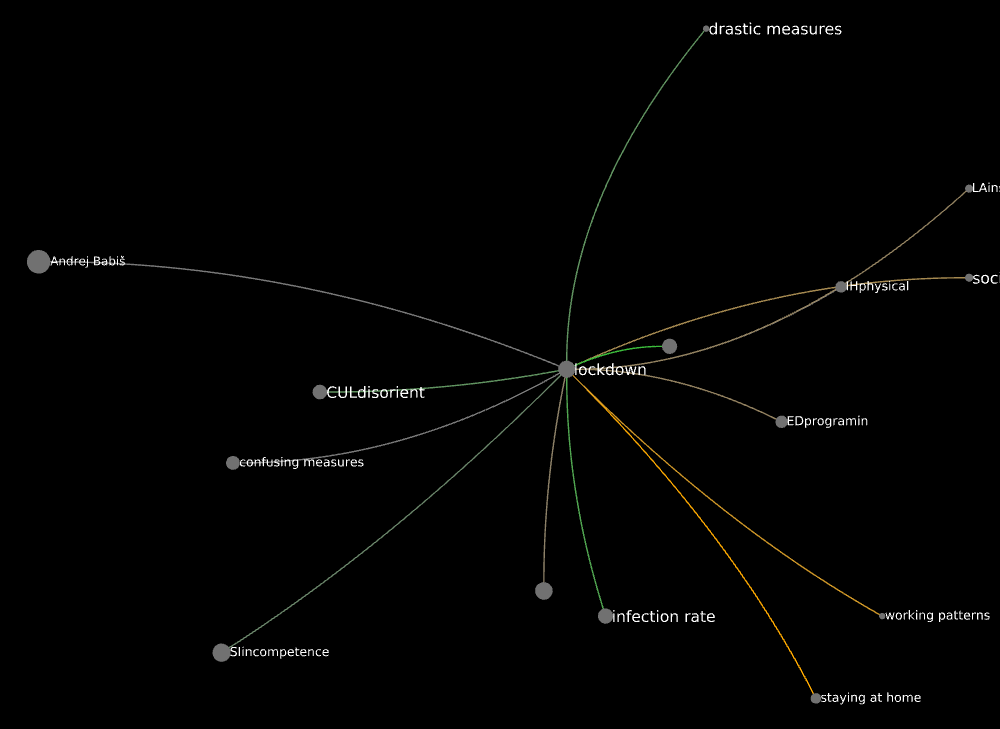
´DDpolcor`:

Andrej Babiš:
Some final questions
- Does this way of visualizing gender speak to you, @rebelethno? If so, would you like to see a different reduced network? The ego networks of other codes? Any other curiosity?
- If not, what it is that you would like to see? What are your research questions that involve gender, and how can we serve them by appropriate data analysis and visualzations?
