This thread is for coordination around the new experimental Graphryder and coordinating with collaborators. To not confuse this with the old codebase, we will call this experimental version “RyderEx” for the time being. In brief, the architecture of RyderEx is as follows:
Import
An import script connects directly to the Postgres database of any number of Discourse platforms with the Edgeryders OpenEthnographer extension and imports all conversational and ethnographic content from those platforms into a single Neo4j graph after scrubbing and redacting any protected, private or sensitive information from the data. This script, written by me, is more or less finished and works as expected. Importing new data and rebuilding the entire graph from scratch takes less than two minutes, and is intended to be done every night once it has been deployed live.
Database
Data from edgeryders.eu, bbu.world and forum.blivande.com are now live on a staging Neo4j database, which can be reached here: neo4j@bolt://graphryder.edgeryders.eu:7496. There is a password that can be given on request, as this database only contains data that is already public on these platforms.
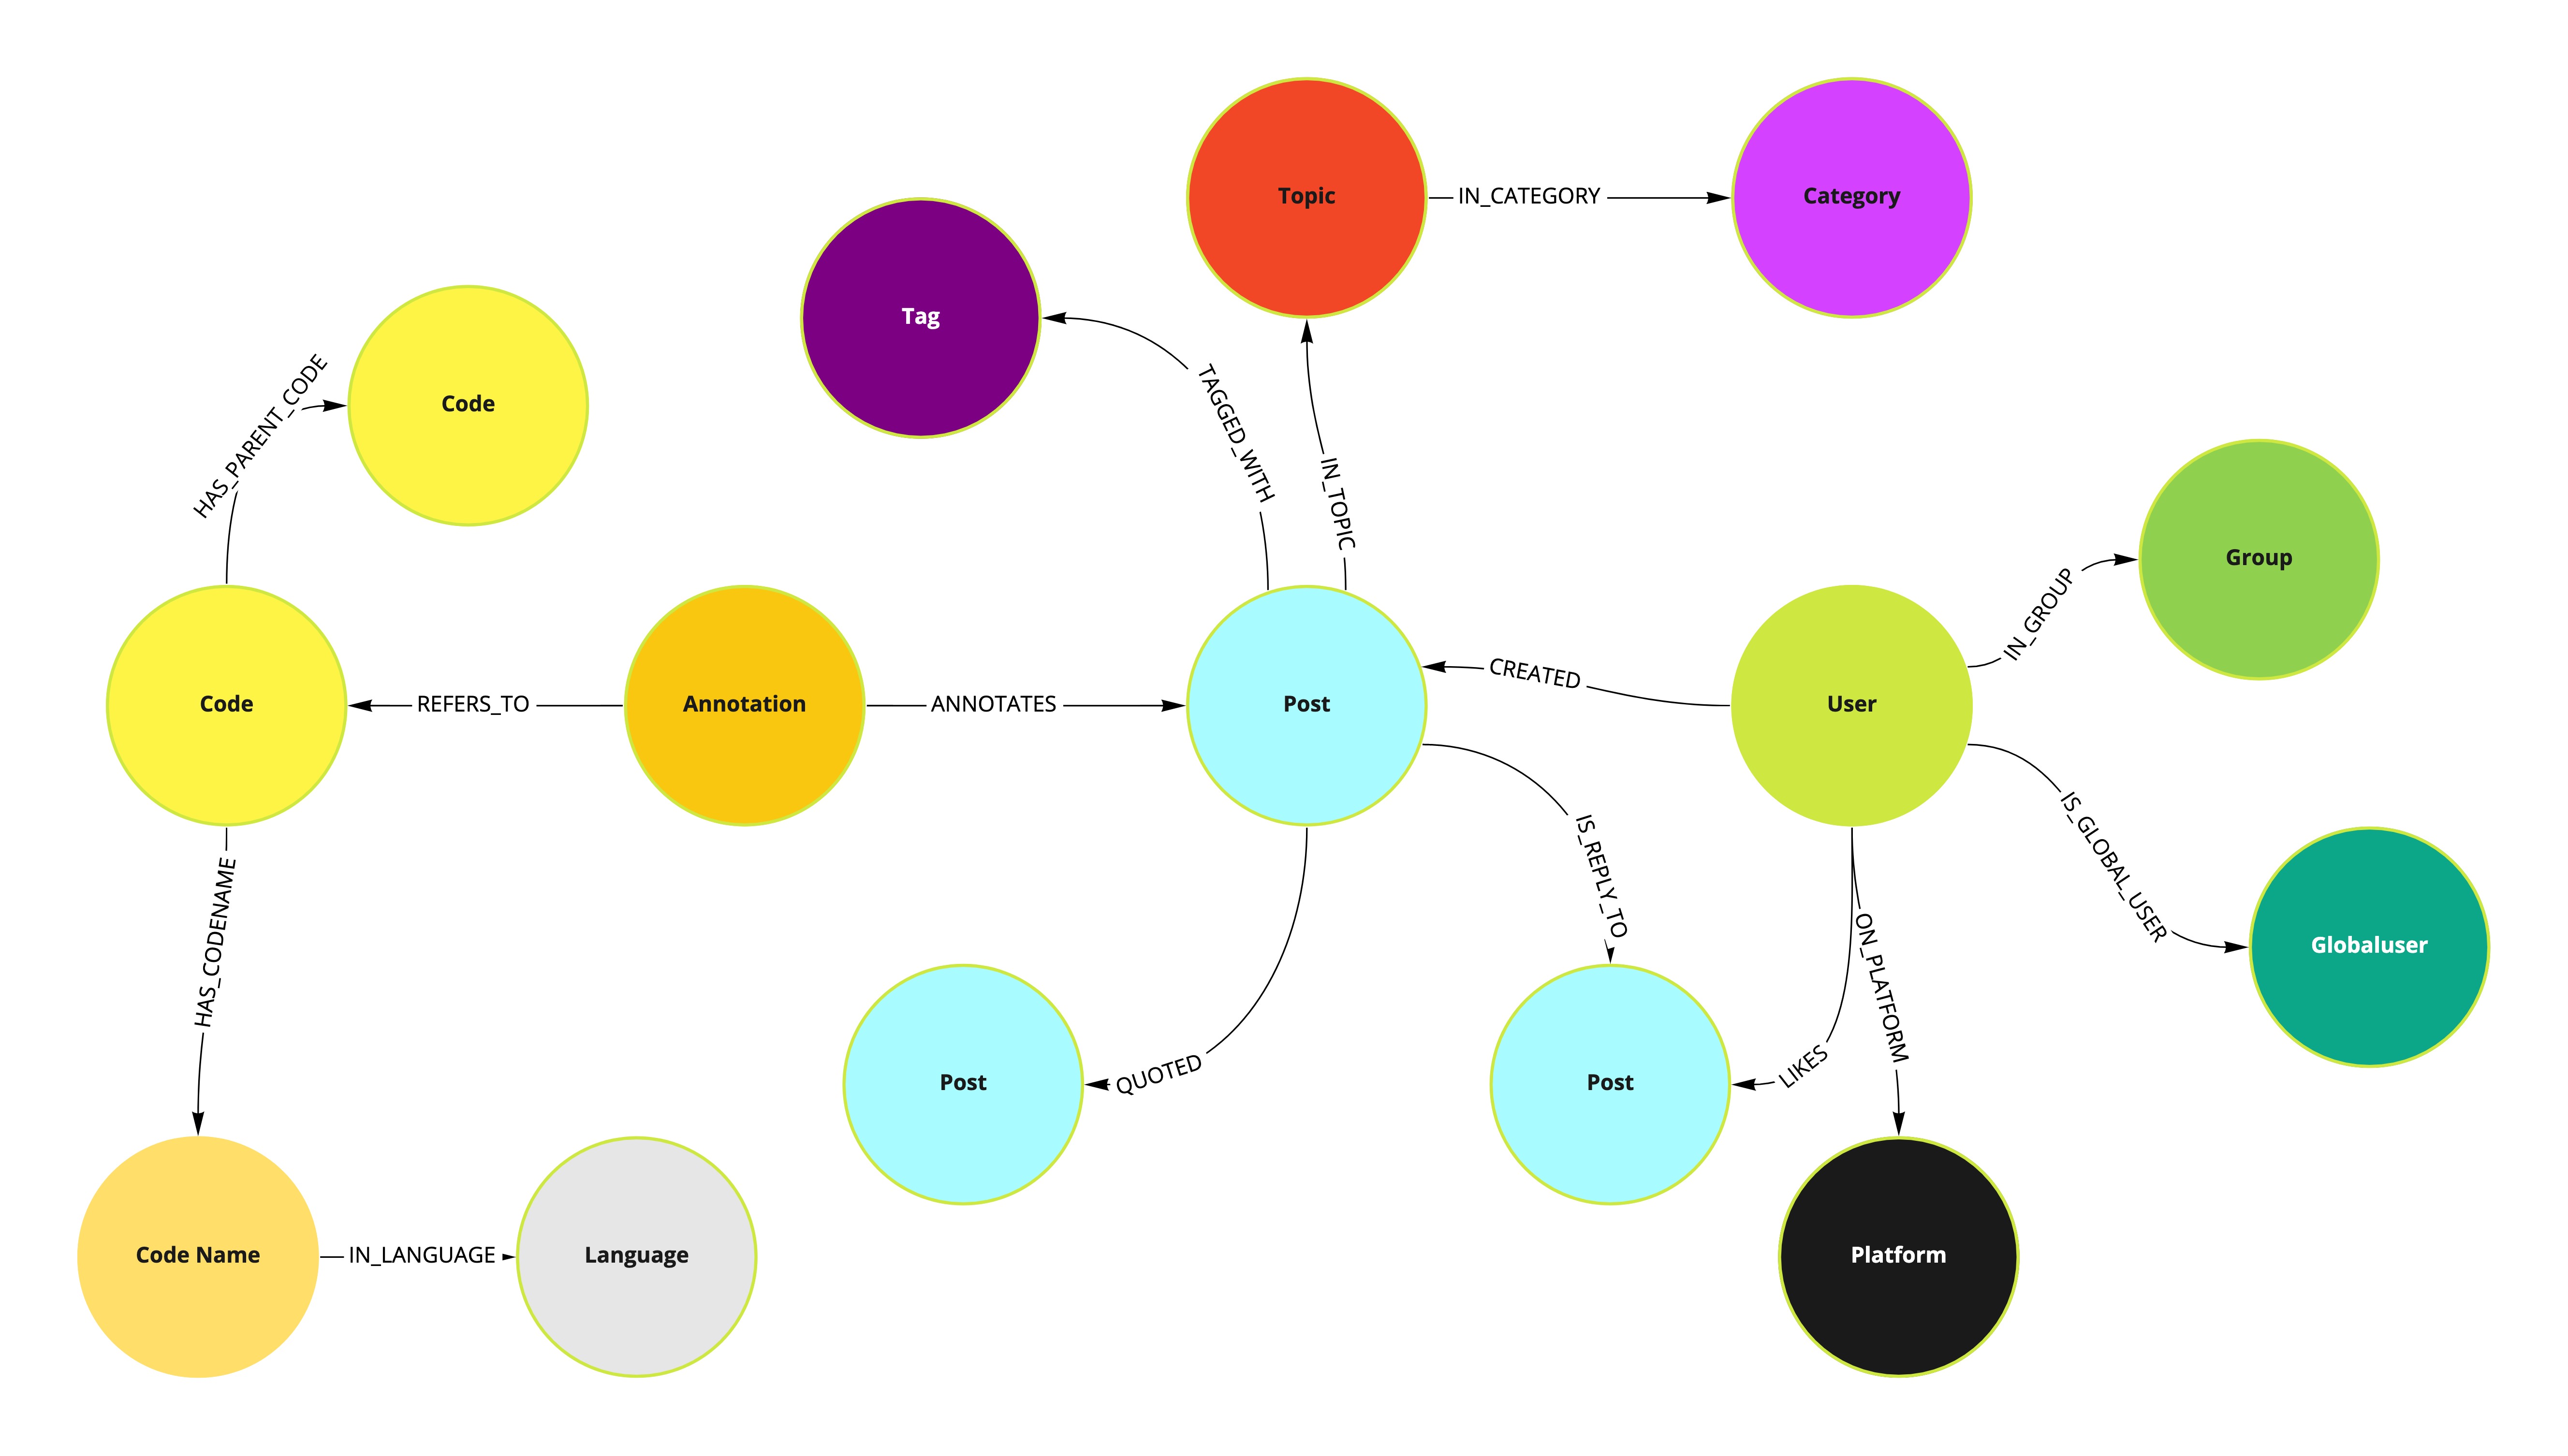
These nodes and primary data relationships that are available in the datamodel:
There are more relationships that are not shown here, but those are redundant relationships that are kept to either make the code less complicated or to make queries faster.
GraphQL API
I have started working on a GraphQL API in the same GitHub repo to access the graph from Neo4j. This is still barely working, and most of the resolvers and connectors are missing. This is what I think we should use to send data to the various clients we will build. GraphQL and Apollo are not technologies I am very used to coding with myself, so I will be looking for support on finishing the GraphQL API more efficiently.
Dashboard with Sigma and Graphology
I would like to start experimenting with building a new dashboard with Sigma and Graphology. My preferred way of working would be to contract someone with expertise in these technologies to build the framework and some functional examples based on our wireframes, and we can then continue according to their template.
Since we don’t know yet exactly how the new Graphryder should look and what it should do, we will be working to create a basic and modular framework that can easily be adapted when we come up with new modules.
Wireframes
These wireframes outline features of the experimental RyderEx, which will be the foundational functional prototype and proof of concept for the new Graphryder.
We are going to build a simple dashboard using three components that share a datamodel.
Component 1: Select platform and corpus
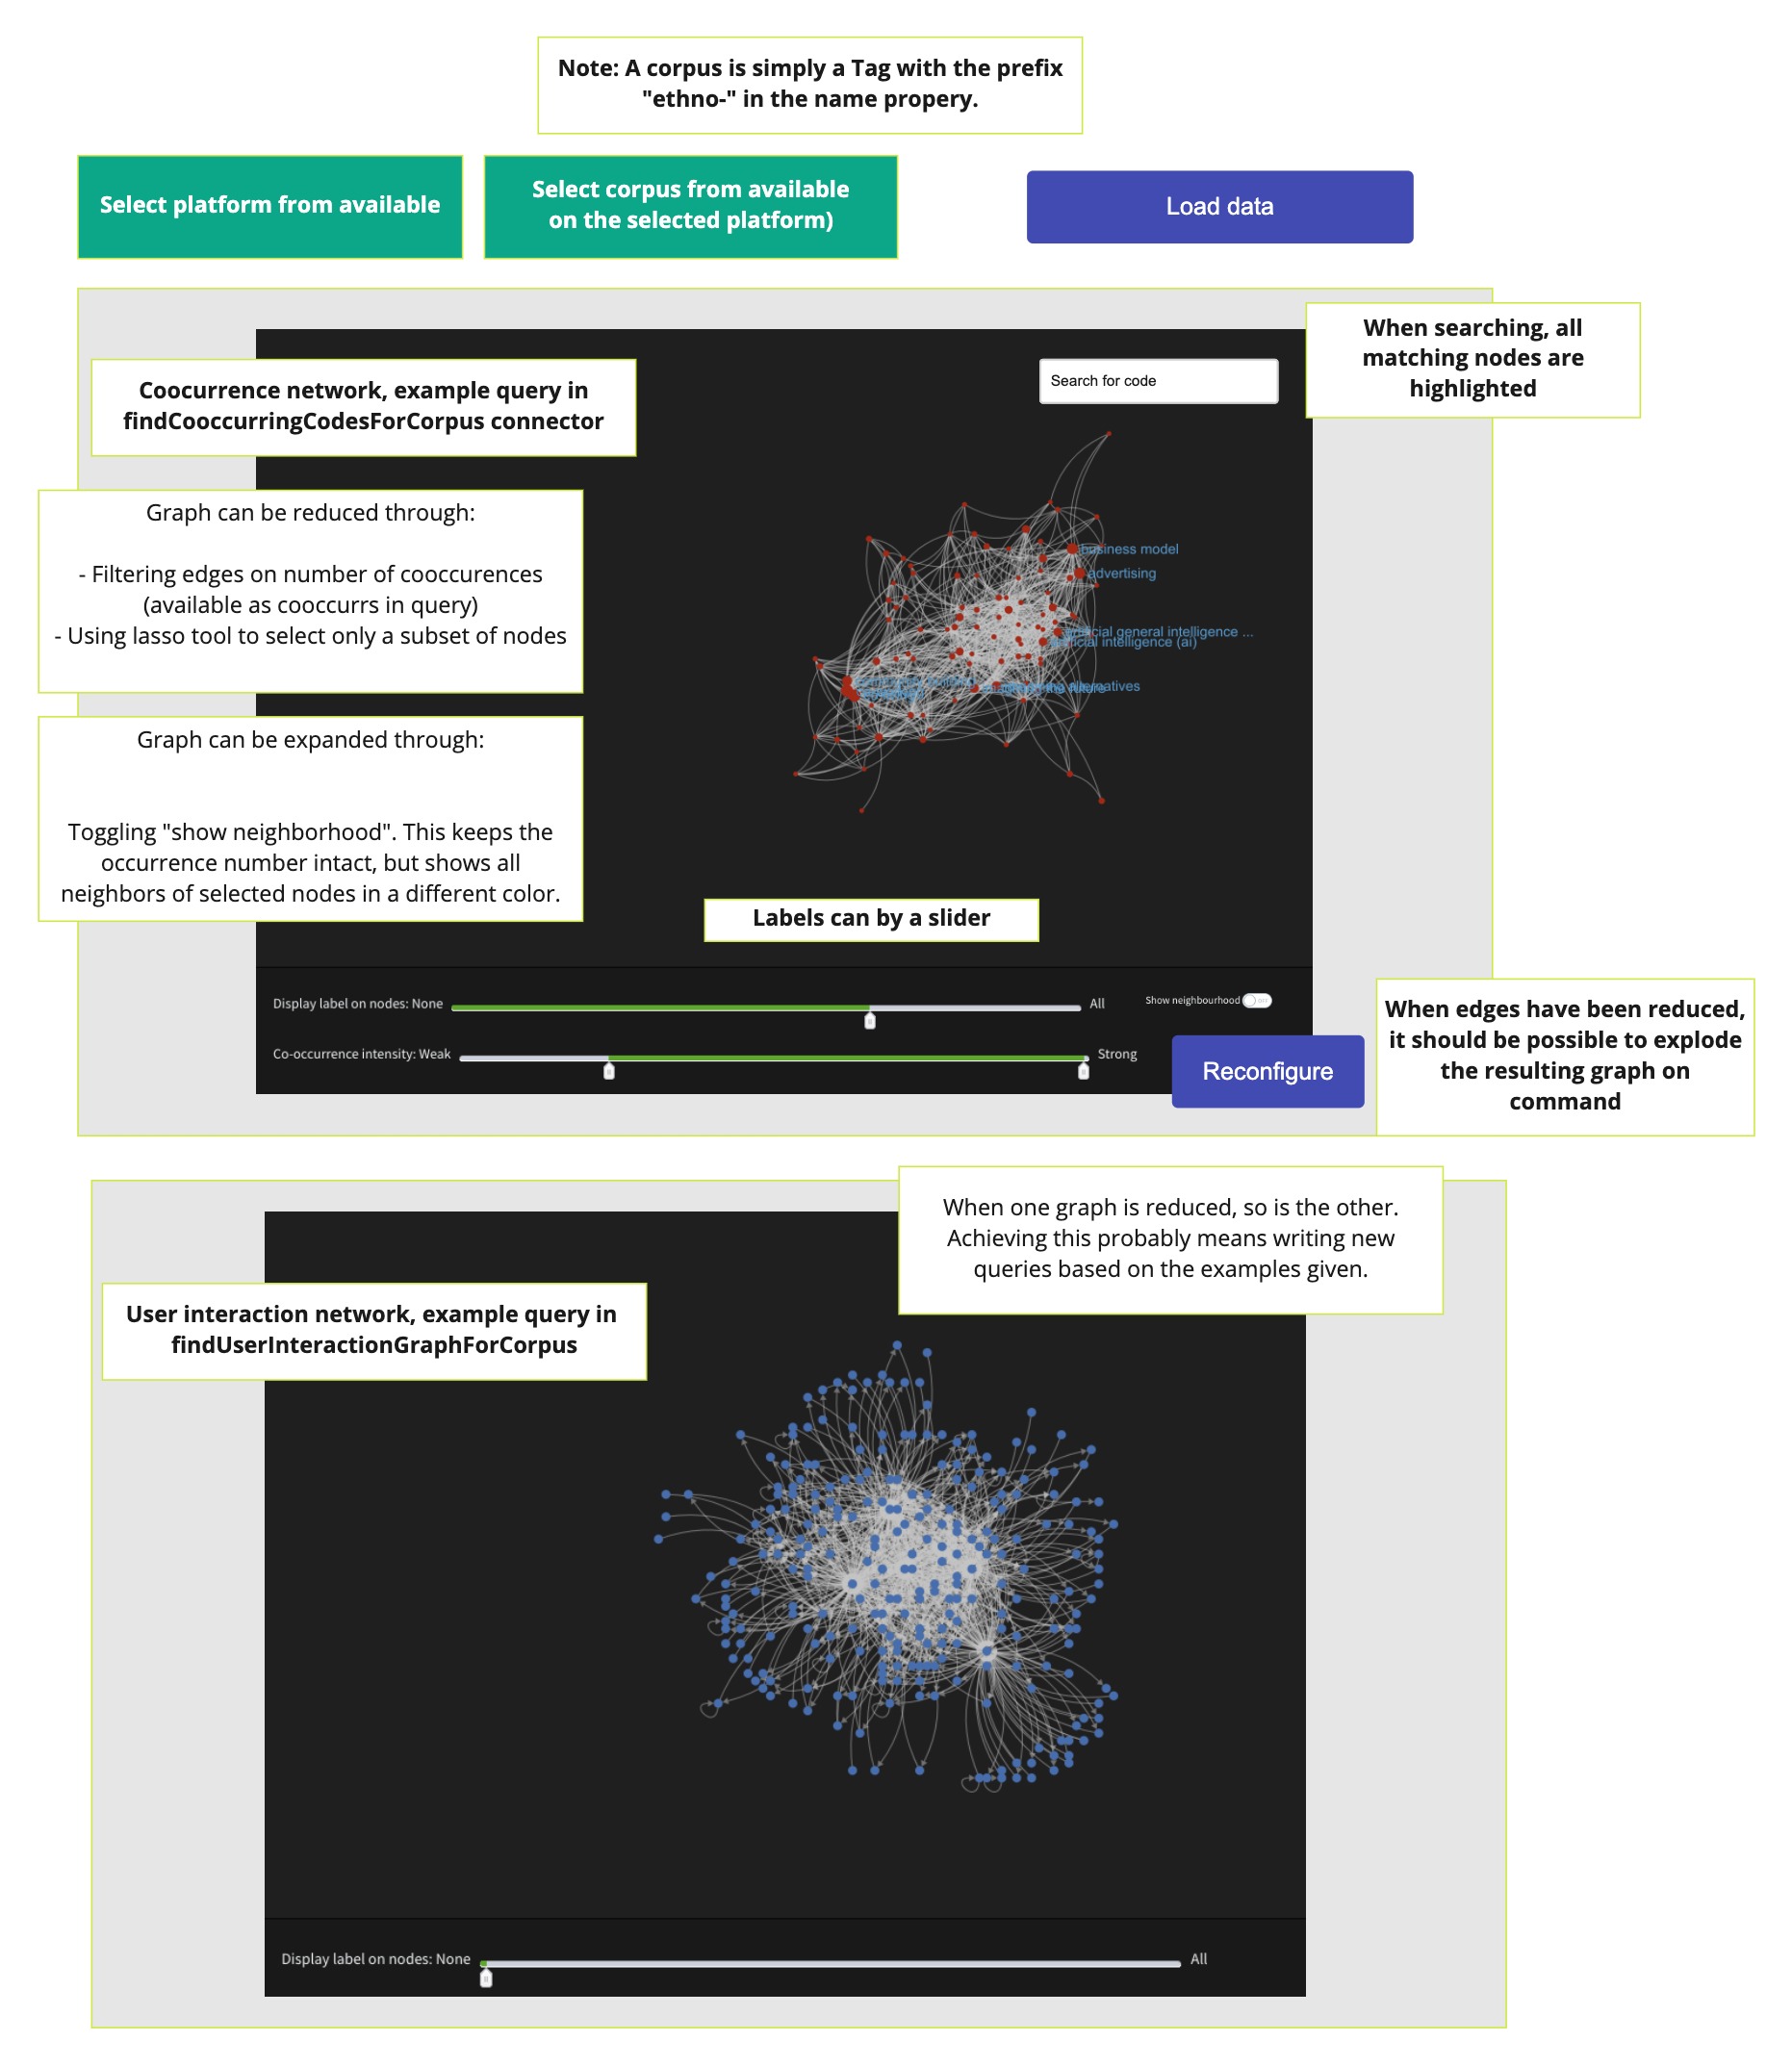
Component 2: Show cooccurrence graph for selection
Component 3: Show user interaction graph for selection
Components share the same data and when one is manipulated that also update the other components. Functionally, we want to achieve the same thing as on the old Graphryder Detangler view. However, in the first iteration, we are not concerned with exploring the content by clicking on nodes and relations. I am confident that this will be reasonably trivial to add later.
We should build the RyderEx prototype in such a way that we could add other components that manipulate the same data in some other way. For example, a third component that dynamically shows a list of posts with the selected subset of ethnographic codes. We might also want to look at other graphs for the same subset of posts - for example a graph that shows the different topics and their connected posts. These things are all possible with the old Graphryder through server side rendering, and one main point of inquiry with RyderEx is to understand how we could do the graph manipulation client side with Graphology.
The next step is to plan a two-hour session in the next couple of weeks where we make a list of principle features that we want the new Graphryder to have. This will help us develop the prototype more efficiently and shorten the distance between RyderEx and Graphryder 2.
For this meeting, I need @alberto, @amelia, @MariaEuler. We will schedule a time that works for the four of us. It would also be valuable to get input from @matthias, @noemi, @nadia, @marina as well as from more ethnographers from your team @amelia - but to simplify scheduling this will be according to availability at the chosen time.
Our 10-2 project team calls are on Tuesdays from 13:30 to 15:00, so that won’t work – but any other day that week or next should be fine (or a different time on Tues).
I would very much like that! I should clarify that there are many more people who I would like to have join the session - I just don’t want to take up people’s time if they don’t want to.
I need @amelia and @alberto as they are the main research leads in ResNet, and I want @MariaEuler as an example of an end-user of Graphryder who was not around when it was first conceived and who uses it for community management rather than research.
This wiki-post will act as a collection of the principles for RyderEx.
Principles for RyderEx
Data model and interoperability
All nodes in the browser graph are 1 to 1 representations of nodes in the Neo4j graph.
Edges in the browser graphs can either be 1 to 1 representations of Neo4j relationships (like the IS_IN_TOPIC edge between a post and a topic) or calculated (like the COOCURRS between two tags, calculated for a certain subset of posts).
Graph perspectives can share the same data model. If multiple perspectives are displayed at the same time, like a user interaction graph and a code cooccurence graph, a change in one perspective must allow an update in another perspective.
We want to be able to access the data model from other components in the same web app, for example getting a list of currently selected codes in a cooccurrence graph and the subset of posts associated with those cooccurring codes. With the post ids of those posts, we can then load their content from the endpoint and display summaries directly in the app, for example in a panel below the graph.
Posts
Posts are the most important nodes in our data model. All perspectives look at the data in the context of a filtered subset of posts.
The set of post nodes are reduced first by which platform they belong to. Since this is so central, this information is available both as a ON_PLATFORM relation between the post and a platform, as well as through a “platform” property on each post node. This is true for all node types, except the “globaluser” nodes, which link the user accounts of different platforms.
The second step to reduce the set of posts is by the TAGGED_WITH relation to a “corpus” node. The corpus label is a secondary label of some “tag” nodes.
Choosing multiple corpora at the same time should be possible.
The software should allow for other reductions of the post set to be implemented in the future, either instead of the reduction by corpus, or in combination with it. Other such reductions could include:
Reducing by tag. This is just a more general version of reduction by corpus, using all “tag” labeled nodes instead of just the “corpus” labeled nodes.
Reducing by forum category. This means choosing only posts in topics in one or multiple categories. Categories have an IN_CATEGORY relation to topics, and topics have an IN_TOPIC relation to posts.
Reducing by users. This could mean selecting only posts created by one or multiple users.
Codes
A cooccurence graph should be calculated for a chosen subset of posts, and COOCURRS edges should be generated between code nodes that have been applied through annotations of those posts.
Each COOCURRS edge should have a “count” property of how often the codes have coocurred within the subset of posts.
As cooccurence graphs can be extremely dense, they need to be reduced to be human-readable. Further, there are a number of meaningful reductions that help us interpret the concurrence network.
A code cooccurrence graph should be reducible by language. Each code has a relation to a codename node, and each codename has a relation to a language node. It should be possible to see only the concurrence network for codes that have codenames in one or multiple languages.
There are different definitions of coocurence counts, and it should be possible in the future to calculate and choose between different concurrence graphs for the same set of posts. For example though coocurrence counted by the number of unique authors of the posts that have been coded both with code1 and code2.
Furthermore, there might be completely different viable ways to reduce the co-occurence network - like “k-core decomposition” or “Simmelian backbone”. While these are not of immediate concern, it would be useful to have an architecture where applying such reductions in the future is not more complicated than writing the right algorithm and including it in the codebase.
Users
Todo: Enable ethnographer focused perspectives, through CREATED and USED relations.
User experience
It should be possible to drag and drop nodes around the graph to create manual configurations during exploration of the graph
All states must be persistent and reproducible, meaning that a configuration (choice of platform, corpus, filtering, and graph reduction) should be saved in the URL and reachable through a link.
Alright, 13:00 on Monday the 18th it is. Let’s hope we can make it.
It might not need to be 2 hours if we do some asynchronous work in this thread first, following the same format as in my post above.
After catching up with @jacomyal it became clear that we need to define some more detailed user stories for RyderEx before we begin.
How this dashboard will be used
Most importantly, we will use this dashboard to conduct our research. An example of our research can be seen here:
Furthermore, we wish to start using our graphs to engage the participants of our various forums. We think it could be a novel and engaging way to interact with an online conversation to explore it through filtering interesting concepts through graphs in an interactive dashboard. This use case is however secondary to using the dashboard as a tool for researchers.
Compared to our current dashboard, the new RyderEx version will offer a number of improvements:
Access to all datasets through a single API and dashboard, instead of the current version that needs a new database, API, and dashboard for each dataset.
A more modular design that allows for more use-cases without overwhelming new users.
A more modern tech-stack that is easier to build on for future improvements.
Improved performance through relying on recent advances in client-side graph processing, thus avoiding the slow and heavy-duty server-side graph processing of the old version.
Persistent states, allowing users to save a link that navigates to a particular state. An example could be to show the co-coucurrence graph filtered to ≥4 co-occurences and a list of the posts that those codes co-occur in from the ethno-ngi corpus on the edgeryders.eu platform.
Data model
To reiterate, the data model looks like this. All of the data needed is available in a single Neo4j database. Data from the different platforms available to RyderEx are imported by adding to the configuration of the RyderEx API. Corpora are simply defined through looking for topics tagged with a Discourse tag that starts with the prefix “ethno-”.
RyderEx will allow you to explore content by filtering by:
Platfom
Corpus
Topics
Posts
Codes
Participants
Compared to the old Graphryder dashboard there is one major difference in how data flows. In Graphryder, the Detangler view allowed you to filter on participants and codes with a two-way data binding. This was an interesting idea, but pretty confusing to most users who were not very familiar with the software. In RyderEx, data is filtered through the components in sequence. You start by filtering by platform and corpus and then choose the next component. You can then add subsequent components, but components added later in the sequence only show and pass on the filtered data passed by the selection in the previous component. The user can add and remove these components in any sequence they choose, but they must decide if they are going to start by filtering by participants or by codes.
For most users, this will make the software more intuitive, as this is how filtering usually works.
User stories
Case 1: Load data from Edgeryders ethno-poprebel annotated conversation and explore by code co-occurrence
Why?
Code co-occurrence means that two ethnographic “codes” (like “resource consumption” or “climate change”) have been used to annotate the same post. We use code co-occurrence to build “Semantic Social Network” graphs. These are then used to understand a conversation and community, either in research or by that community itself to gain a birds-eye view of their conversations. These semantic social networks are the most important feature of this dashboard and a vital deliverable in many Edgeryders research projects.
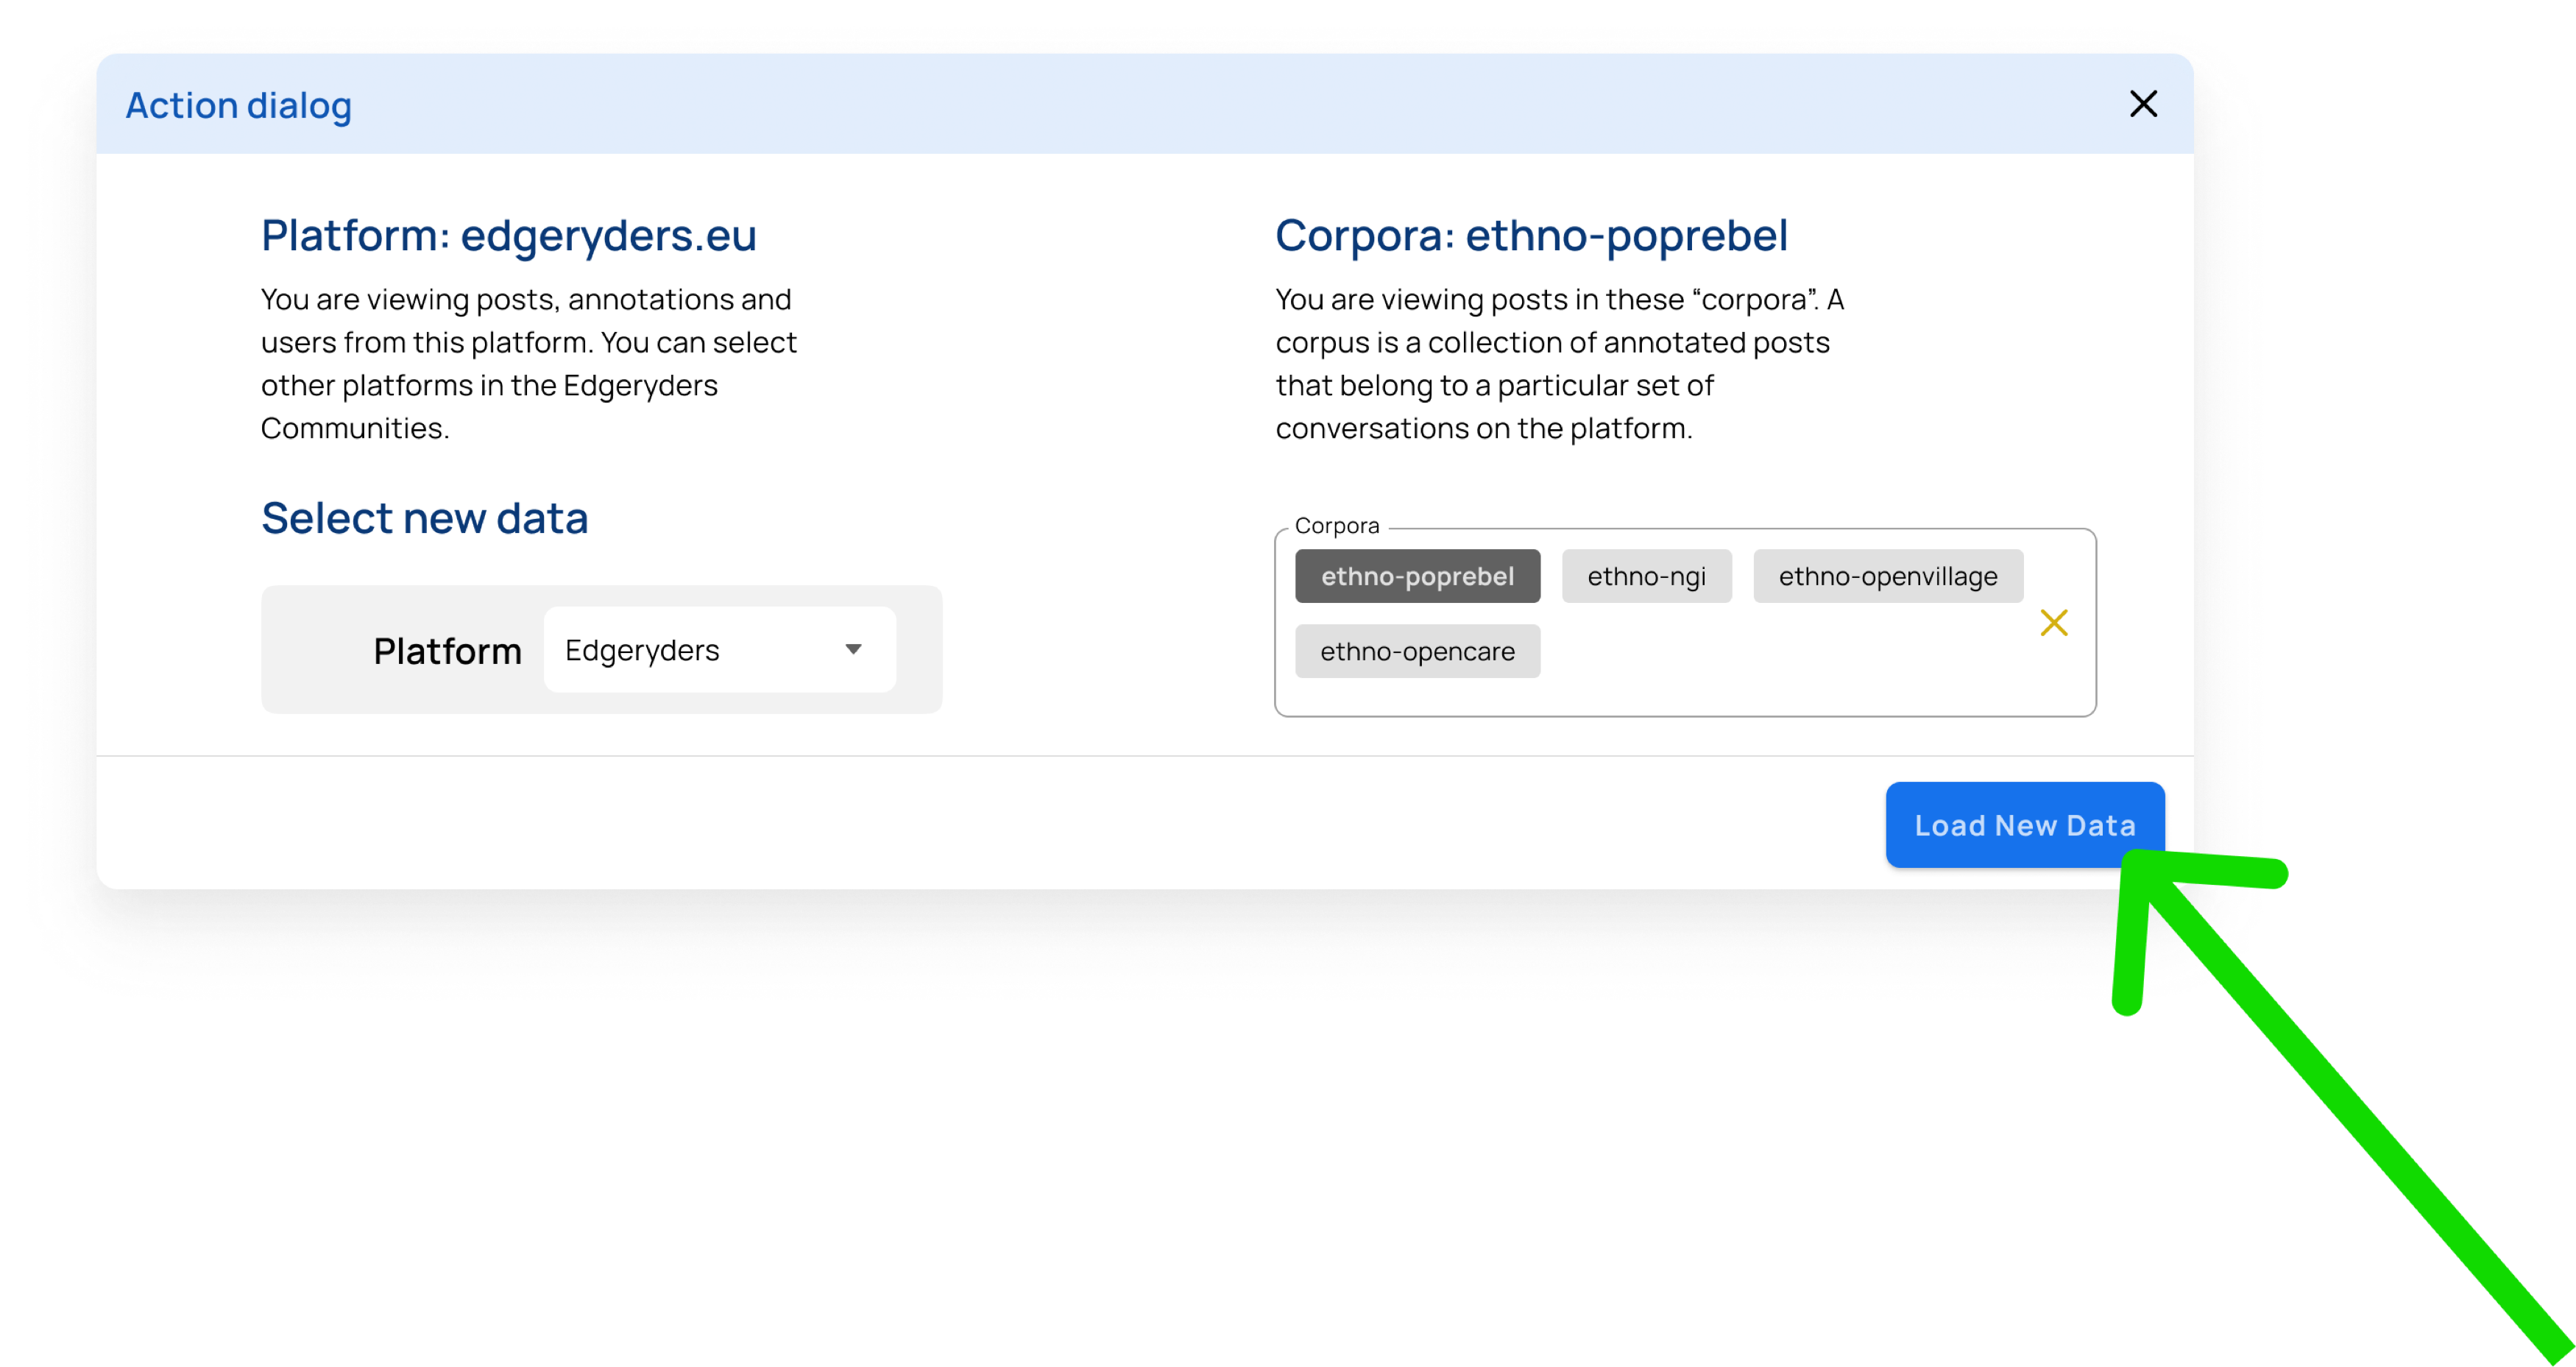
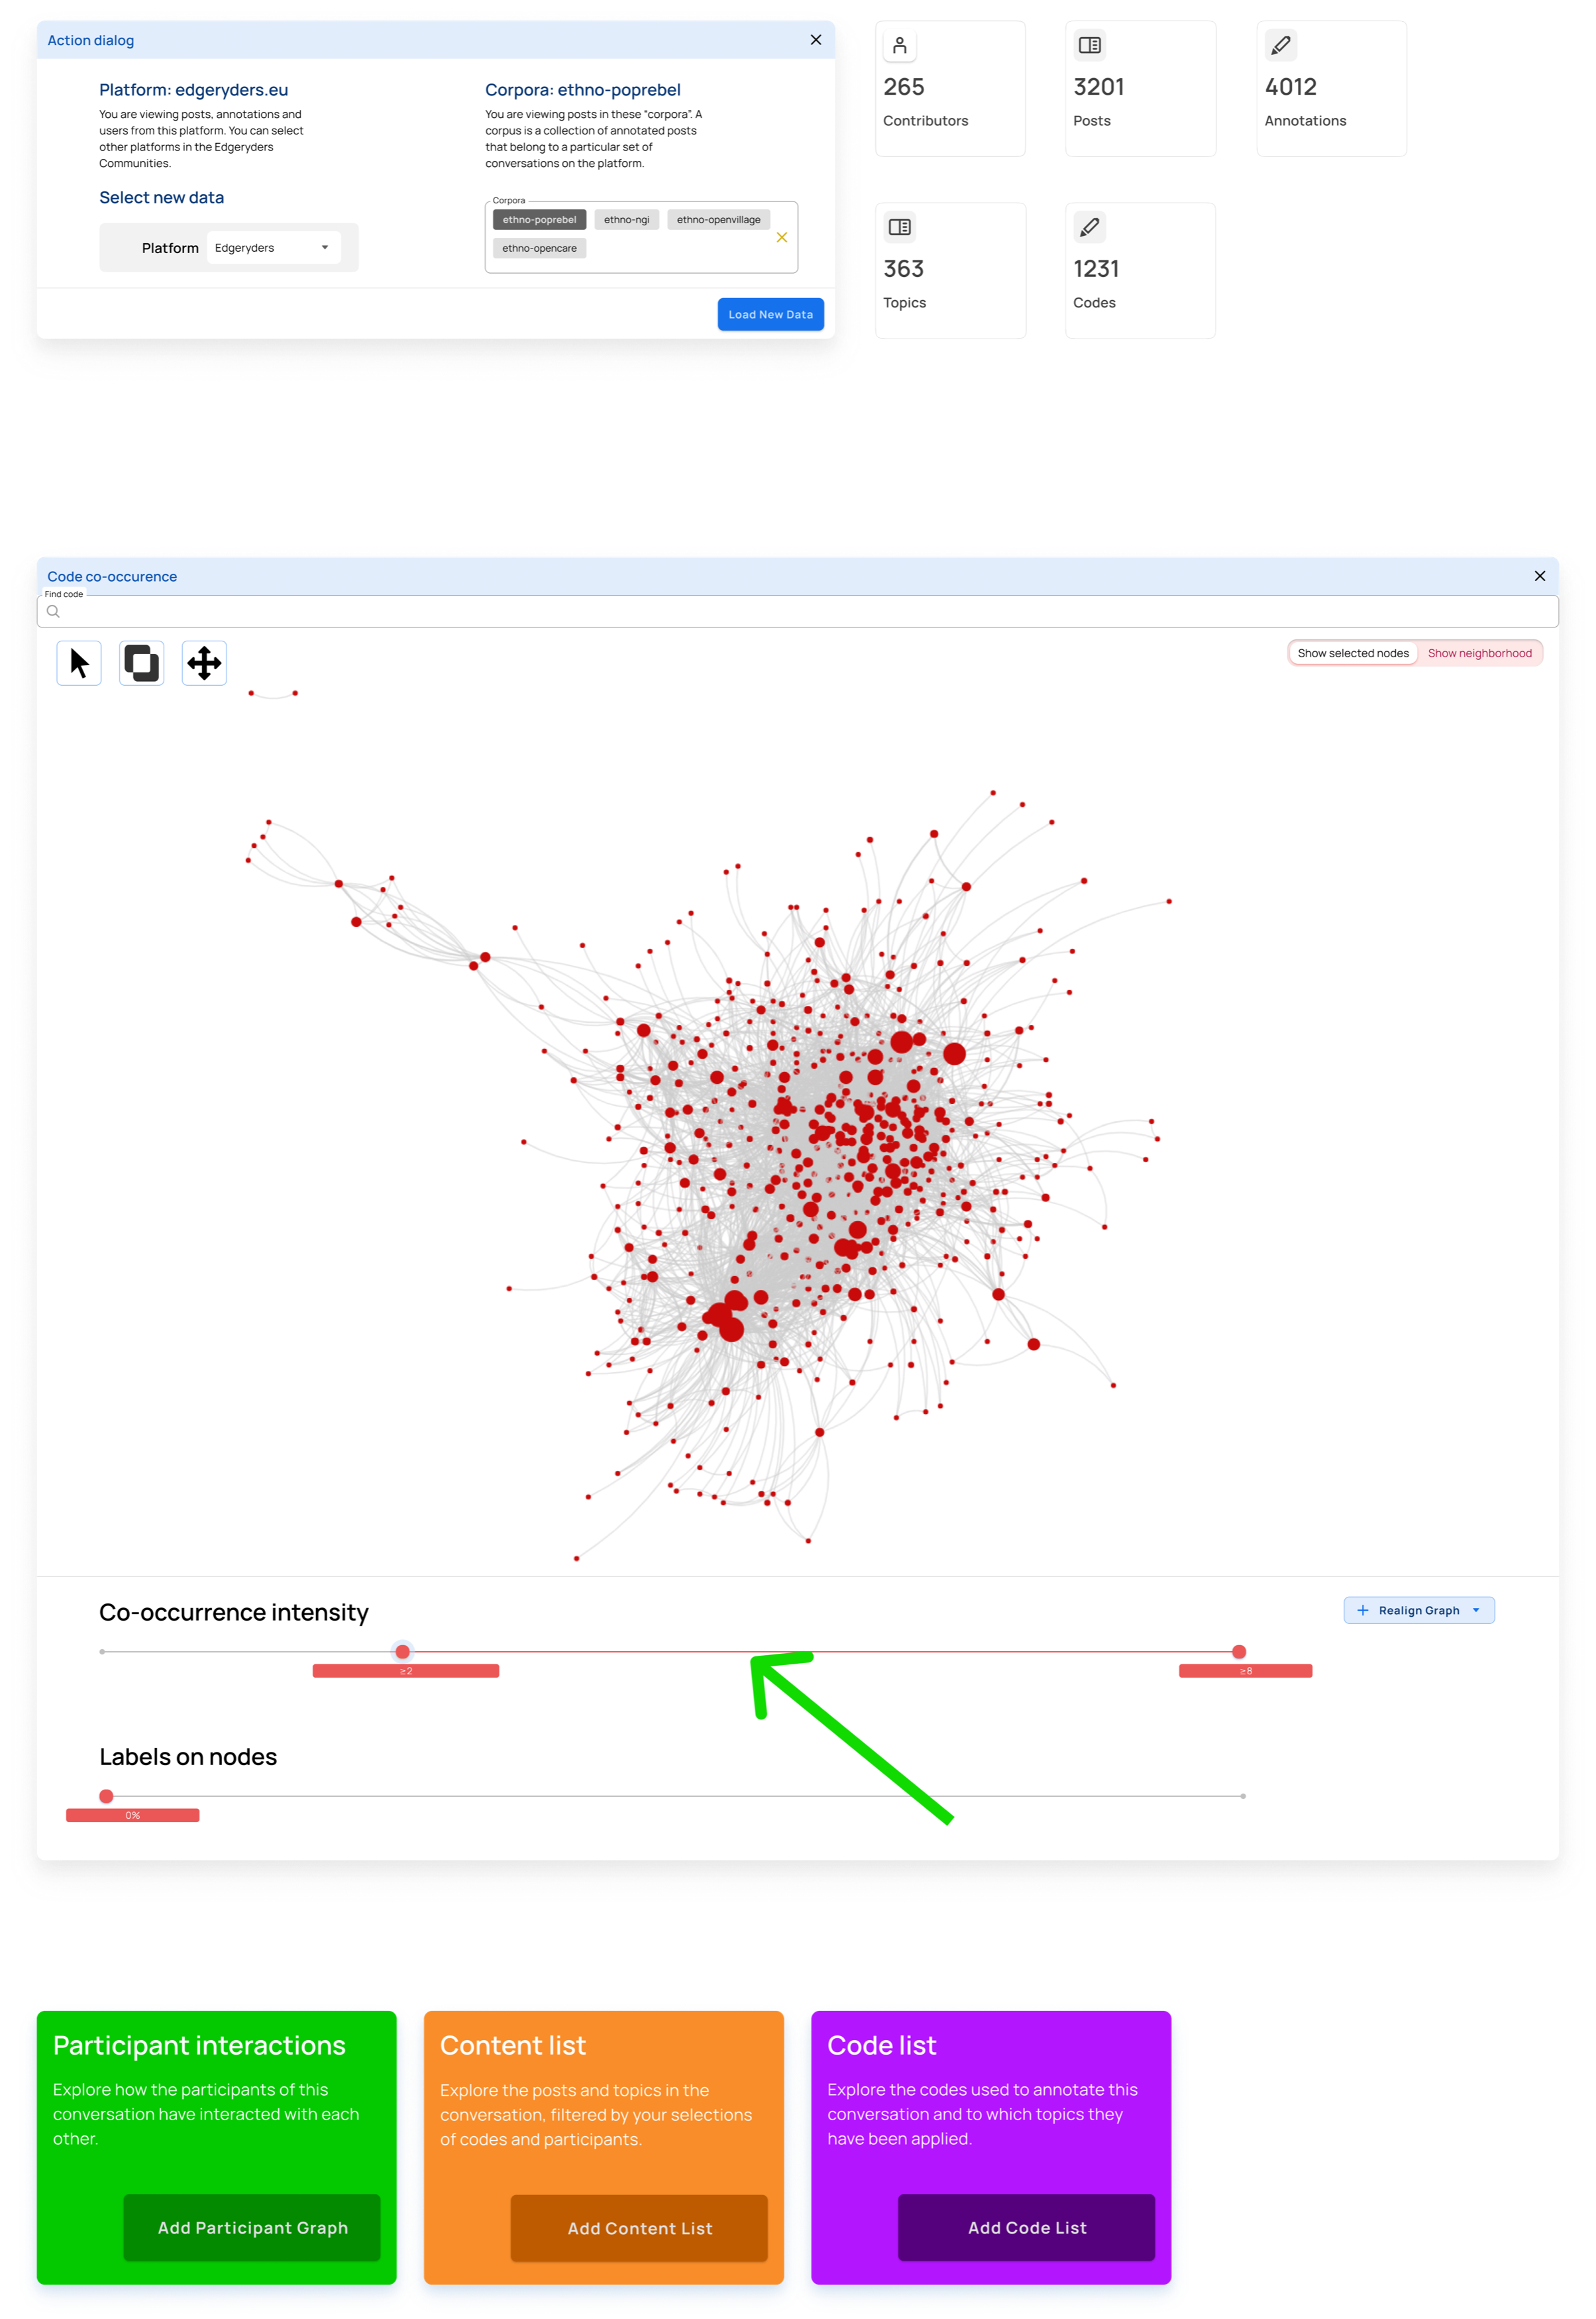
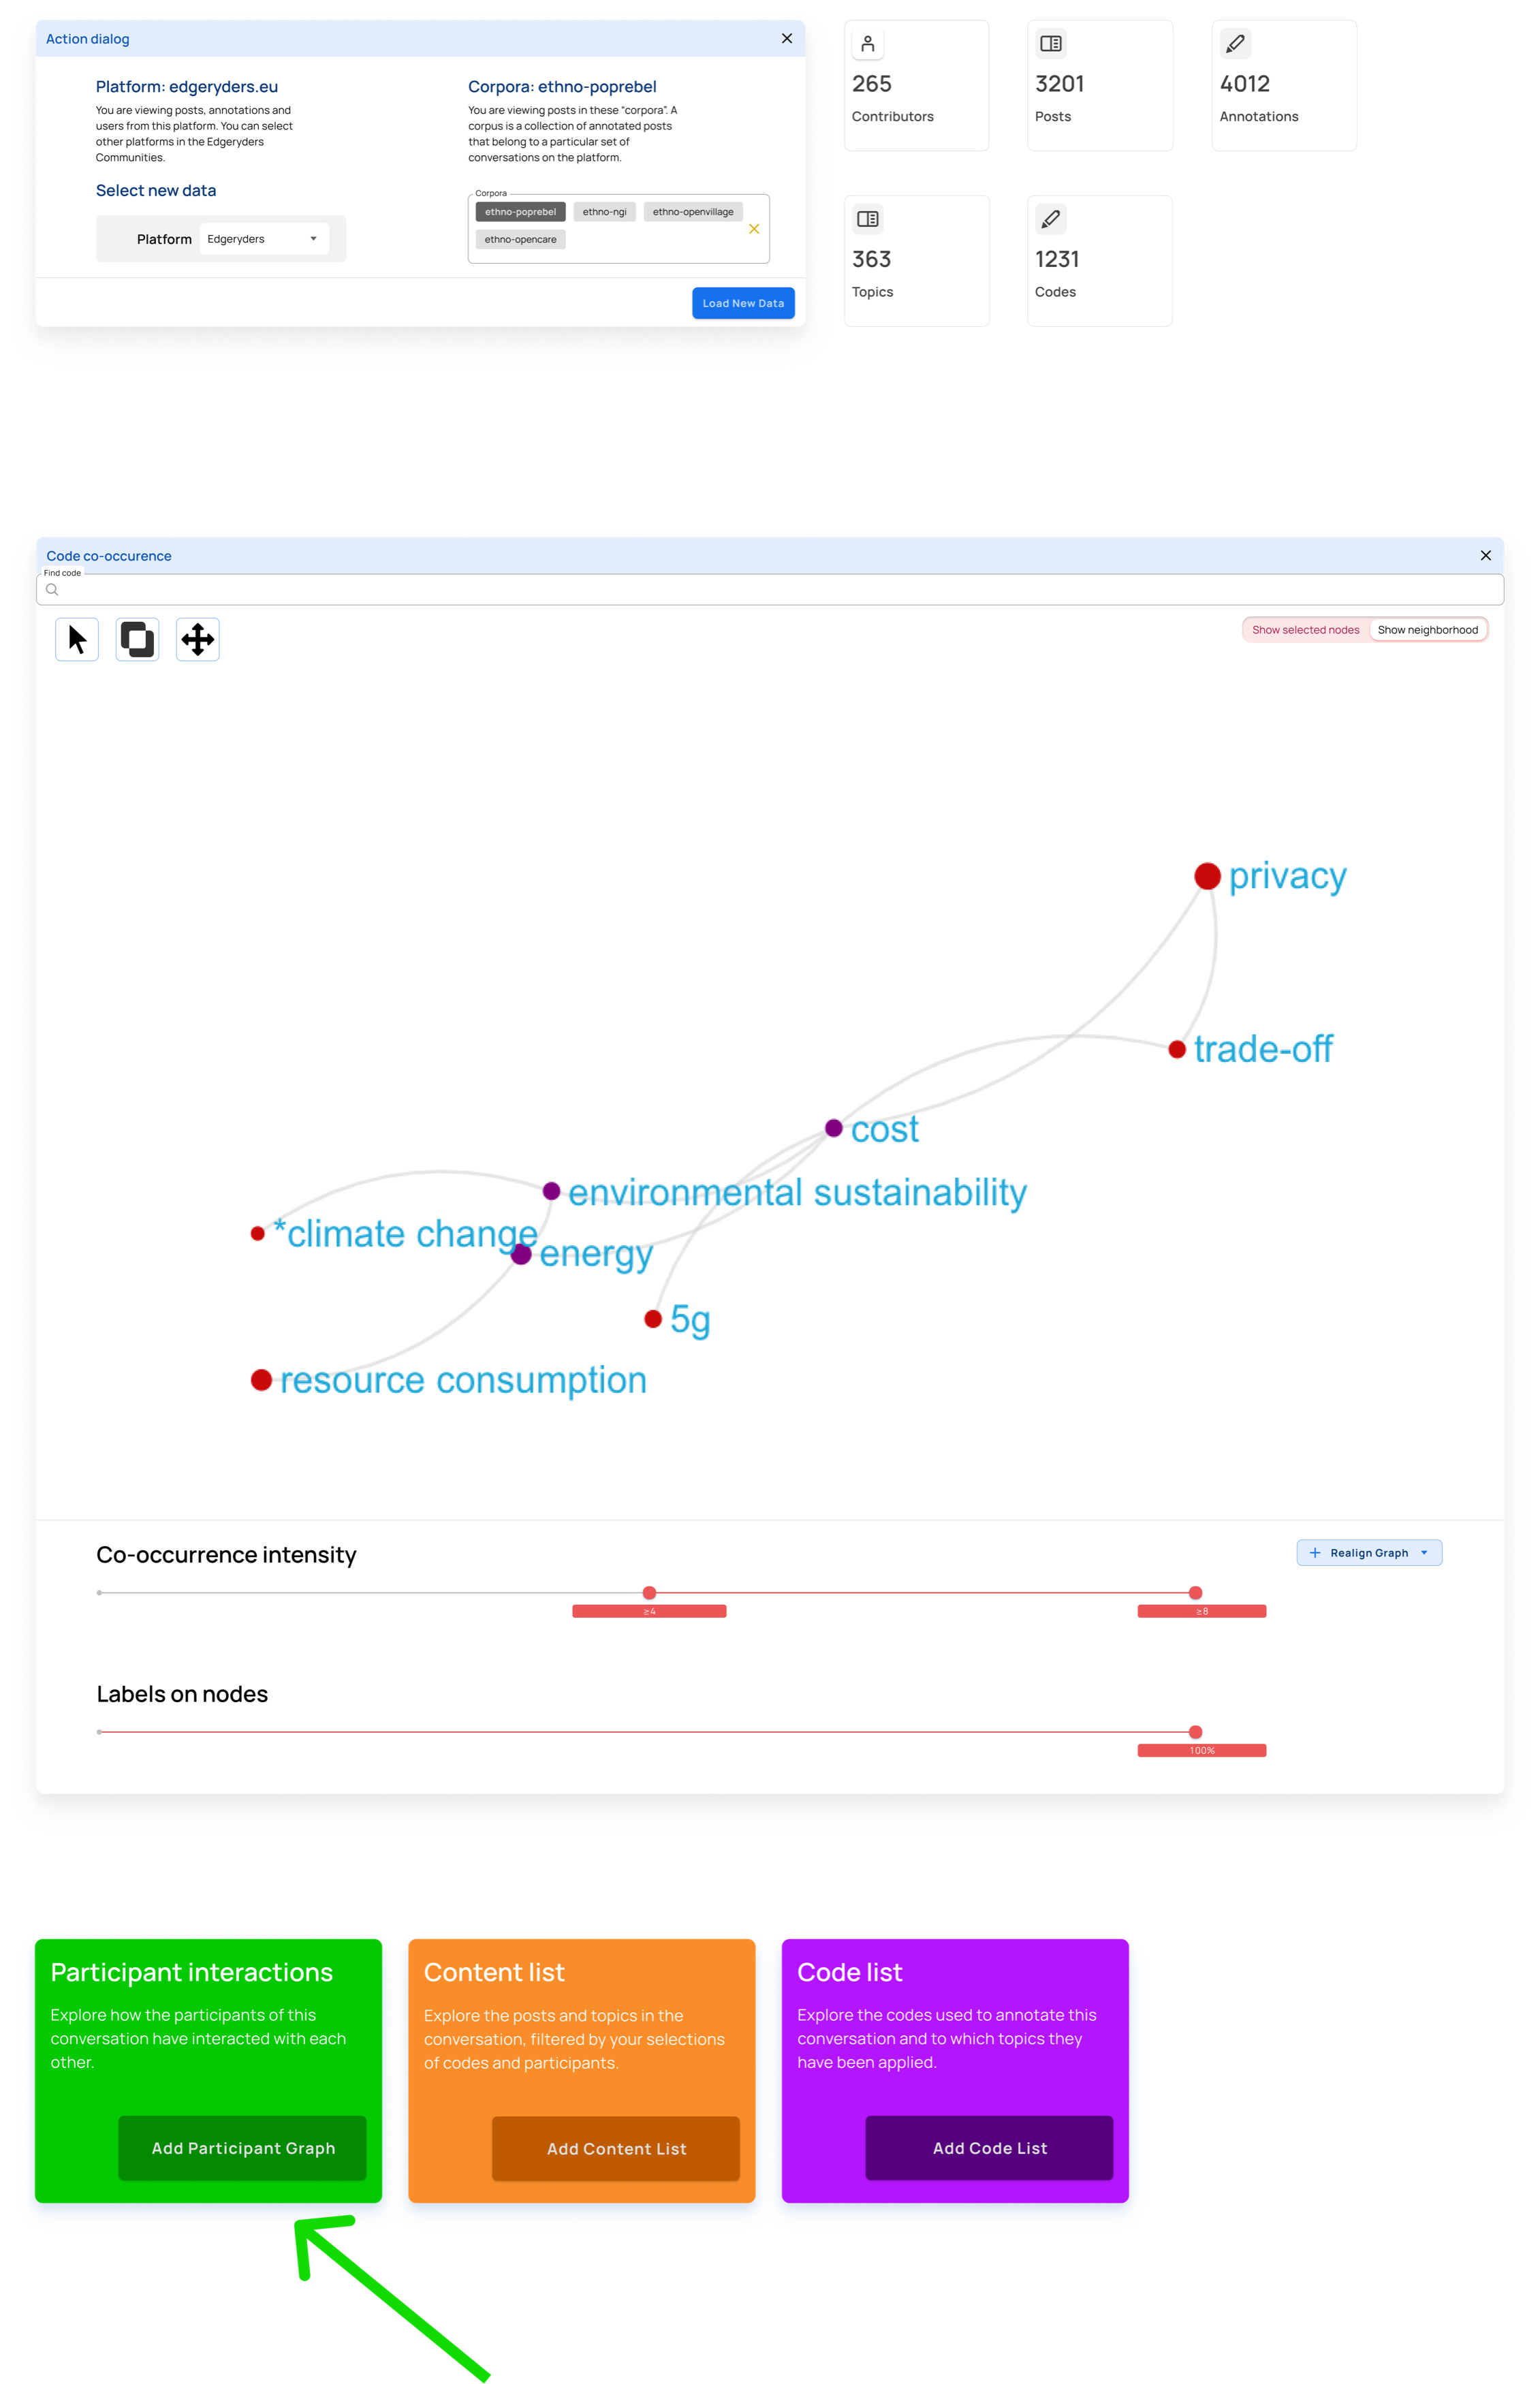
In this first case, the user has not loaded any data. When coming to RyderEx, they are first presented with a dialog to choose the platform and corpus they want to explore.
Step 1
Select the platform and the corpora you want to explore.
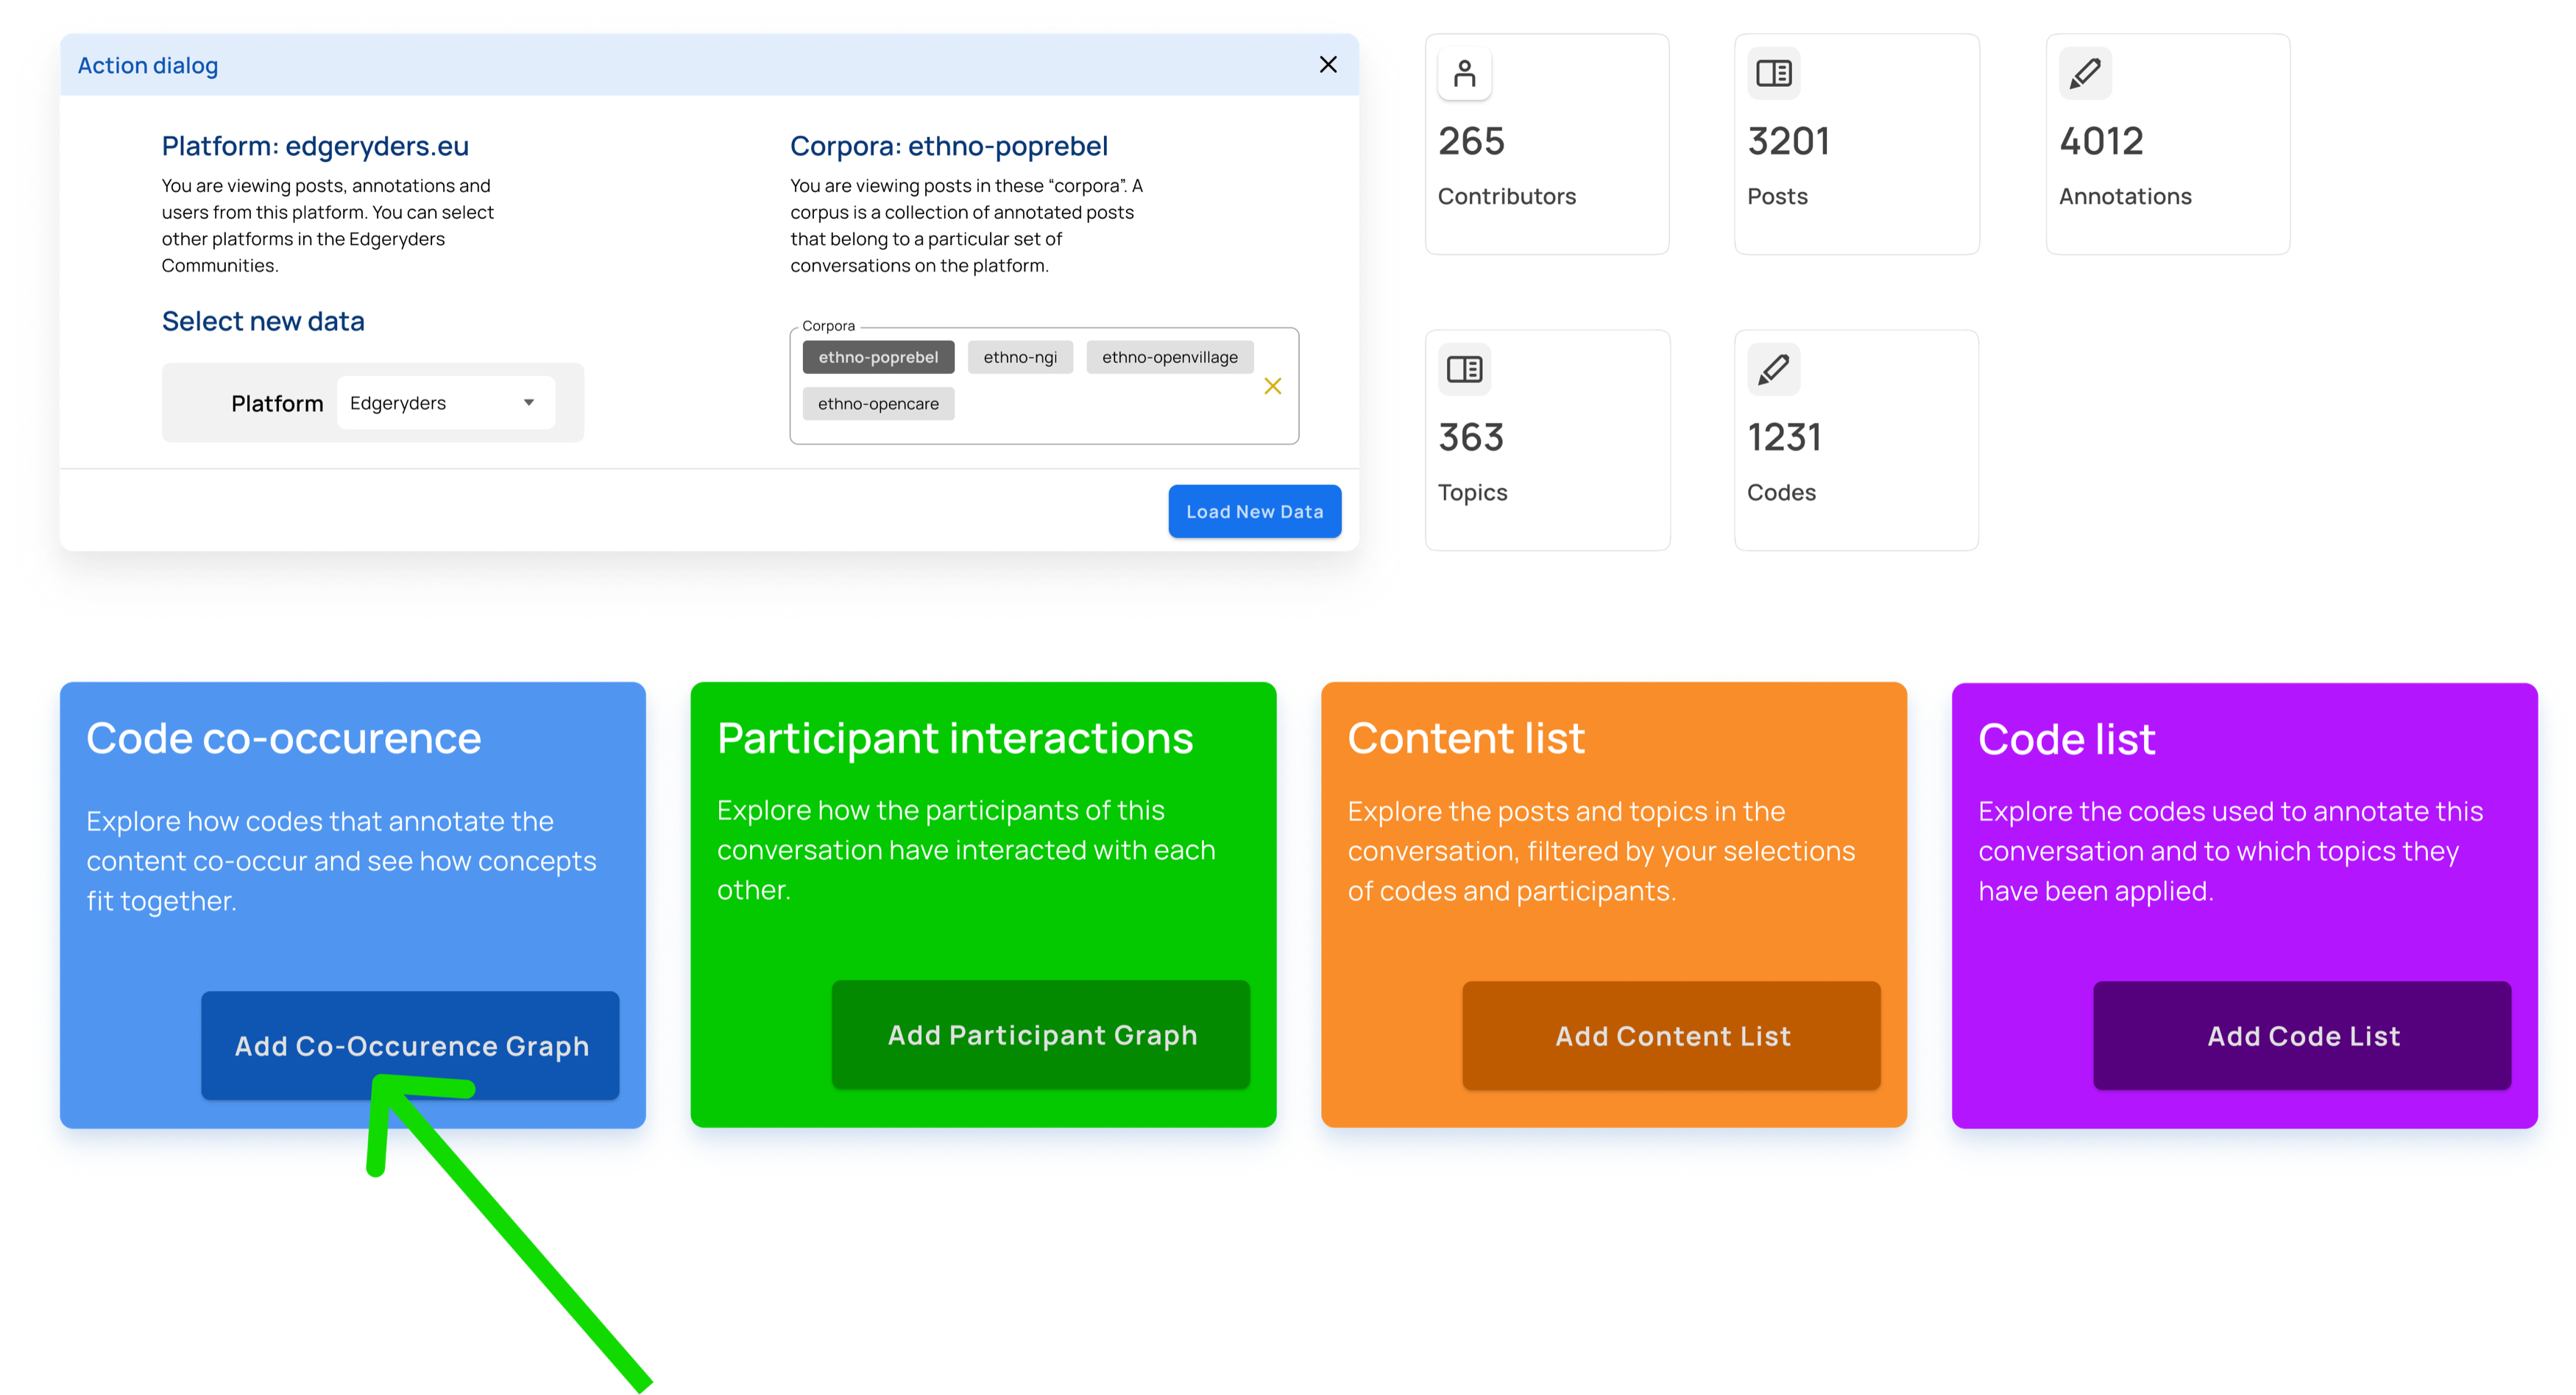
Step 2
Step 3
Filter out nodes that co-occur less than 4 times
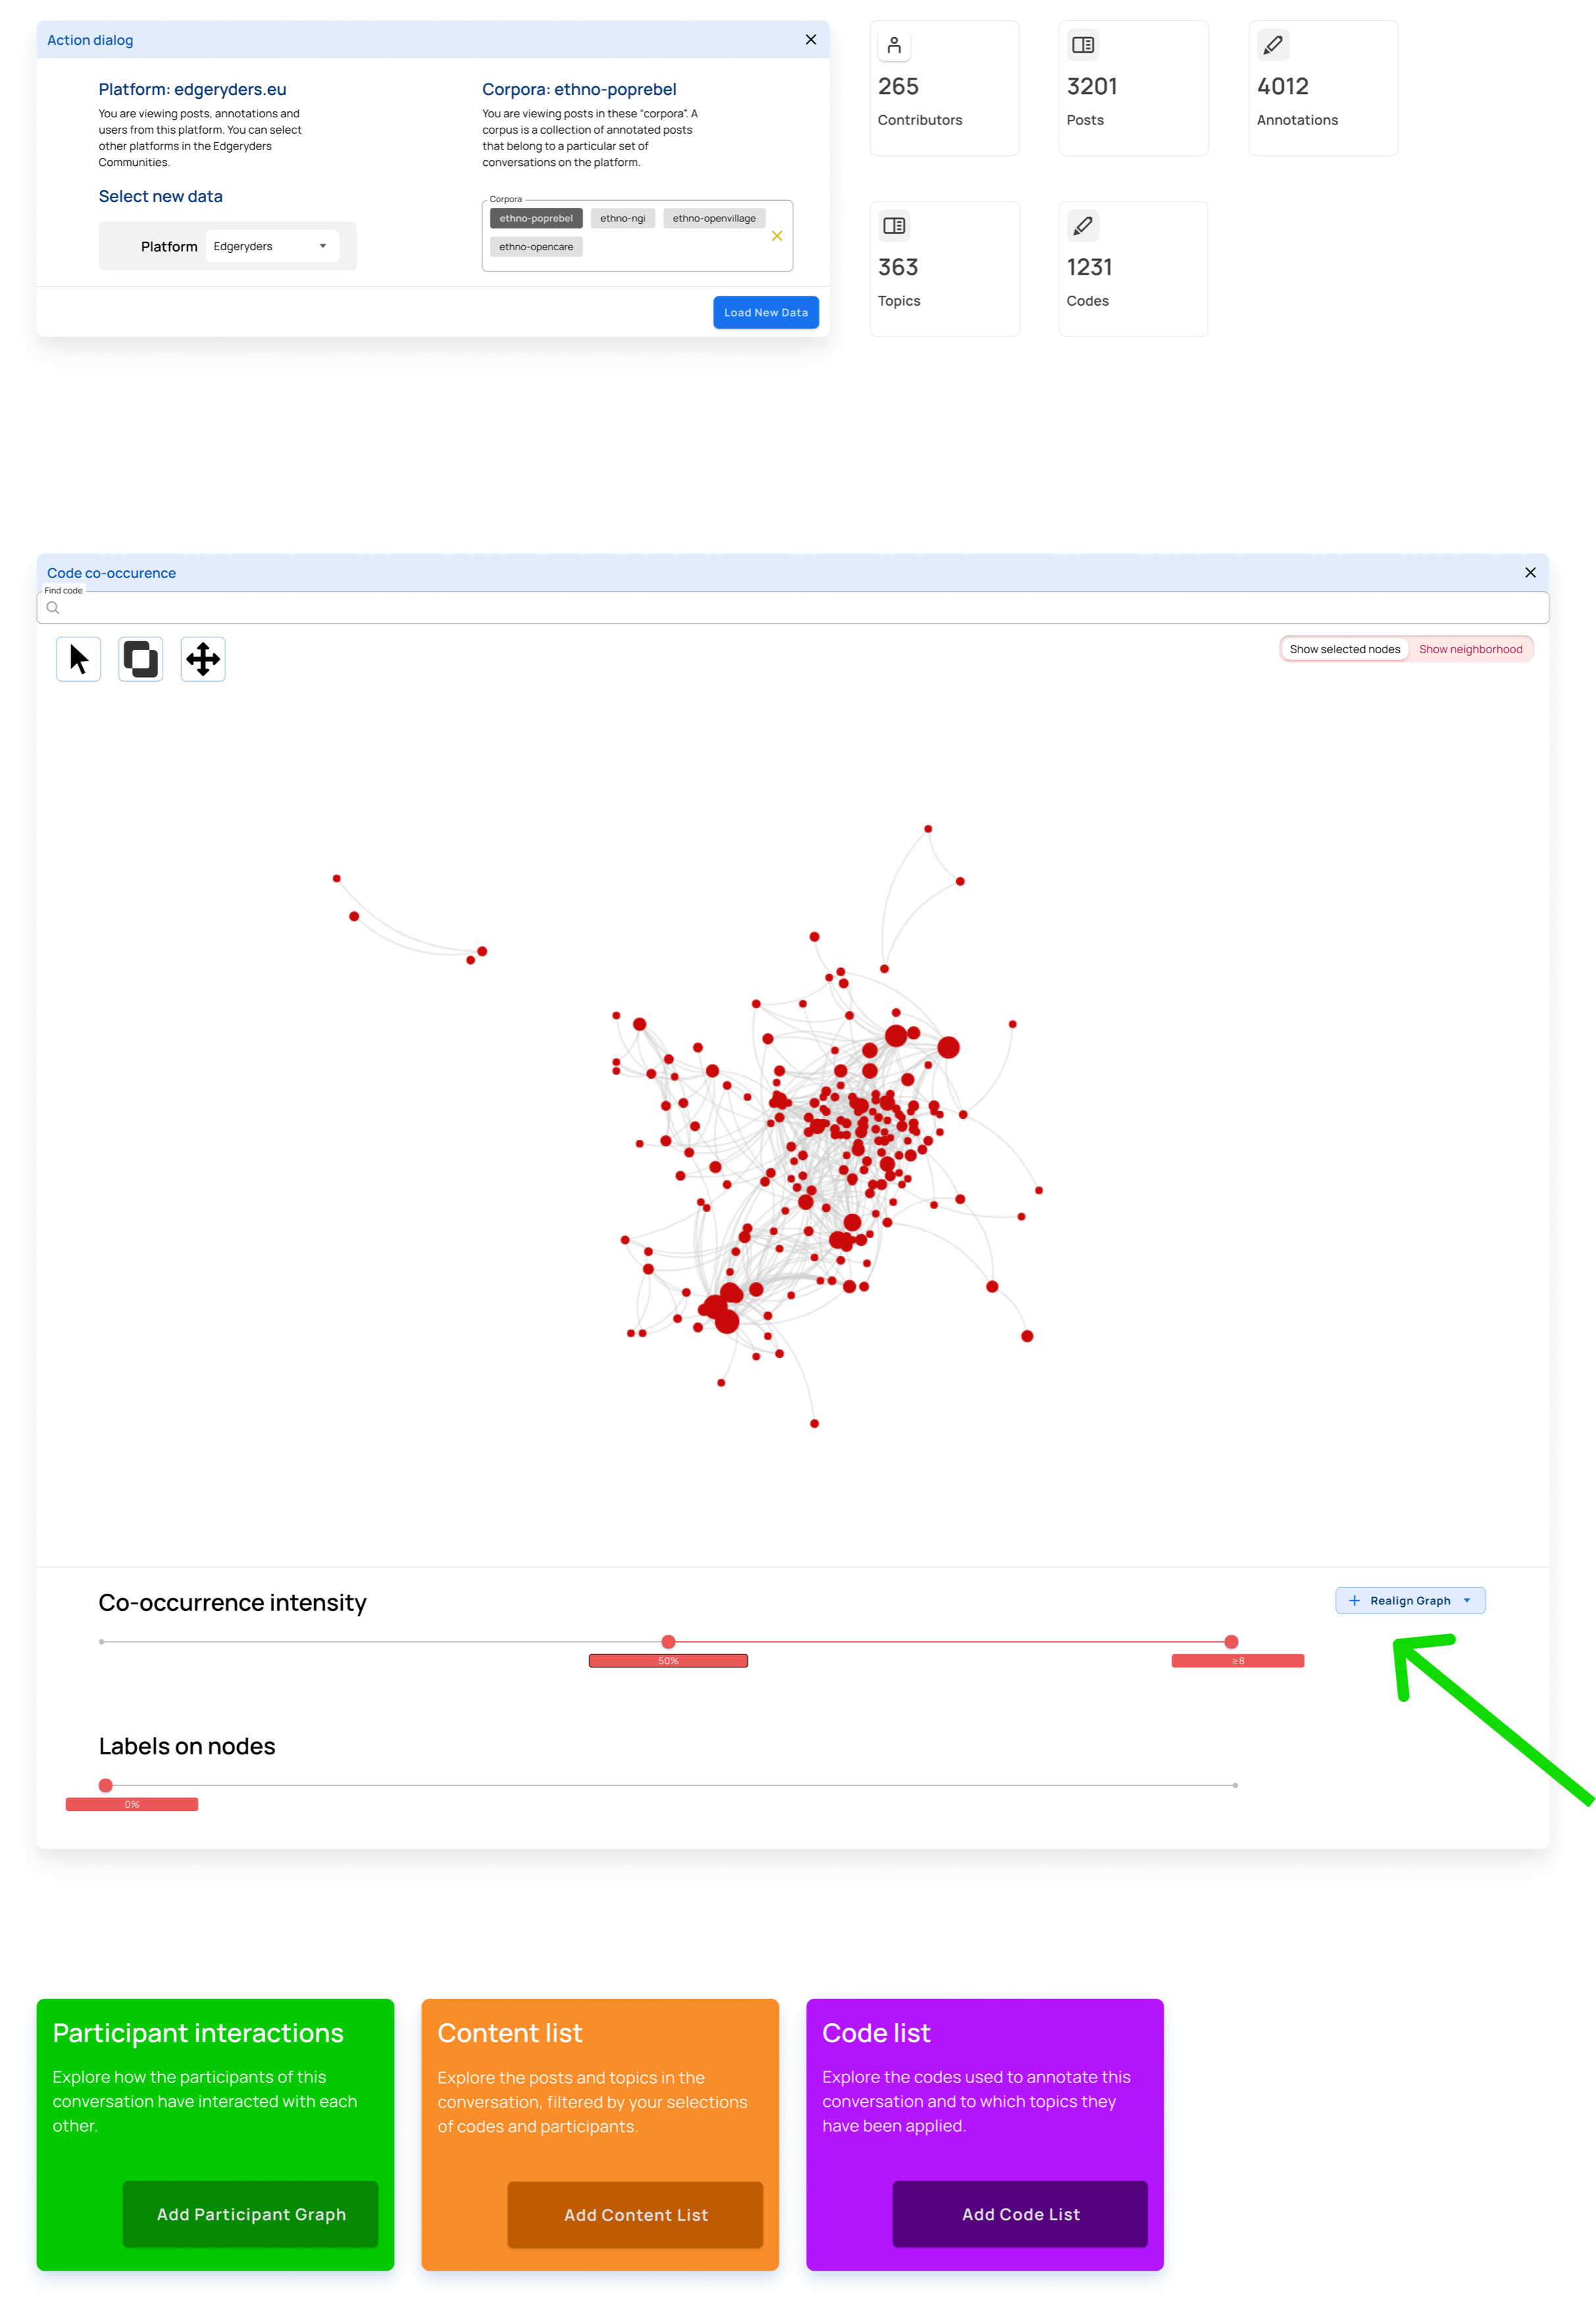
Step 4
Explode the graph to get a better overview of the visible nodes. This button should always apply the force direction algorithm on any set of visible nodes in the graph.
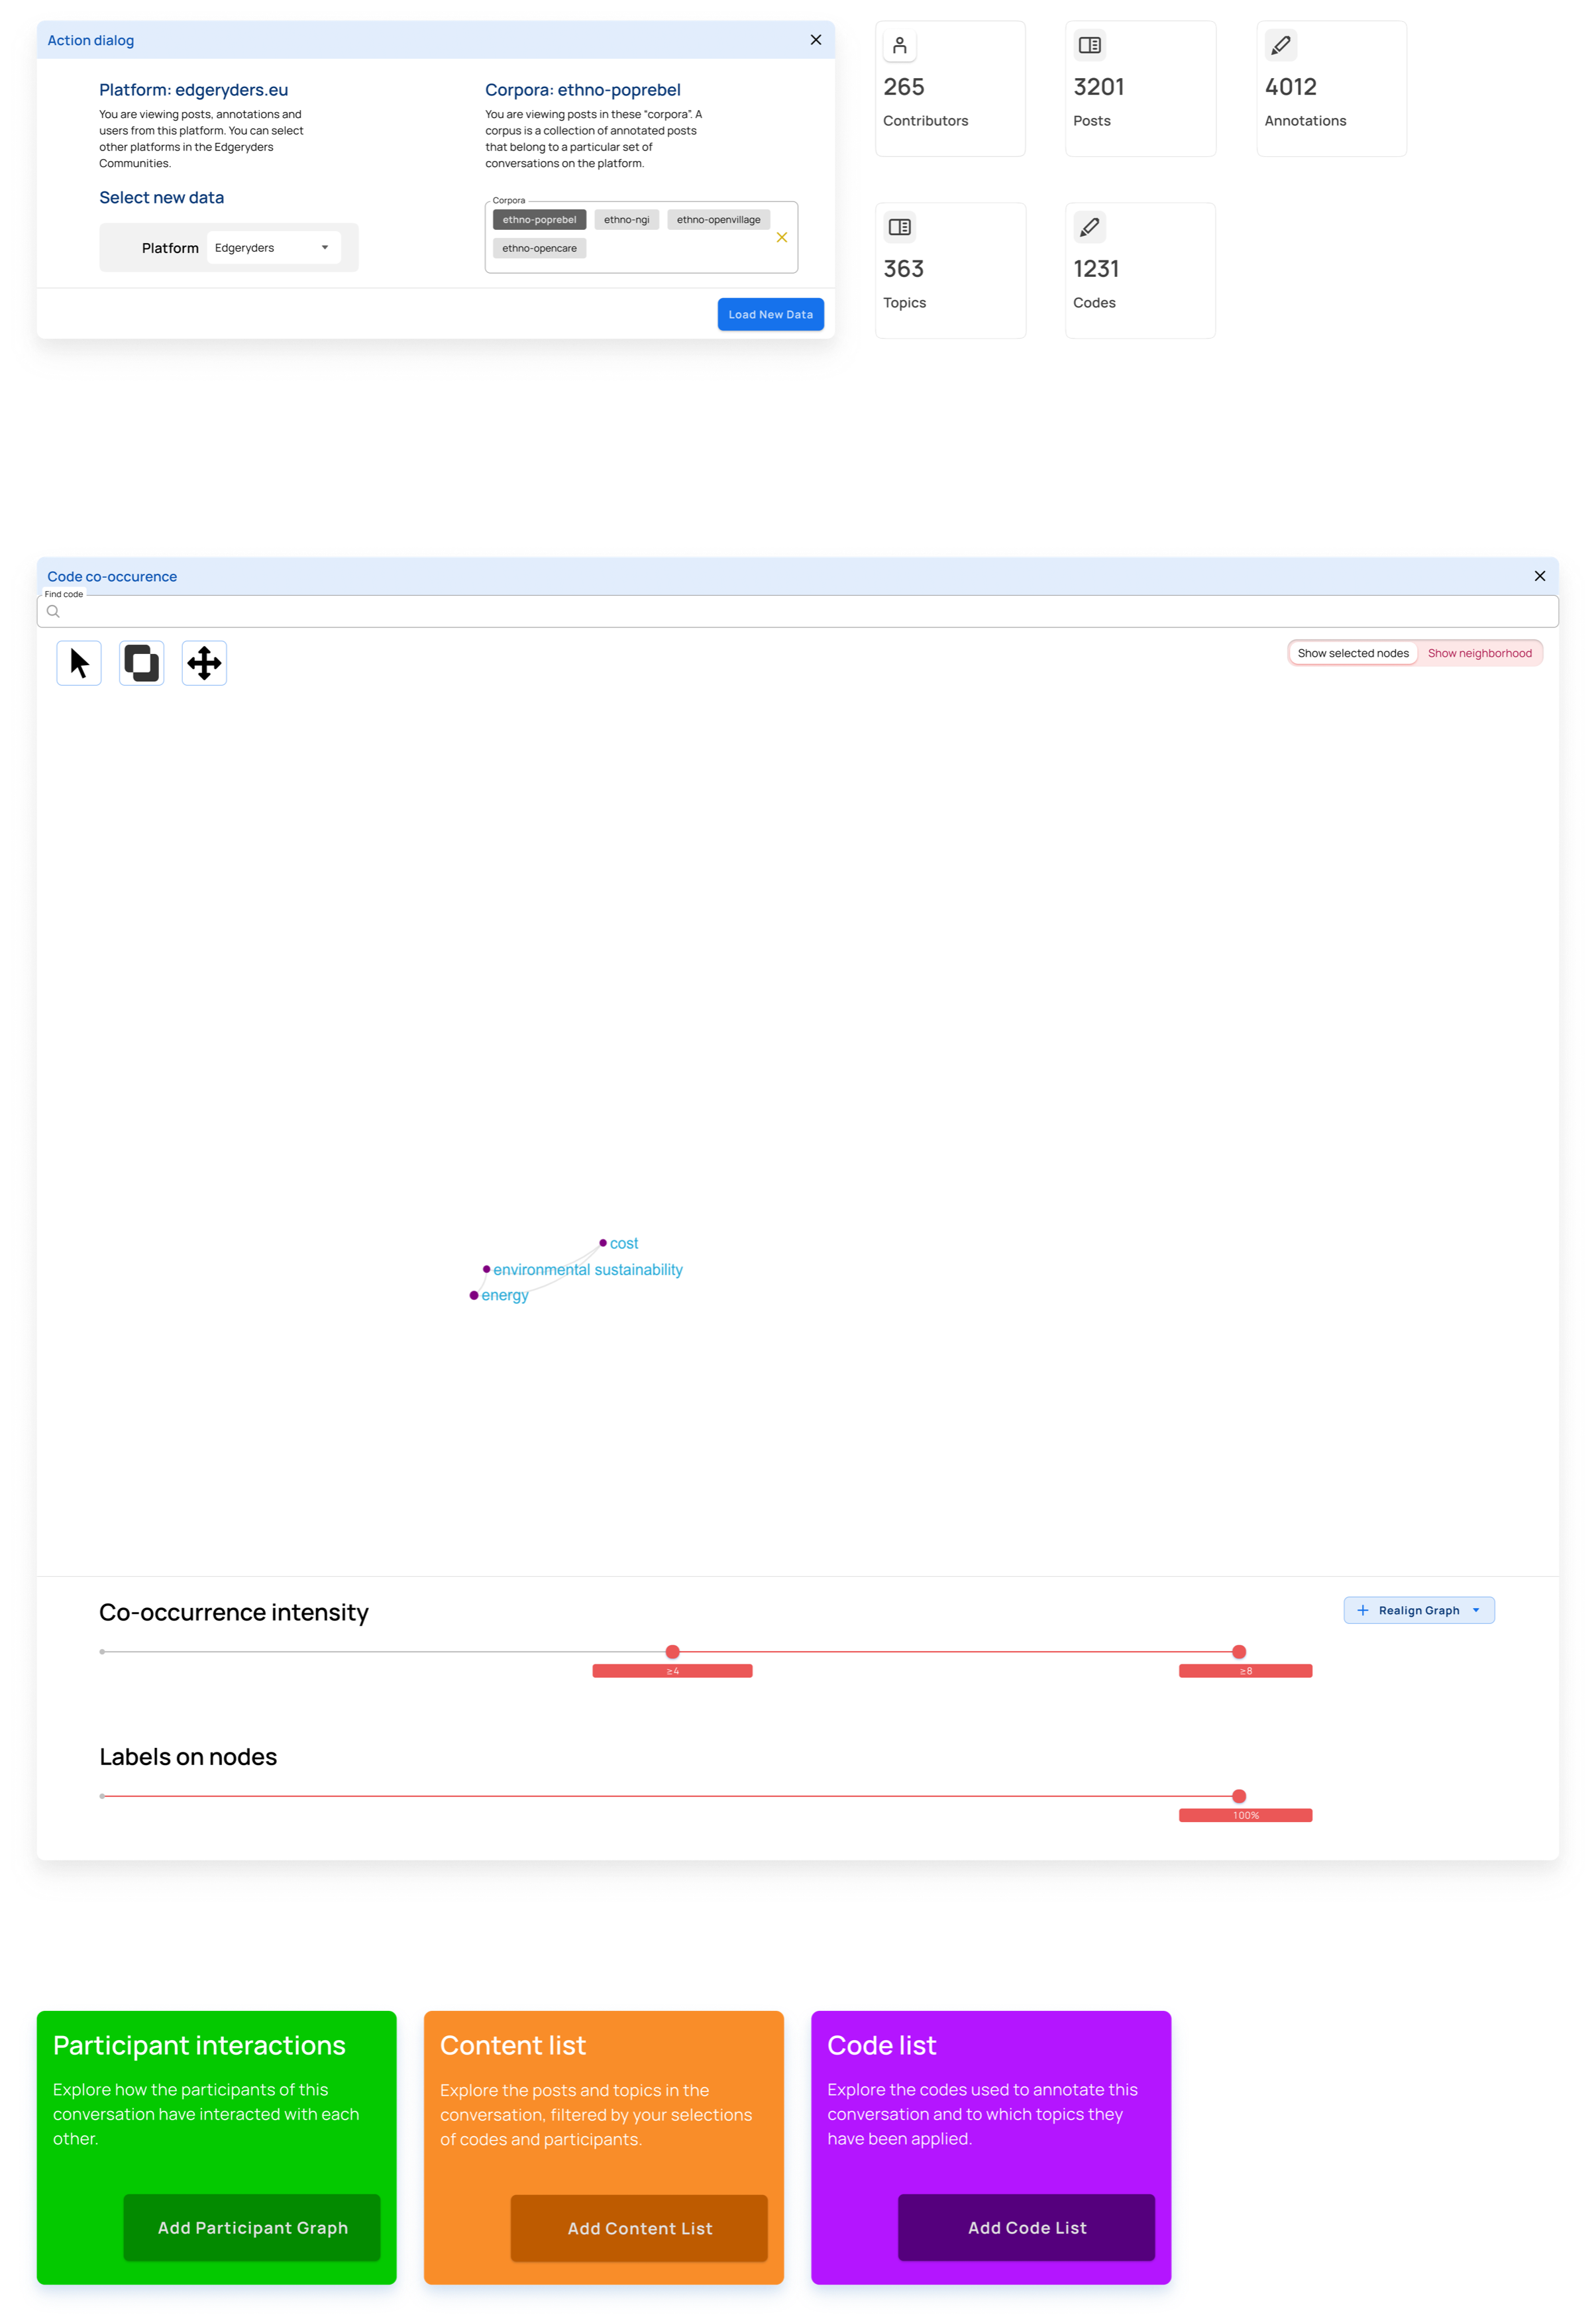
Step 5
Choose the select multiple nodes tool and select three nodes NOTE: We need to work out how the actual UX works here. Set labels to all nodes. The label slider starts by setting labels on codes with the highest number of annotations.
Step 6
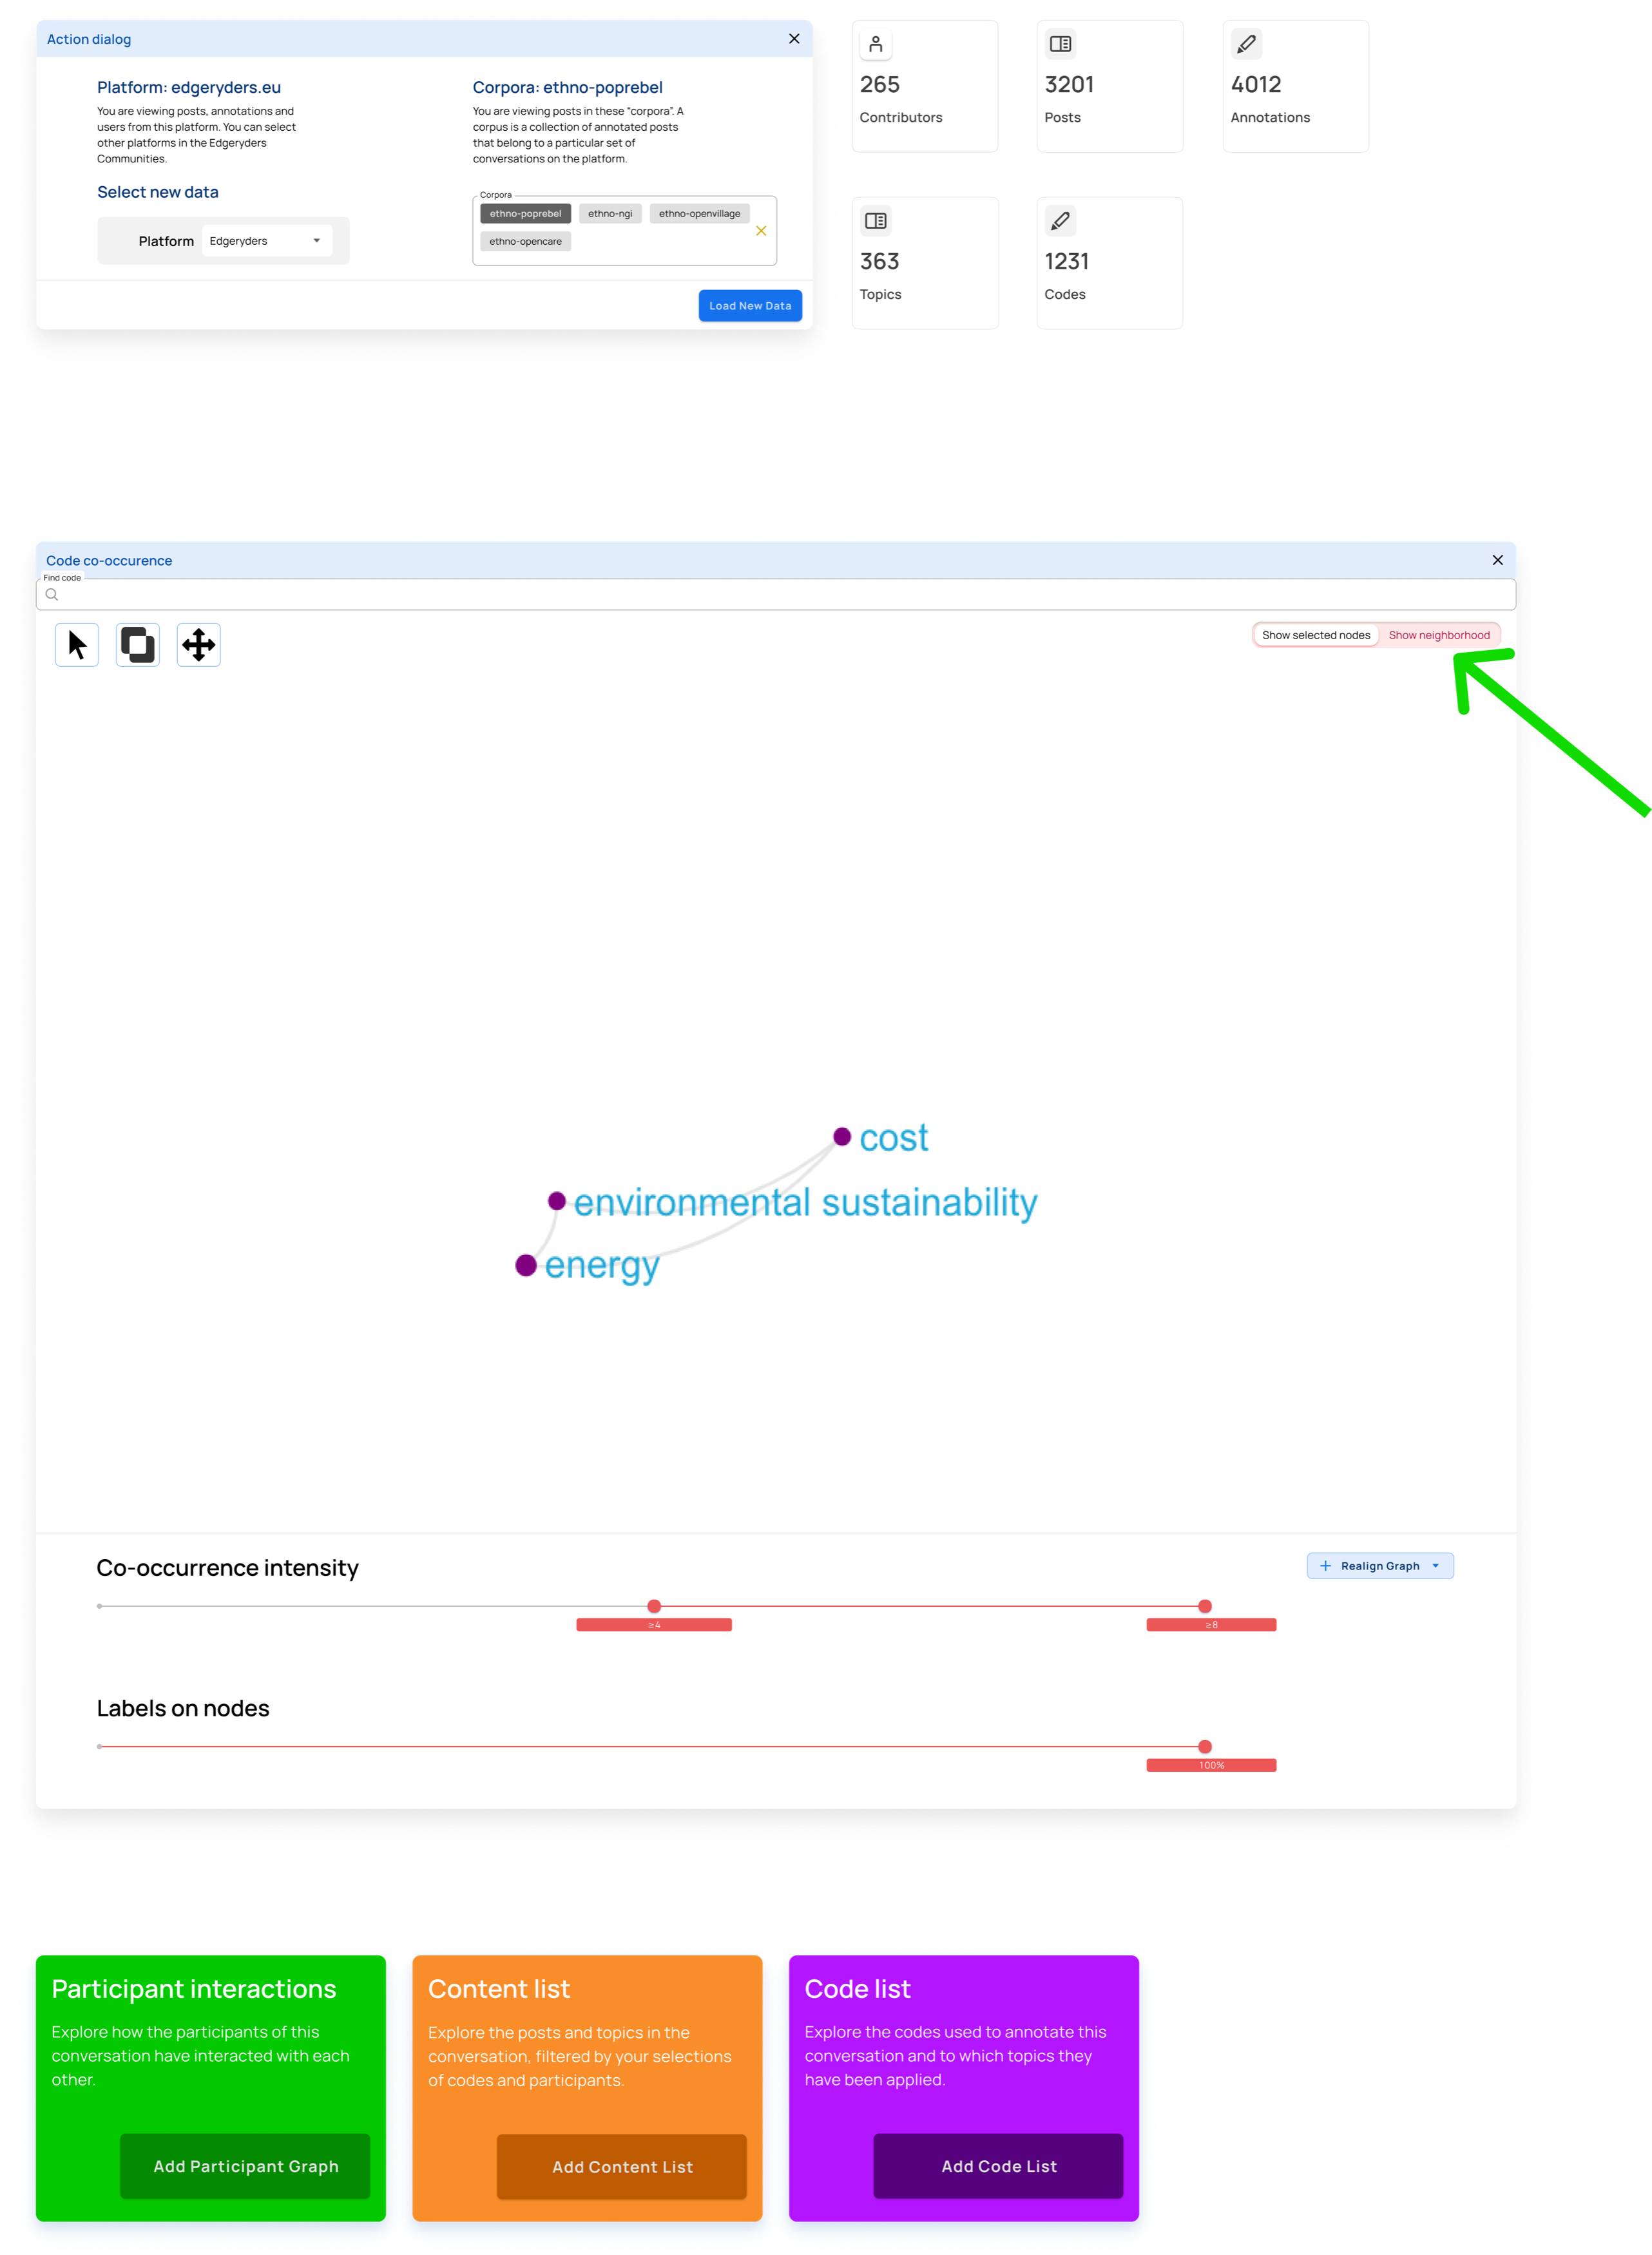
Step 7
Zoom in on selected nodes* Show the neighborhood of the selected nodes to see the adjacent concepts in the conversation.
Step 8
Case 2: Isolate participants who have engaged with identified concepts
Why?
To understand a conversation and community, it’s not enough to know what has been talked about. You also need to know who has talked about something, and with whom. For example, you may find a strong connection (many co-occurrences) between Covid-19 and 5G, but when inspecting the participant network of the sub-conversation of posts annotated with both of those codes, you may discover that only a single participant makes that connection.
Step 1
When adding a component, it appears below the last added component.
Step 2
This graph (second graph in the image below) displays participants (users) as nodes, with an edge between them if an interaction between them exists in the filtered subset of posts. An interaction is defined as:
Why?
Once you have found an interesting connection, you often want to explore the posts in which that connection was made. This feature is used by our researchers when writing periodic reports and by community managers looking to engage participants around specific topics.
Why?
We want to allow users to open and close components as they see fit, so that they can focus on exactly the question they are trying to answer without their view being cluttered.
Why?
Community managers might want to center on a group of participants to see which conversations they are engaged in. Participants themselves may also be curious to see the code-cooccurrence graph of their own posts, or the posts of someone they are interested in reading more from. Ahead of community events or seminars that follow a long online conversation, participant breakout groups can be given a graph of the concepts they have in common before the session to act as an ice-breaker.
This co-occurrence graph (second graph in the image below) shows the co-occurrence network between codes that have been applied to posts authored by either or all (should be possible to switch between AND or OR) of the participants selected in the graph above.
Why?
Most of the codes applied have more information attached to them, like a definition and the number of times they have been applied in total. It can often be useful for the researchers to see a table of the codes that pertain to a particular co-occurrence graph or list of posts.
Why?
Sometimes it may be a lot easier to filter out codes through selecting them in a list than to find and select them in a graph. A researcher may want to do this in order to look at only posts that have been annotated with a subset of the codes that are currently visible in the co-occurrence graph.
I personally love it. Your use cases make complete sense to me. Case 7 would be the standard “quotation manager” in ethno software like Atlas.Ti.
I recall us talking about using Google Analytics to count both page views javascript actions. This gives precious indications, because you can see which feature people use and which ones they don’t, and from that infer what the dashboard is actually used for. This is what we did for Edgesense (between iterations), and results were quite surprising to the designers. Did we end up doing that?