Do you have any windows open that week?
Ah, I stand corrected: the meeting I am in is on Monday 11th.
That said, the week 18-25 is tricky because 26 is the deadline for the GD Horizon calls. There could be disruption.
Is the end of next week better for you? For example Friday next week - 15th?
No, no, if anything it is more at risk. Let’s be in the 18-25 week, please.
Alright, 13:00 on Monday the 18th it is. Let’s hope we can make it.
It might not need to be 2 hours if we do some asynchronous work in this thread first, following the same format as in my post above.
After catching up with @jacomyal it became clear that we need to define some more detailed user stories for RyderEx before we begin.
How this dashboard will be used
Most importantly, we will use this dashboard to conduct our research. An example of our research can be seen here:
Furthermore, we wish to start using our graphs to engage the participants of our various forums. We think it could be a novel and engaging way to interact with an online conversation to explore it through filtering interesting concepts through graphs in an interactive dashboard. This use case is however secondary to using the dashboard as a tool for researchers.
Compared to our current dashboard, the new RyderEx version will offer a number of improvements:
- Access to all datasets through a single API and dashboard, instead of the current version that needs a new database, API, and dashboard for each dataset.
- A more modular design that allows for more use-cases without overwhelming new users.
- A more modern tech-stack that is easier to build on for future improvements.
- Improved performance through relying on recent advances in client-side graph processing, thus avoiding the slow and heavy-duty server-side graph processing of the old version.
- Persistent states, allowing users to save a link that navigates to a particular state. An example could be to show the co-coucurrence graph filtered to ≥4 co-occurences and a list of the posts that those codes co-occur in from the ethno-ngi corpus on the edgeryders.eu platform.
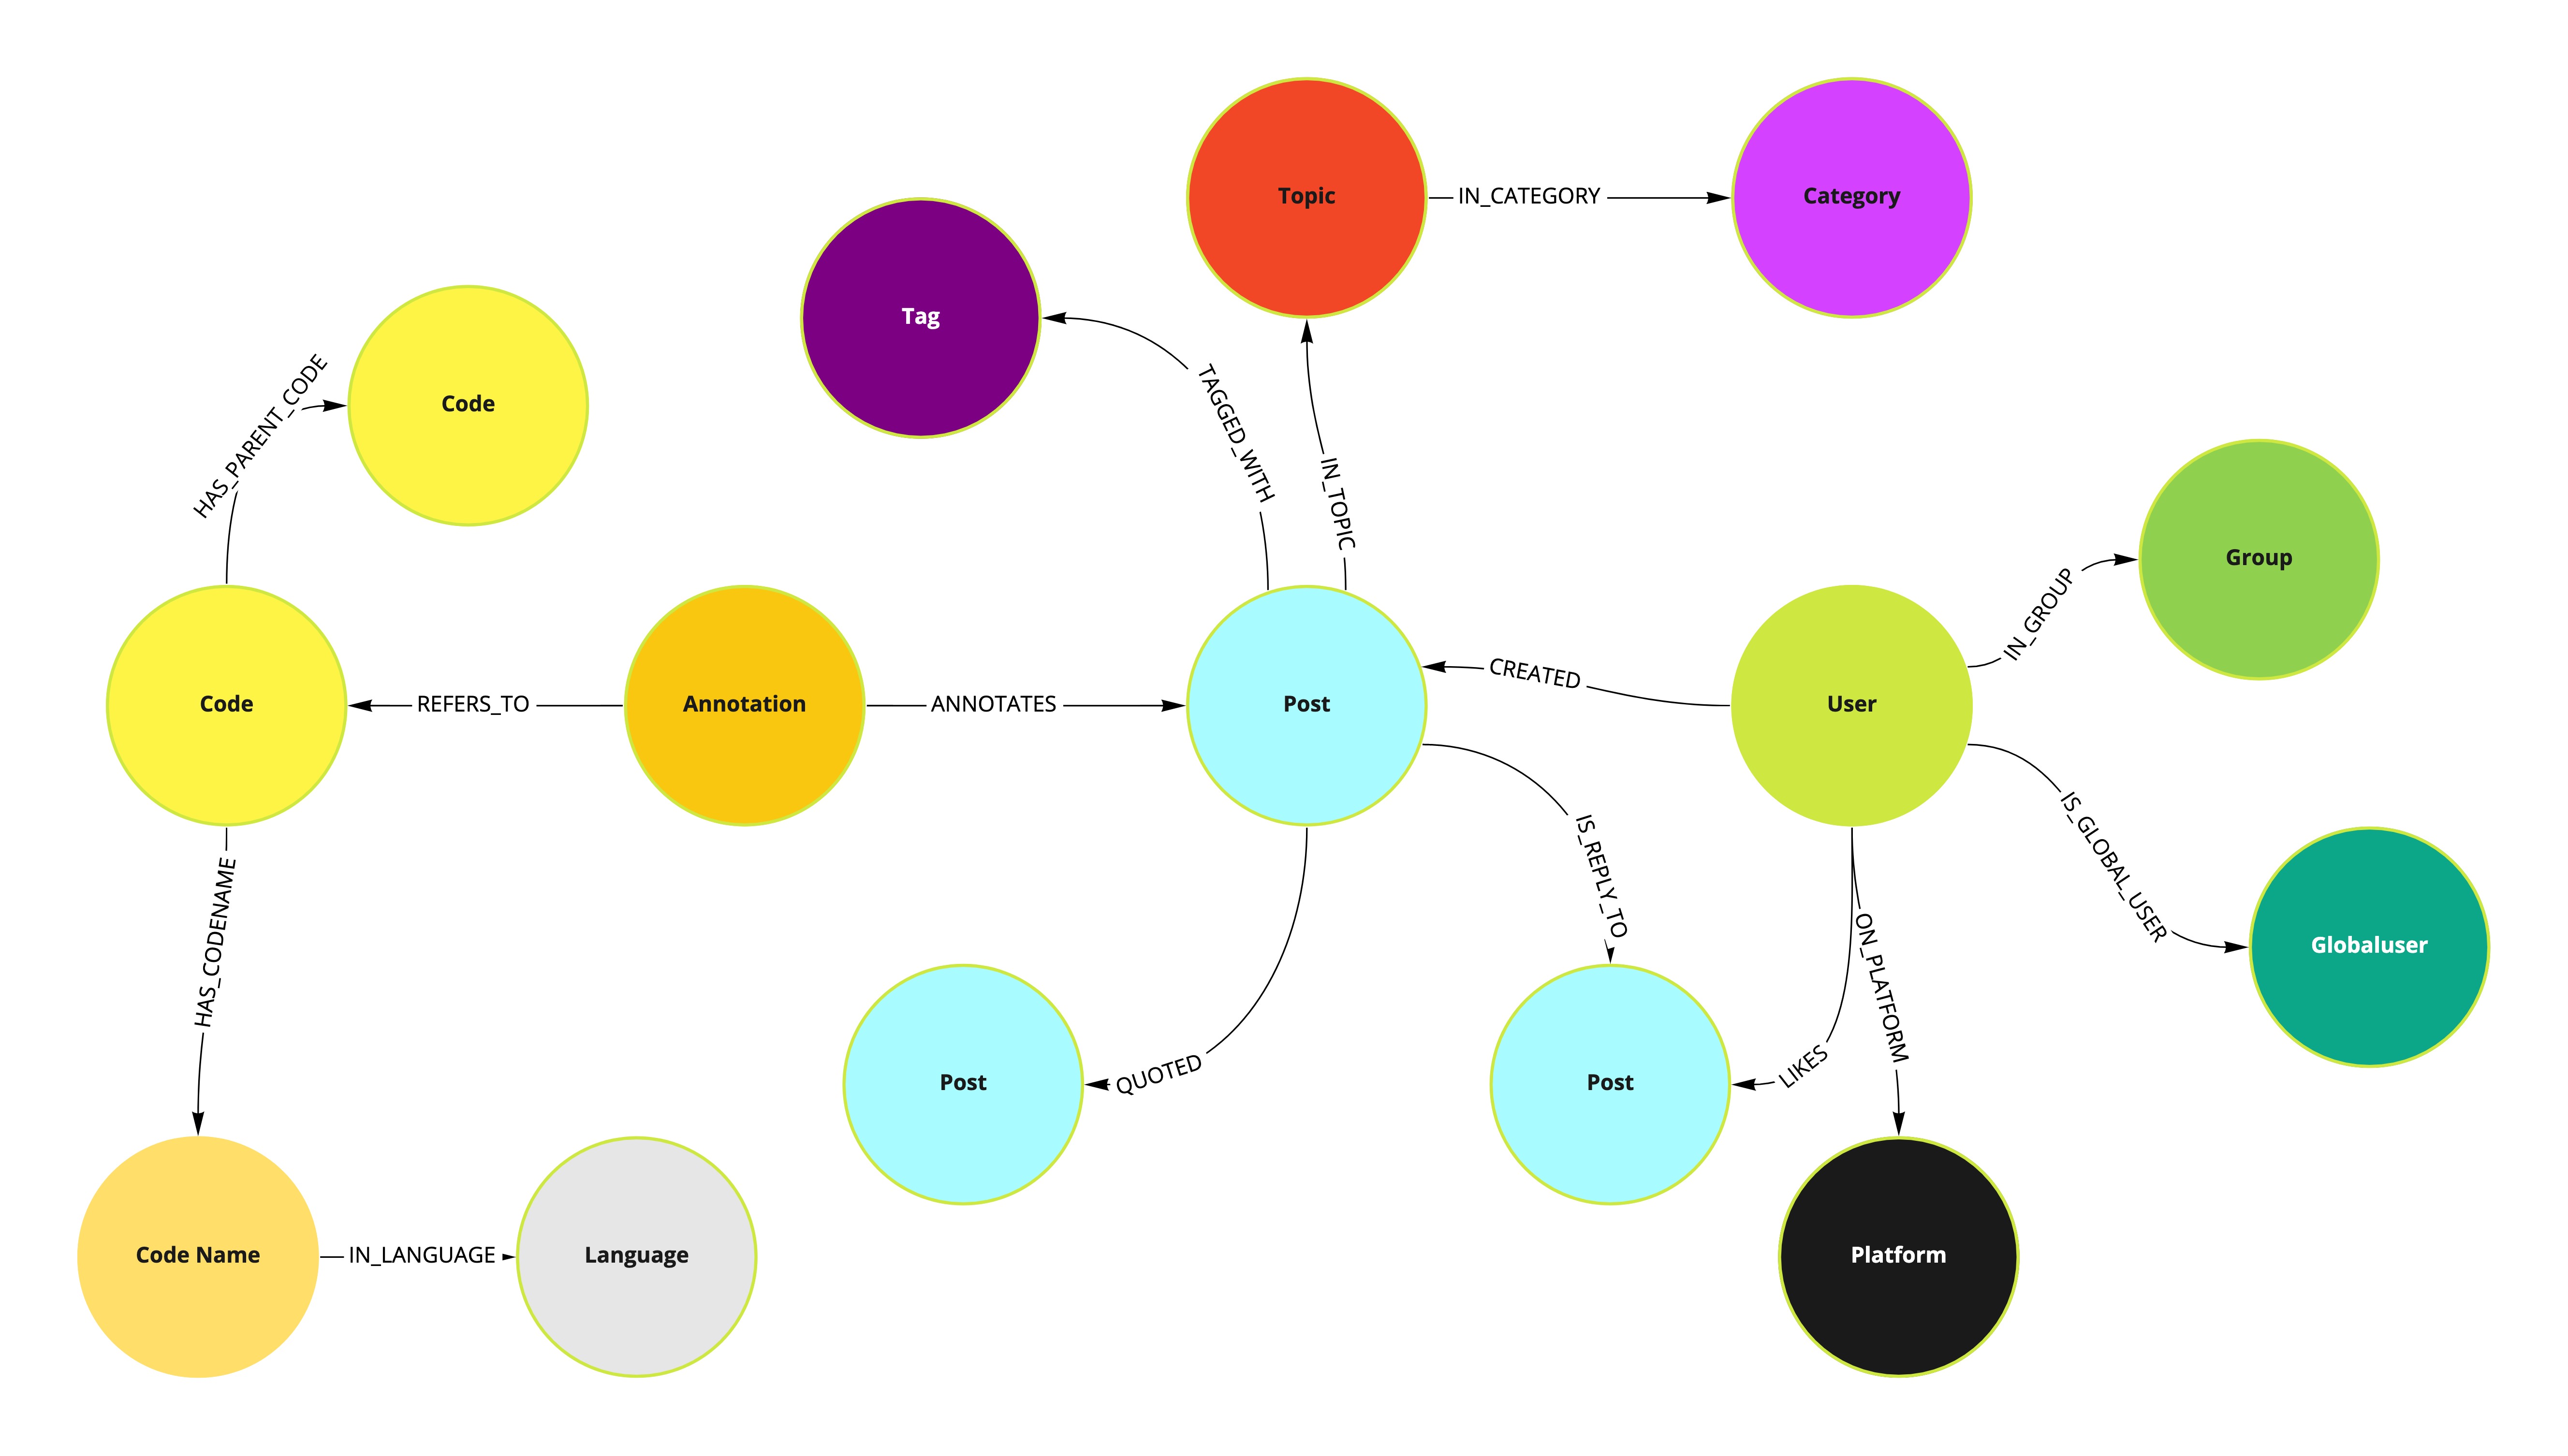
Data model
To reiterate, the data model looks like this. All of the data needed is available in a single Neo4j database. Data from the different platforms available to RyderEx are imported by adding to the configuration of the RyderEx API. Corpora are simply defined through looking for topics tagged with a Discourse tag that starts with the prefix “ethno-”.
Data flow in dashboard
RyderEx will allow you to explore content by filtering by:
- Platfom
- Corpus
- Topics
- Posts
- Codes
- Participants
Compared to the old Graphryder dashboard there is one major difference in how data flows. In Graphryder, the Detangler view allowed you to filter on participants and codes with a two-way data binding. This was an interesting idea, but pretty confusing to most users who were not very familiar with the software. In RyderEx, data is filtered through the components in sequence. You start by filtering by platform and corpus and then choose the next component. You can then add subsequent components, but components added later in the sequence only show and pass on the filtered data passed by the selection in the previous component. The user can add and remove these components in any sequence they choose, but they must decide if they are going to start by filtering by participants or by codes.
For most users, this will make the software more intuitive, as this is how filtering usually works.
User stories
Case 1: Load data from Edgeryders ethno-poprebel annotated conversation and explore by code co-occurrence
See full resolution of case 1 sketches in Figma
Why?
Code co-occurrence means that two ethnographic “codes” (like “resource consumption” or “climate change”) have been used to annotate the same post. We use code co-occurrence to build “Semantic Social Network” graphs. These are then used to understand a conversation and community, either in research or by that community itself to gain a birds-eye view of their conversations. These semantic social networks are the most important feature of this dashboard and a vital deliverable in many Edgeryders research projects.
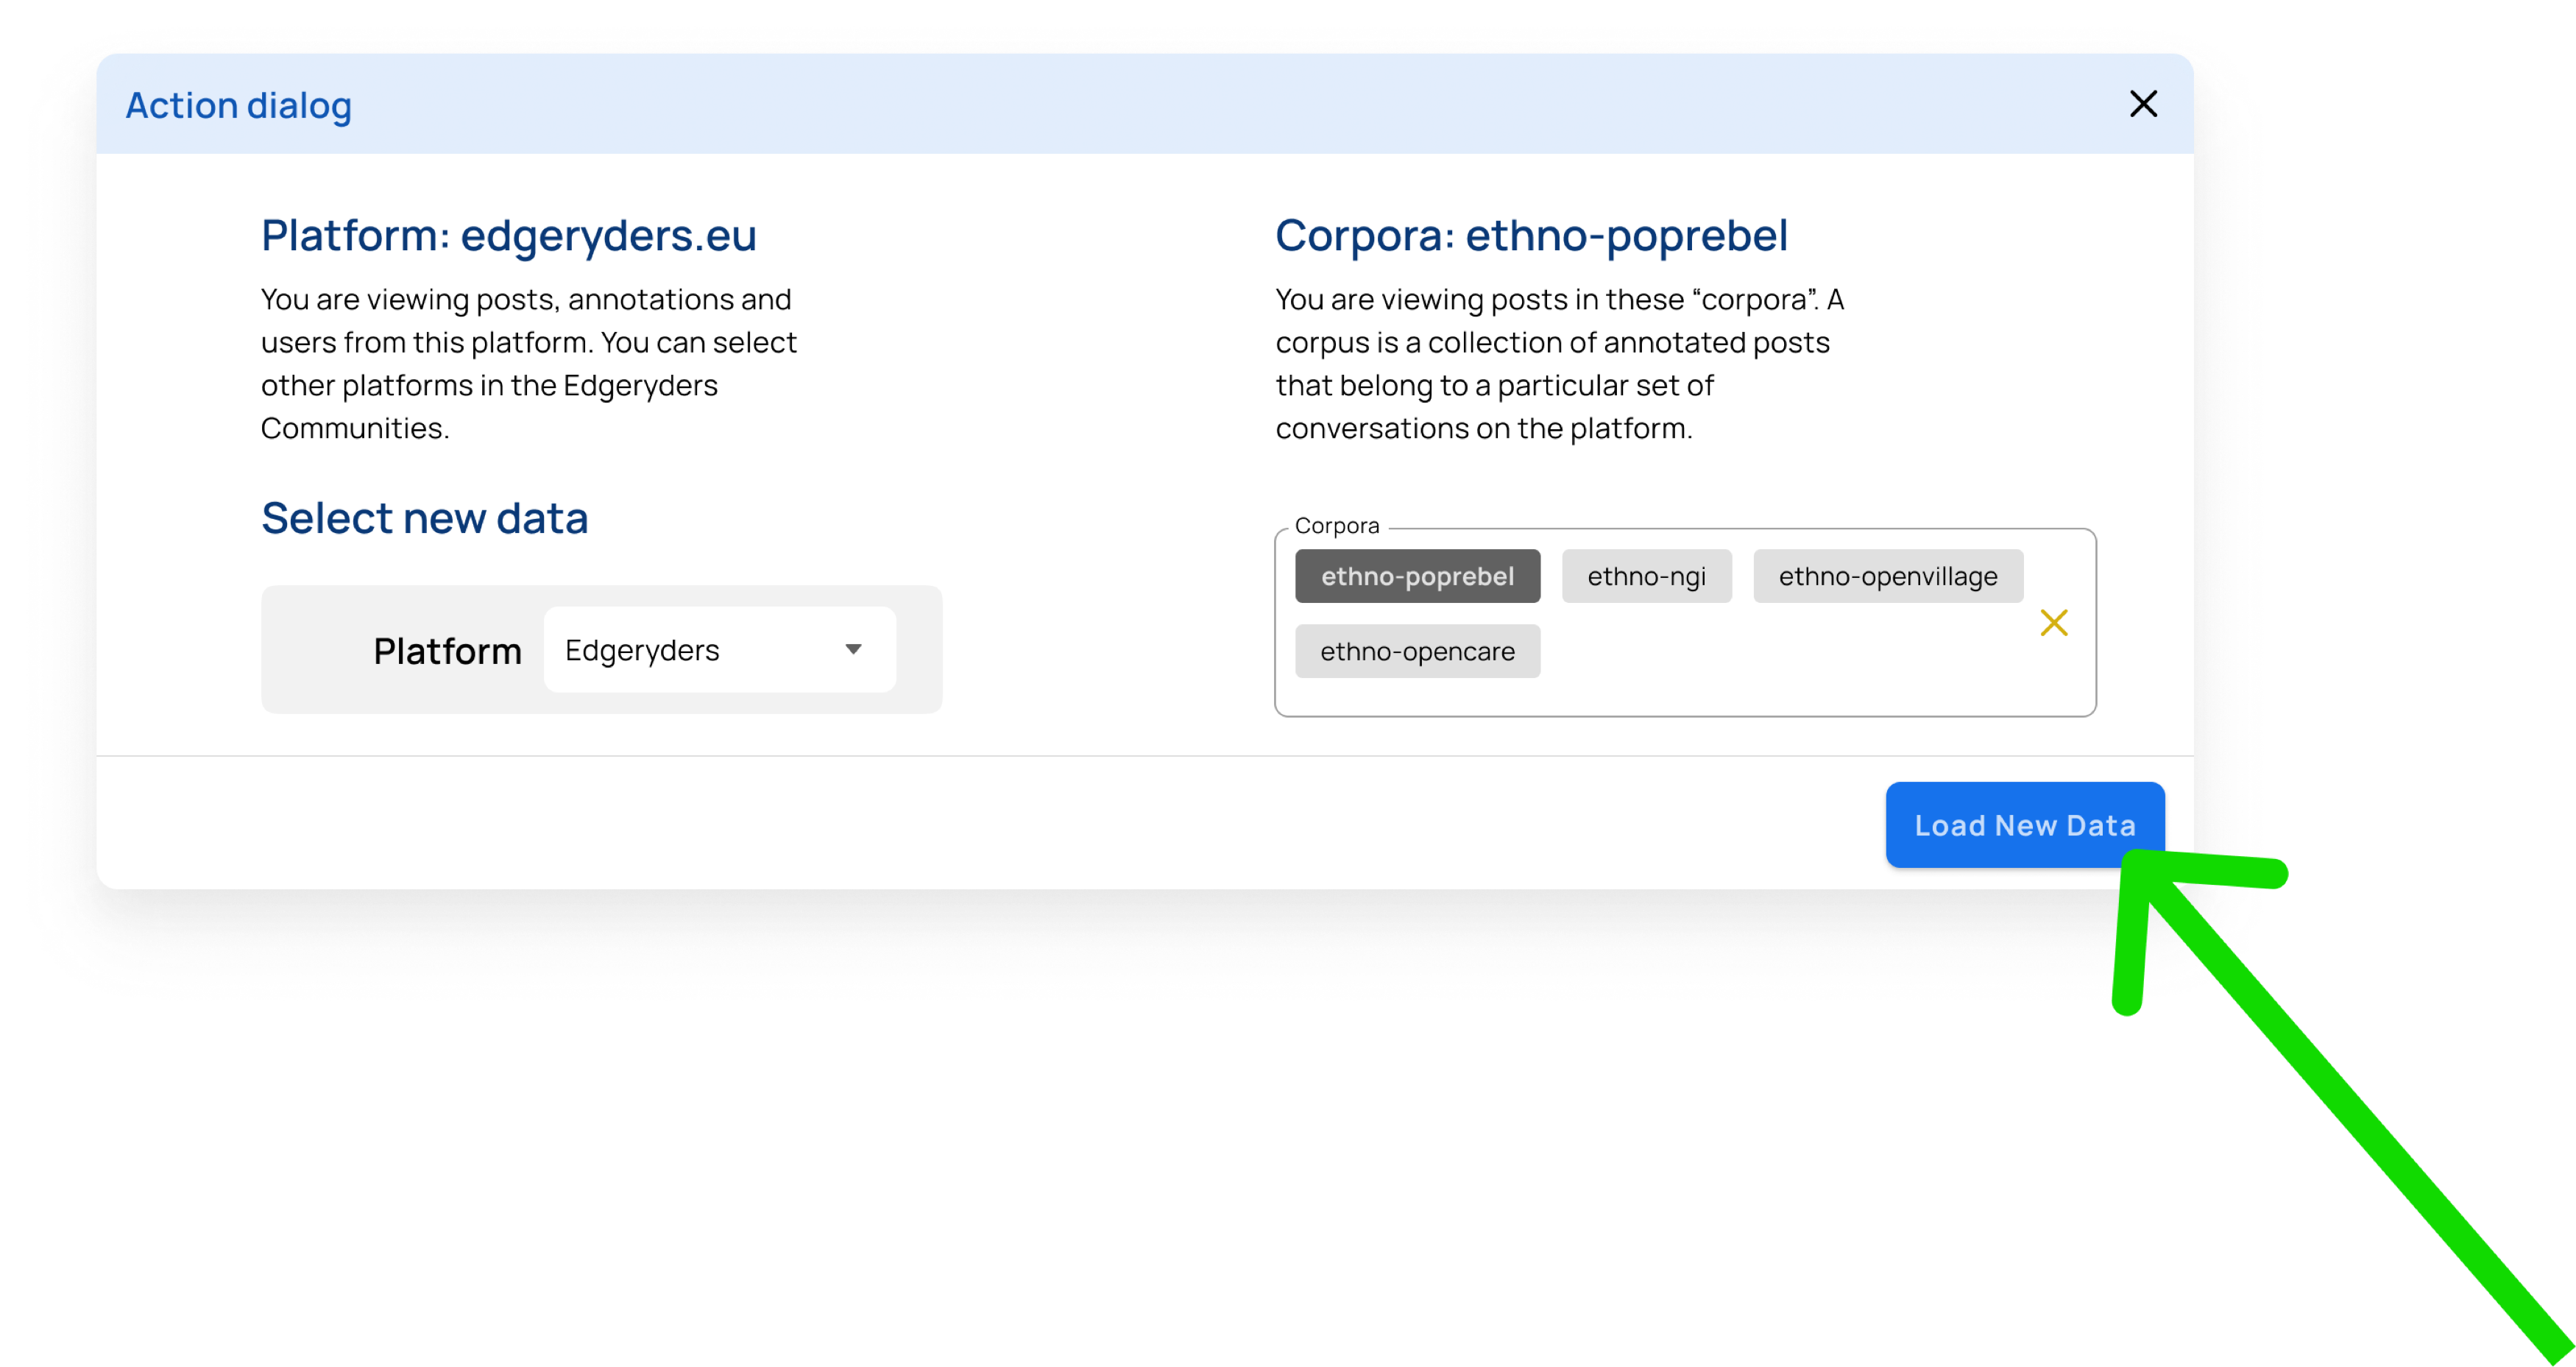
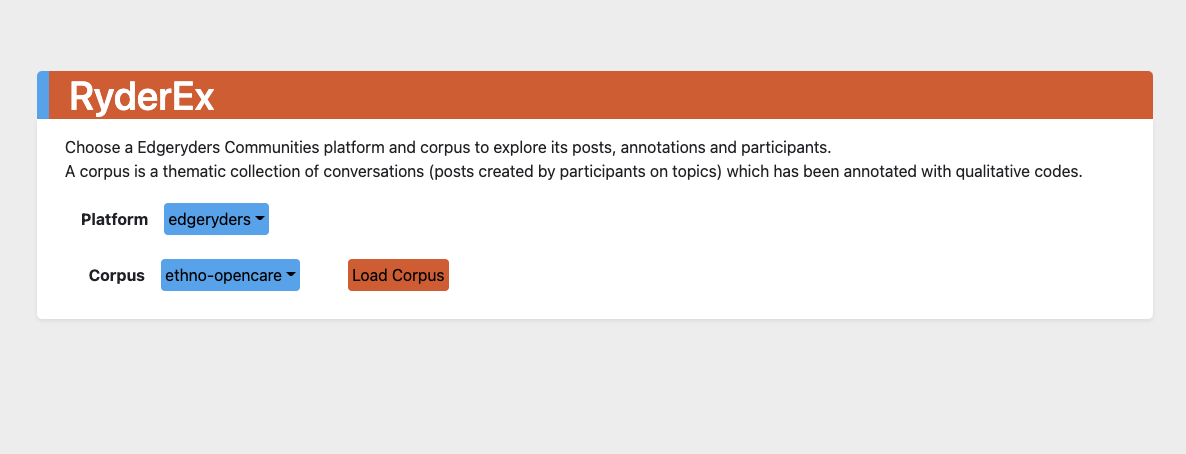
In this first case, the user has not loaded any data. When coming to RyderEx, they are first presented with a dialog to choose the platform and corpus they want to explore.
Step 1
Select the platform and the corpora you want to explore.
Step 2
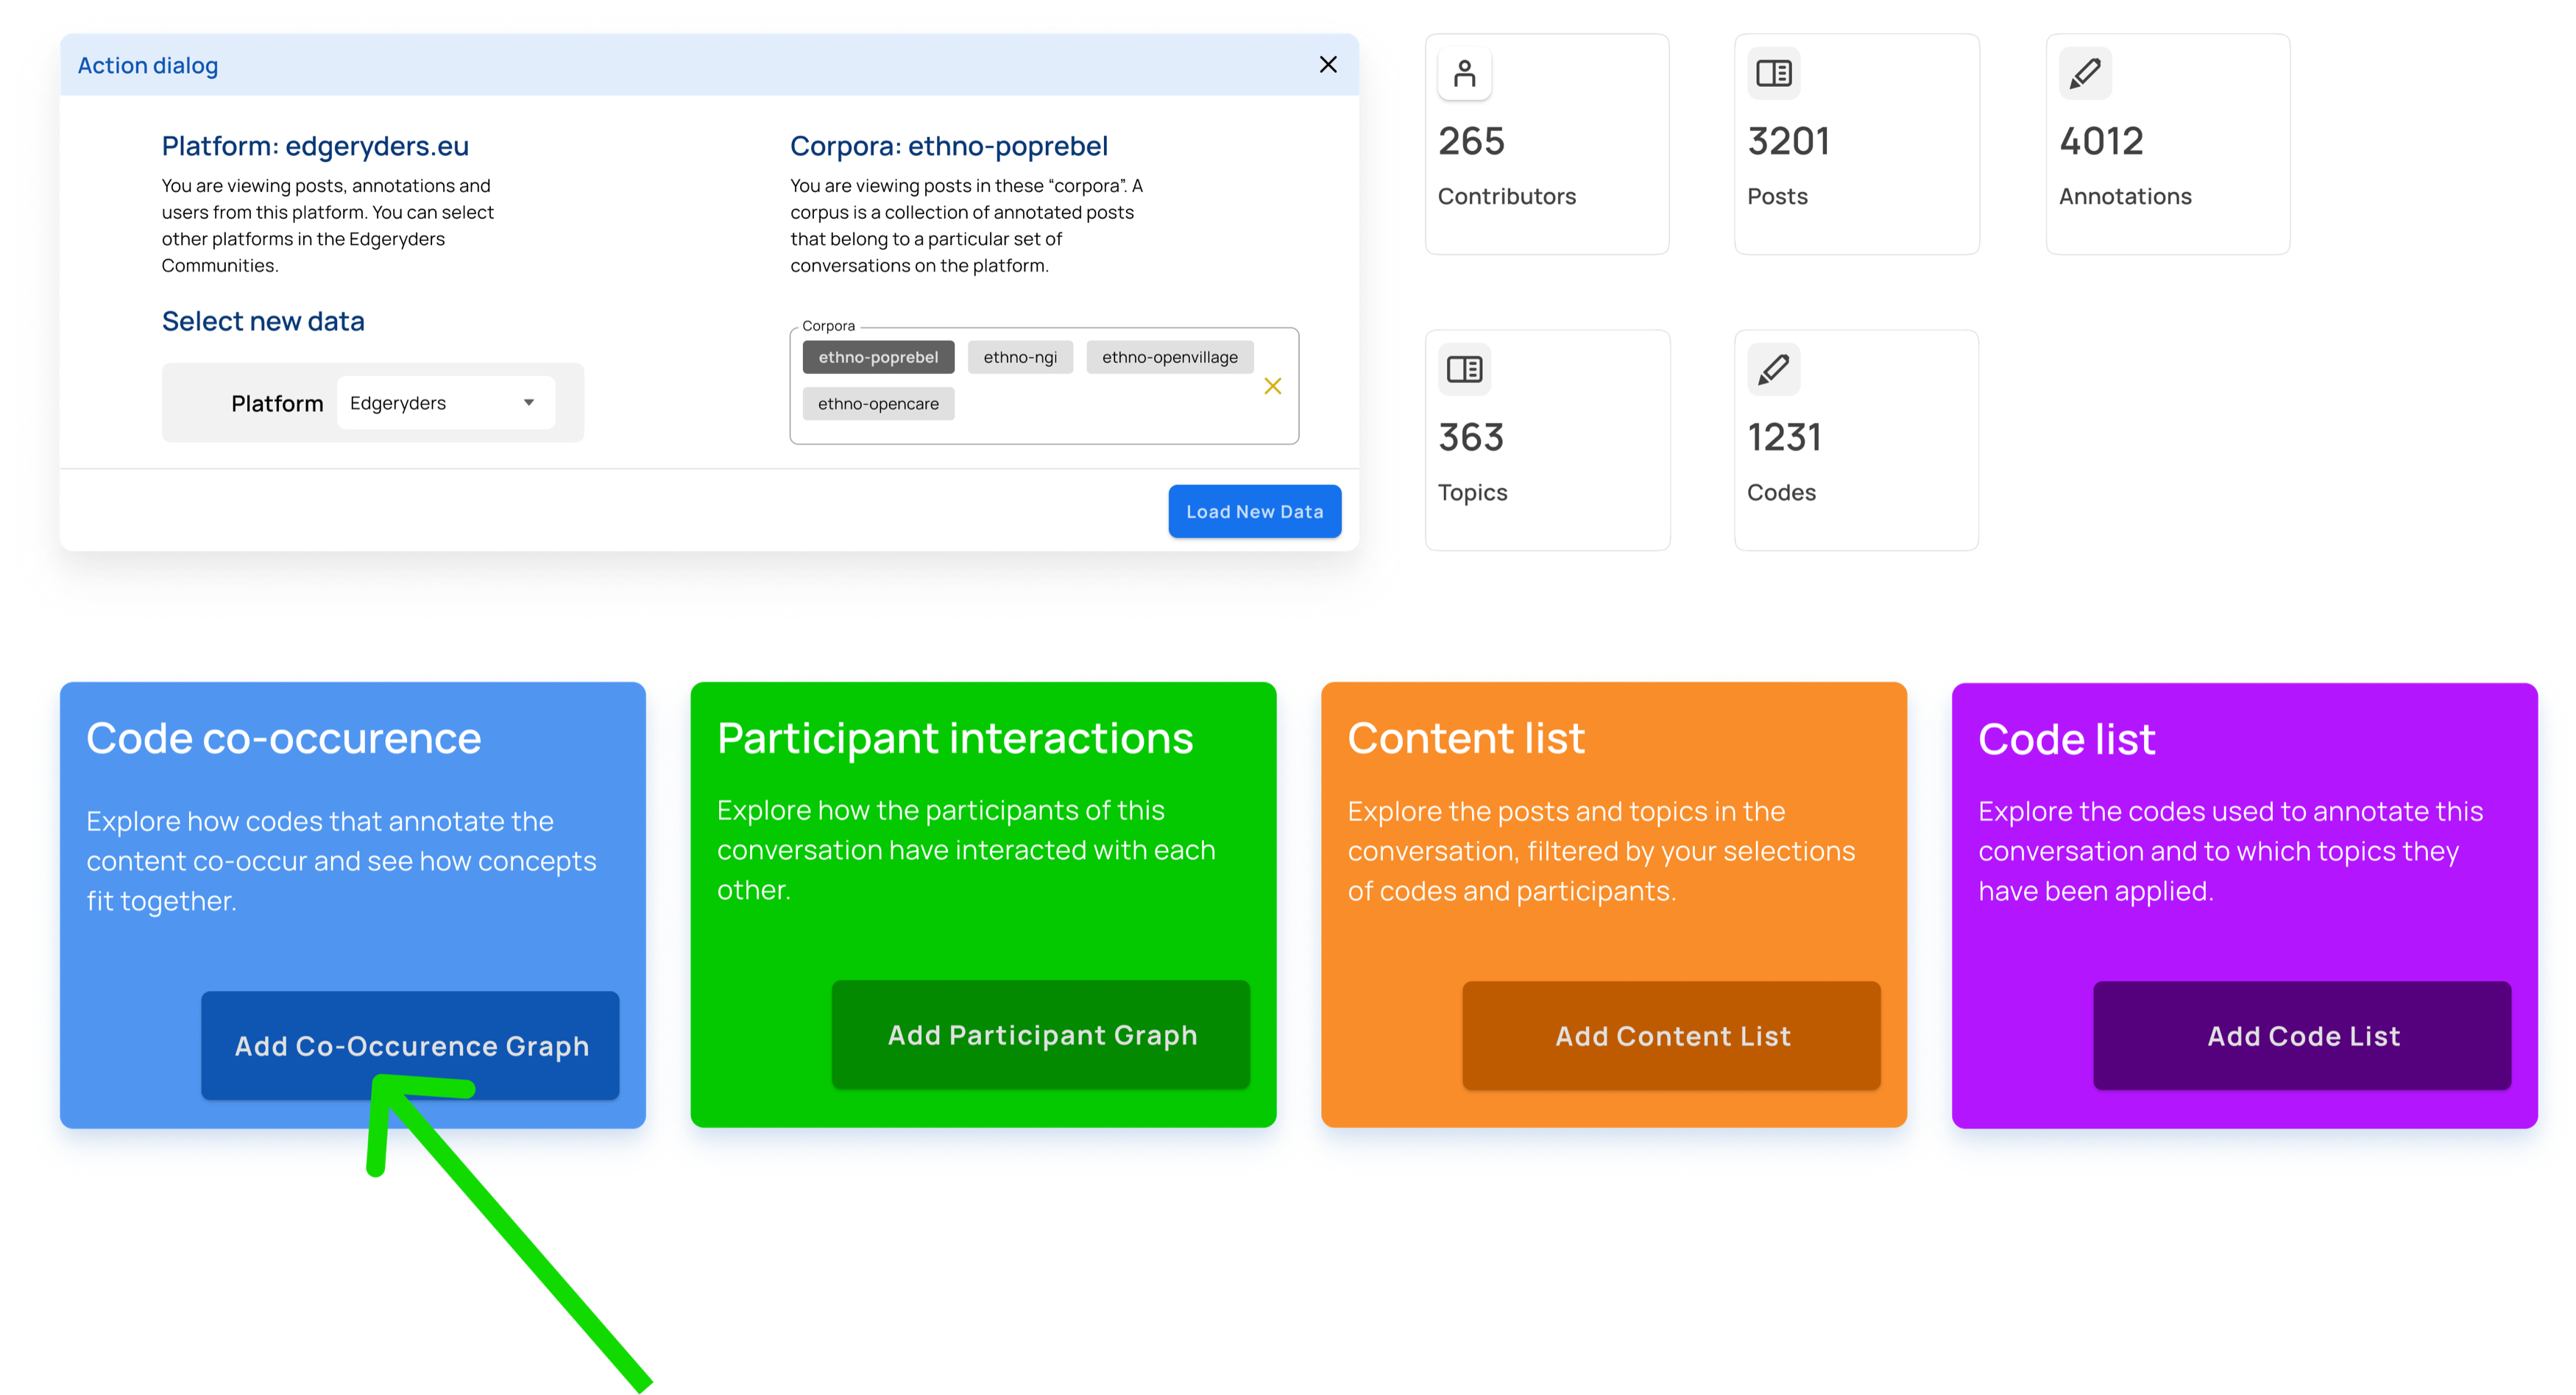
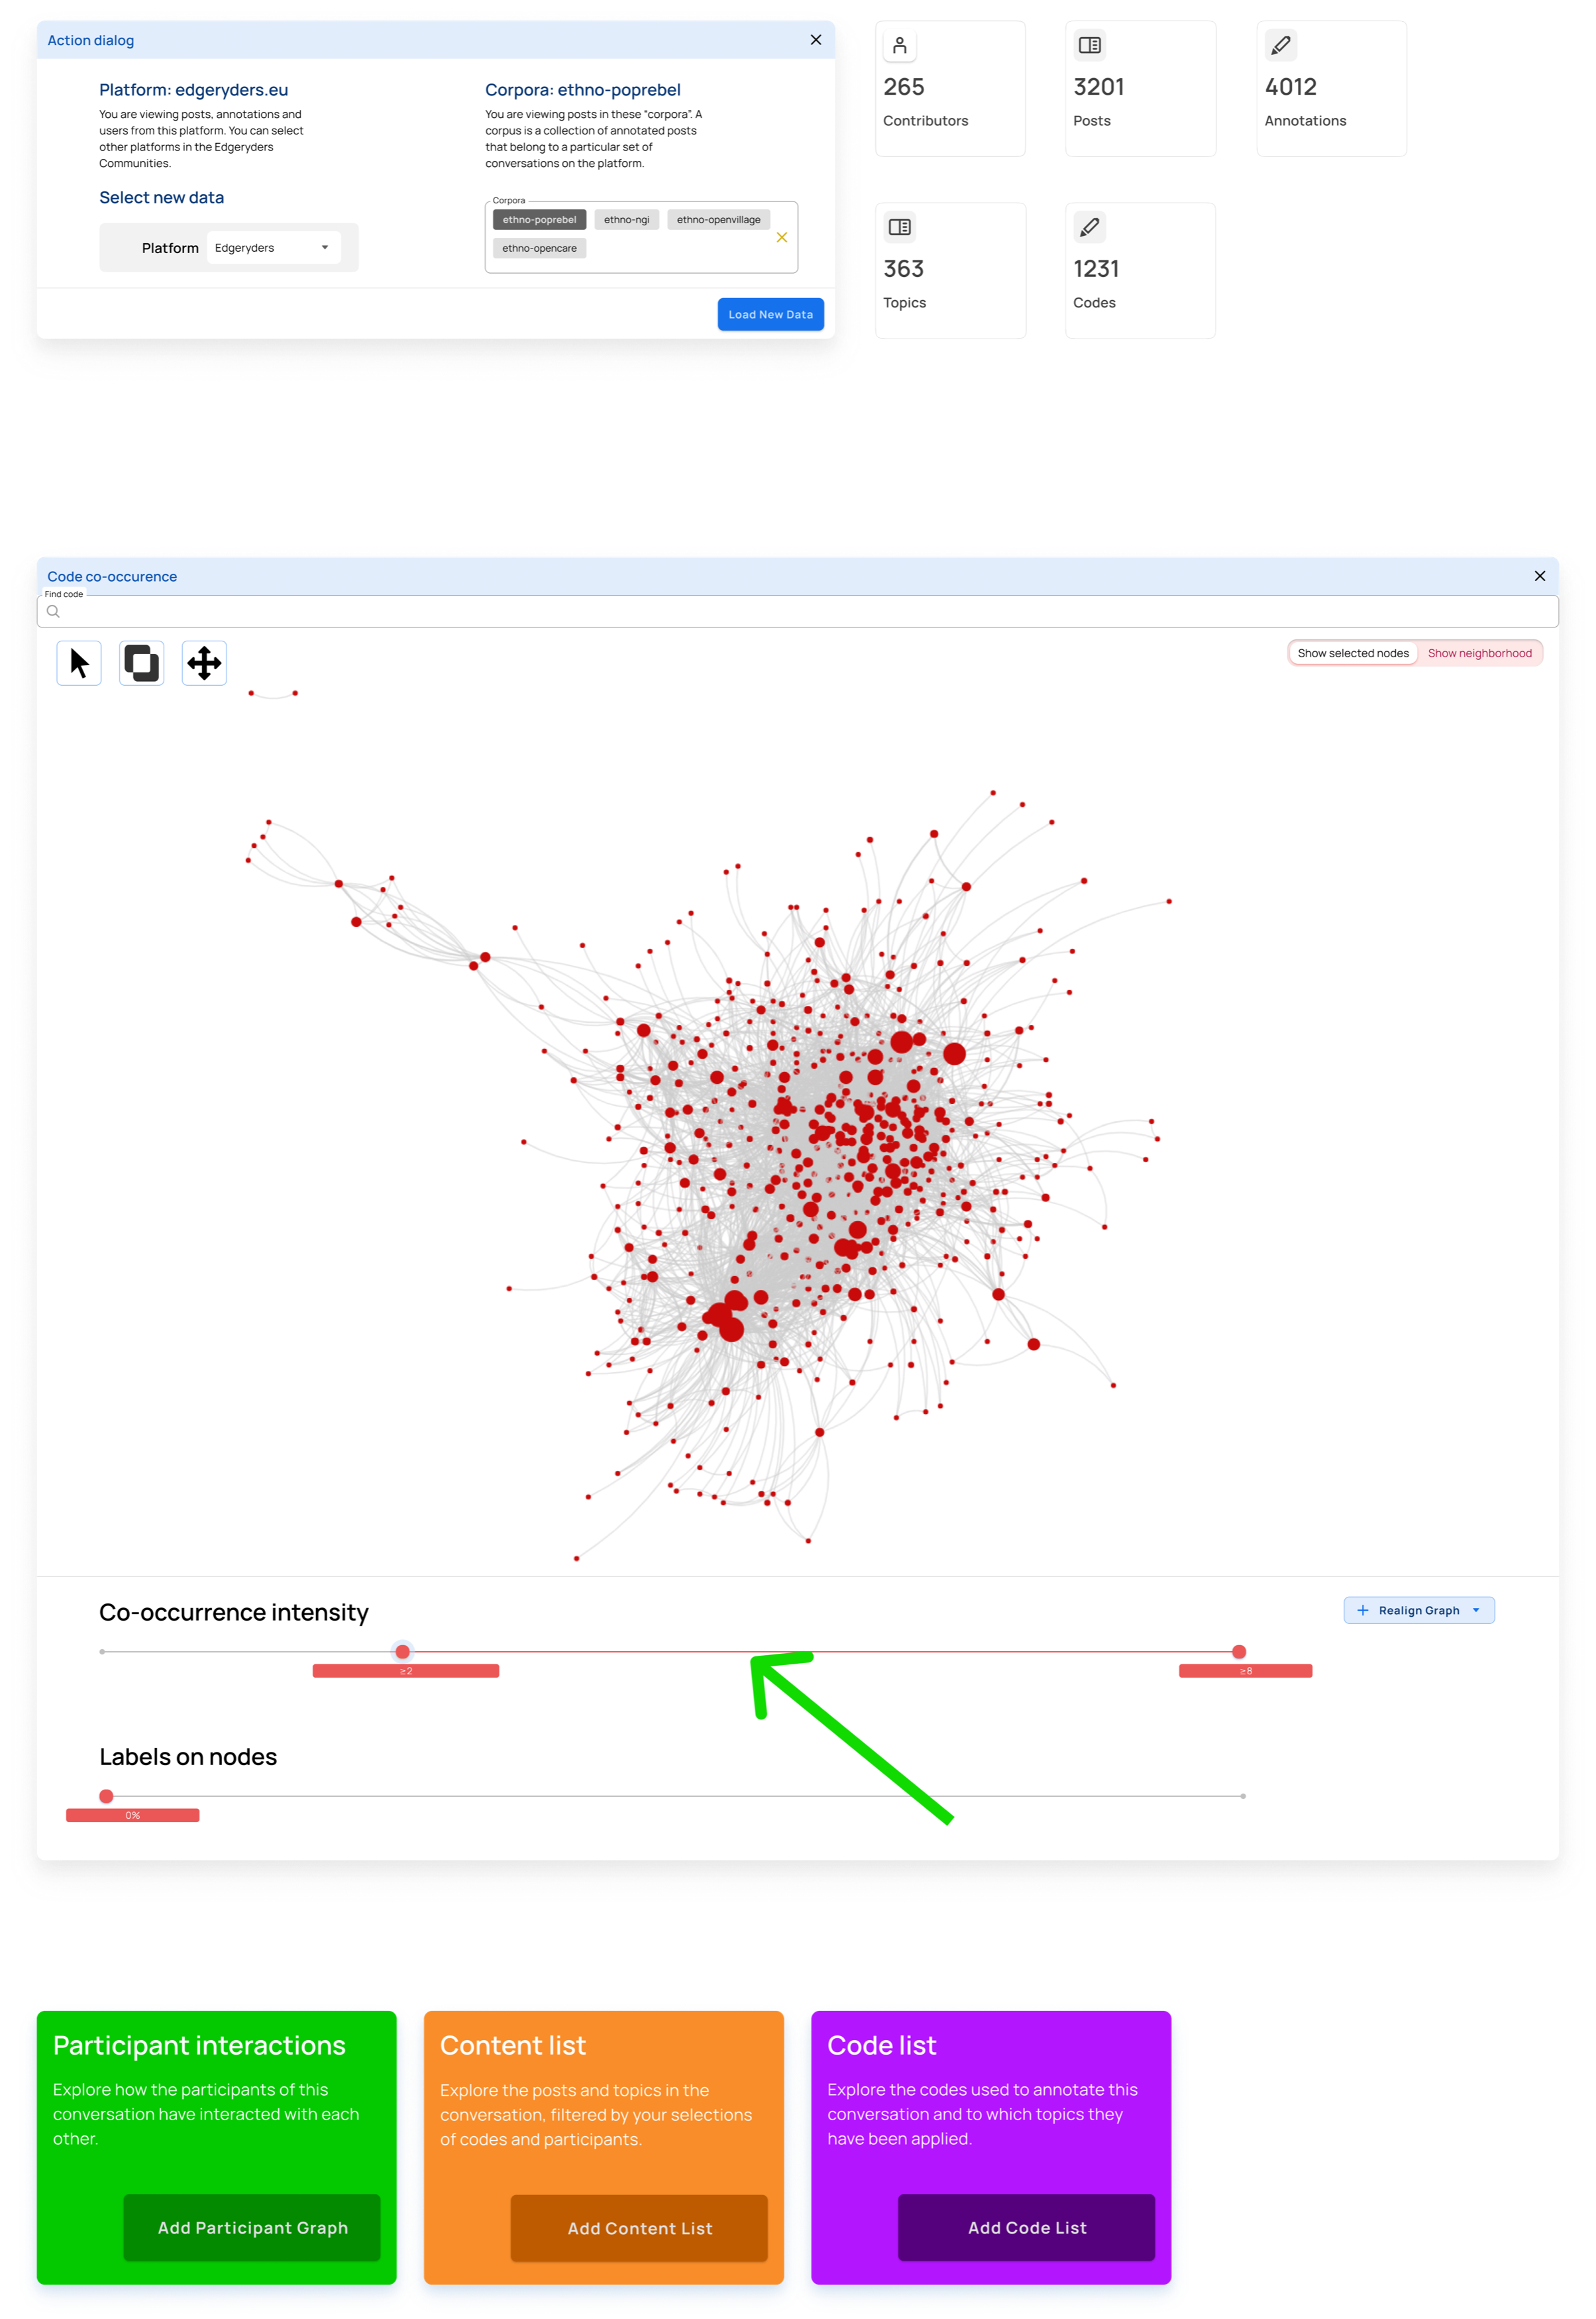
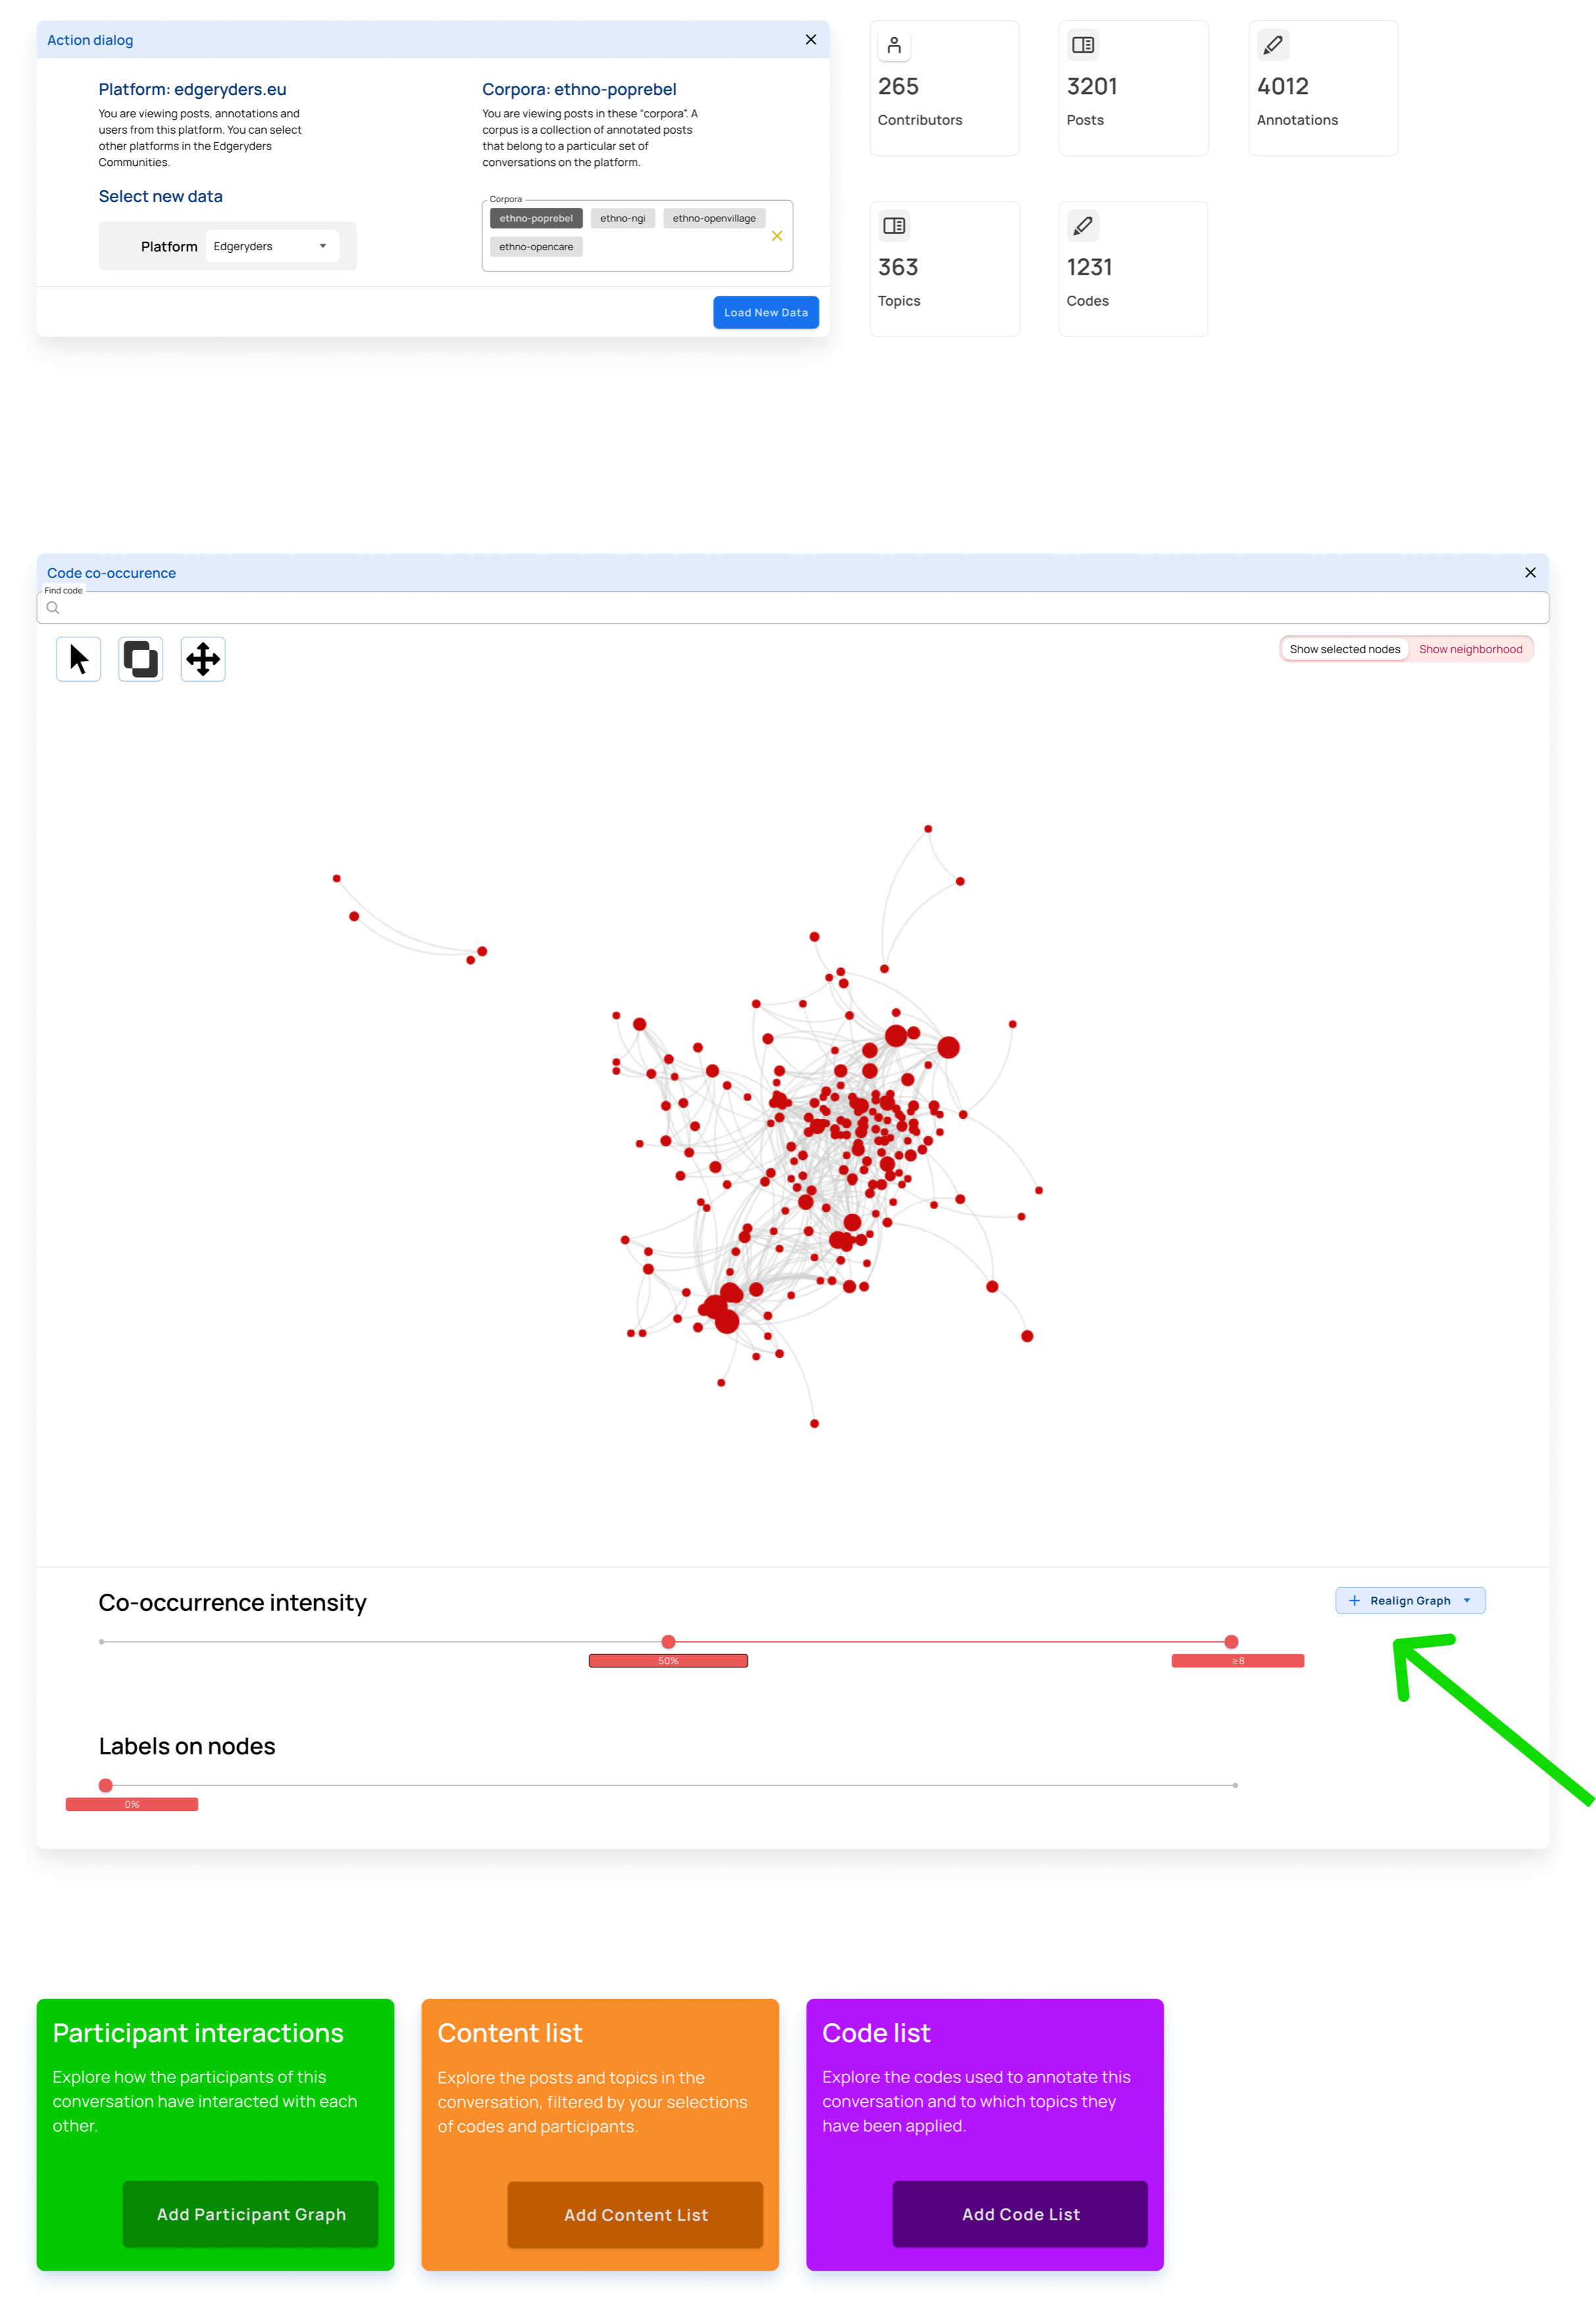
Step 3
Filter out nodes that co-occur less than 4 times
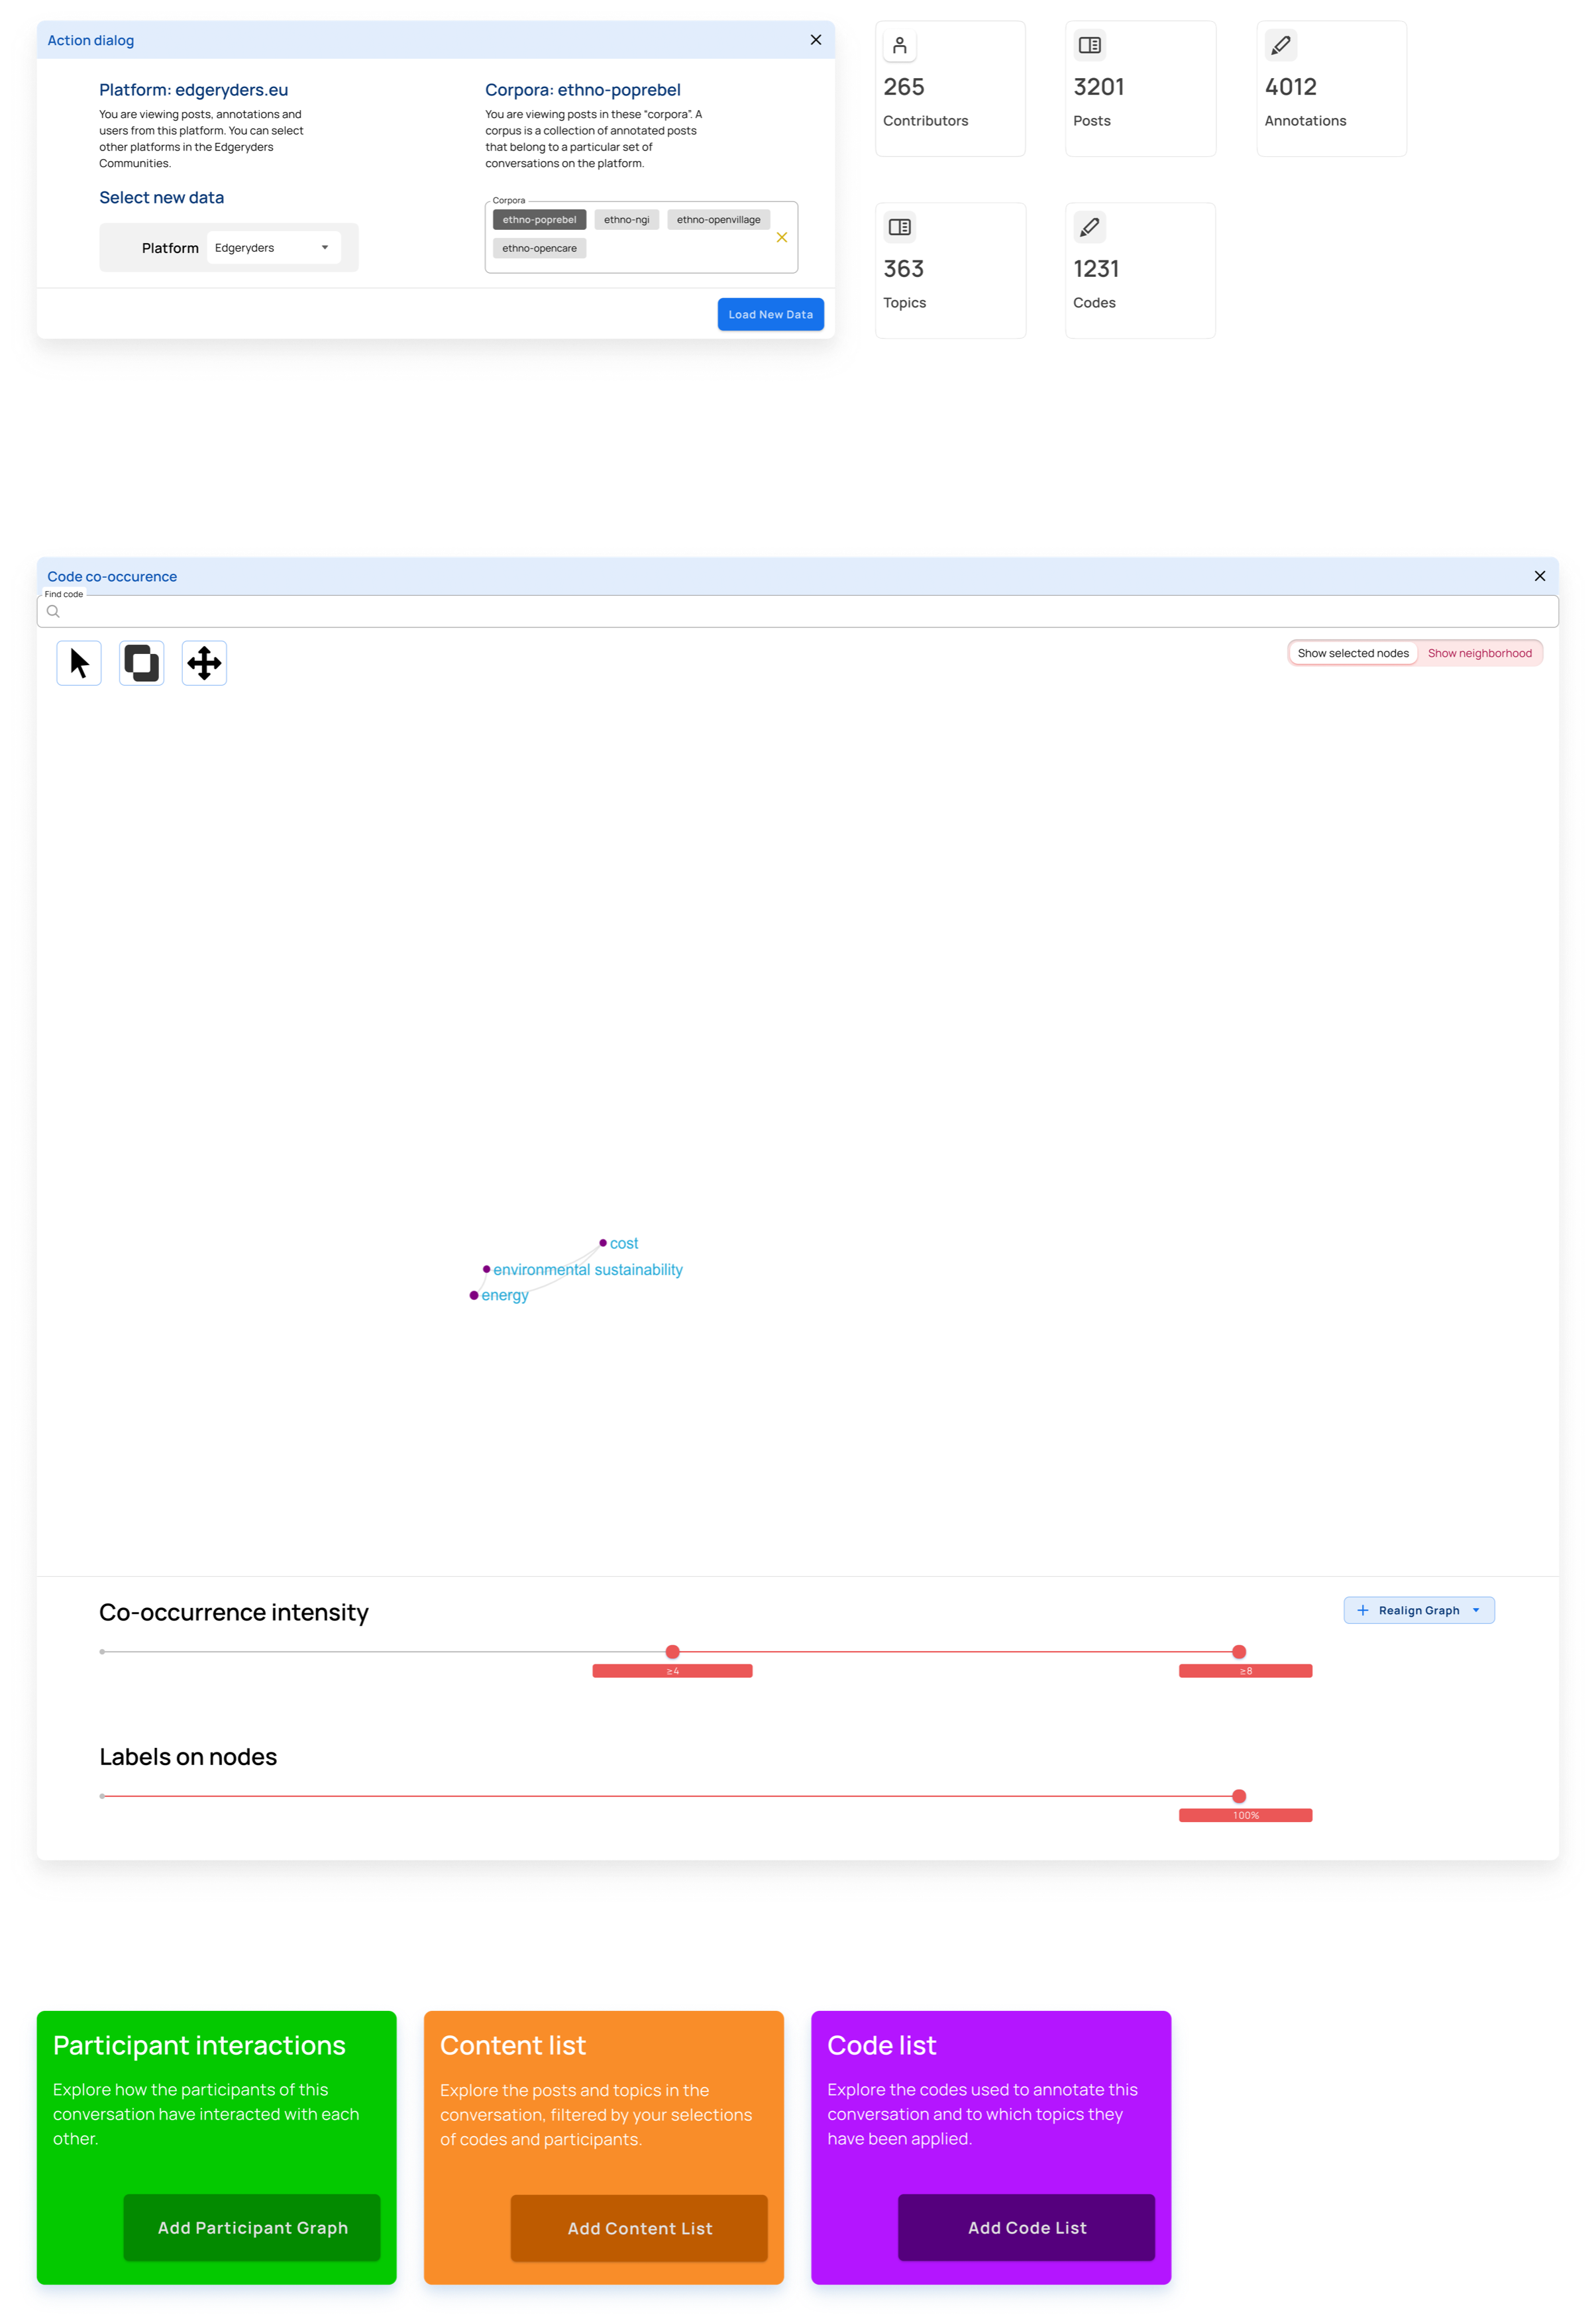
Step 4
Explode the graph to get a better overview of the visible nodes. This button should always apply the force direction algorithm on any set of visible nodes in the graph.
Step 5
Choose the select multiple nodes tool and select three nodes
NOTE: We need to work out how the actual UX works here.
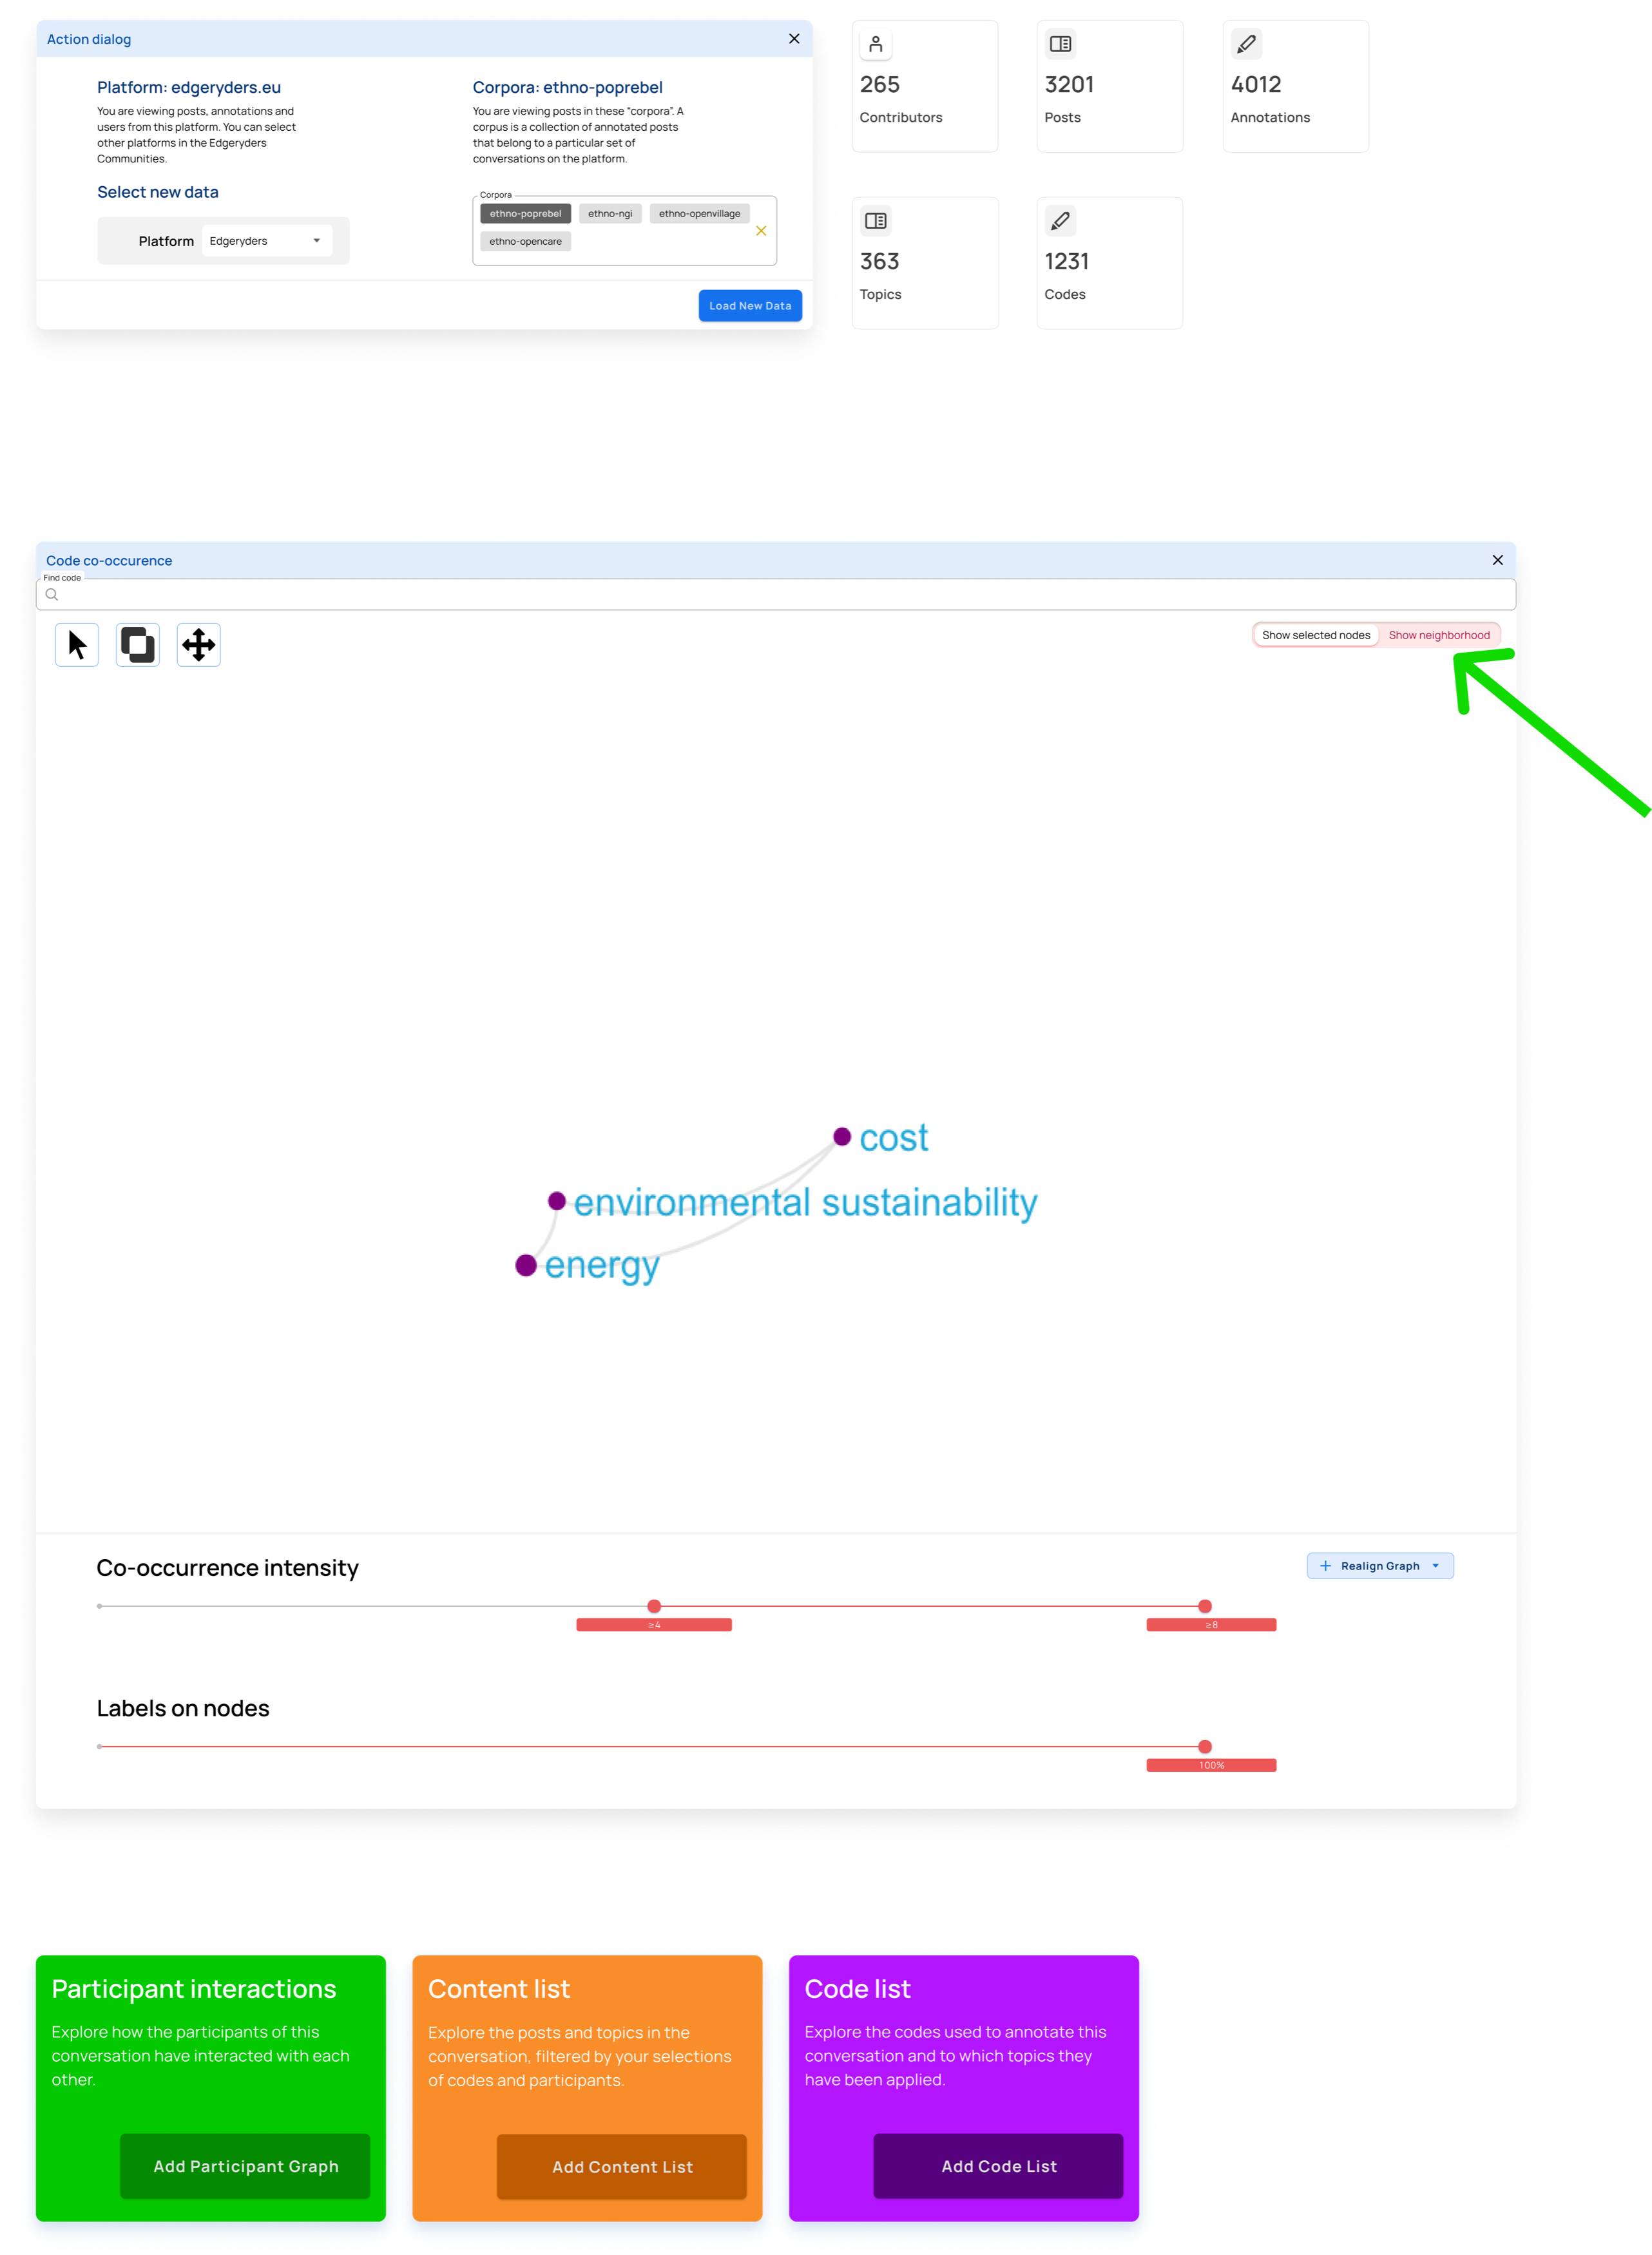
Set labels to all nodes. The label slider starts by setting labels on codes with the highest number of annotations.

Step 6
Step 7
- Zoom in on selected nodes*
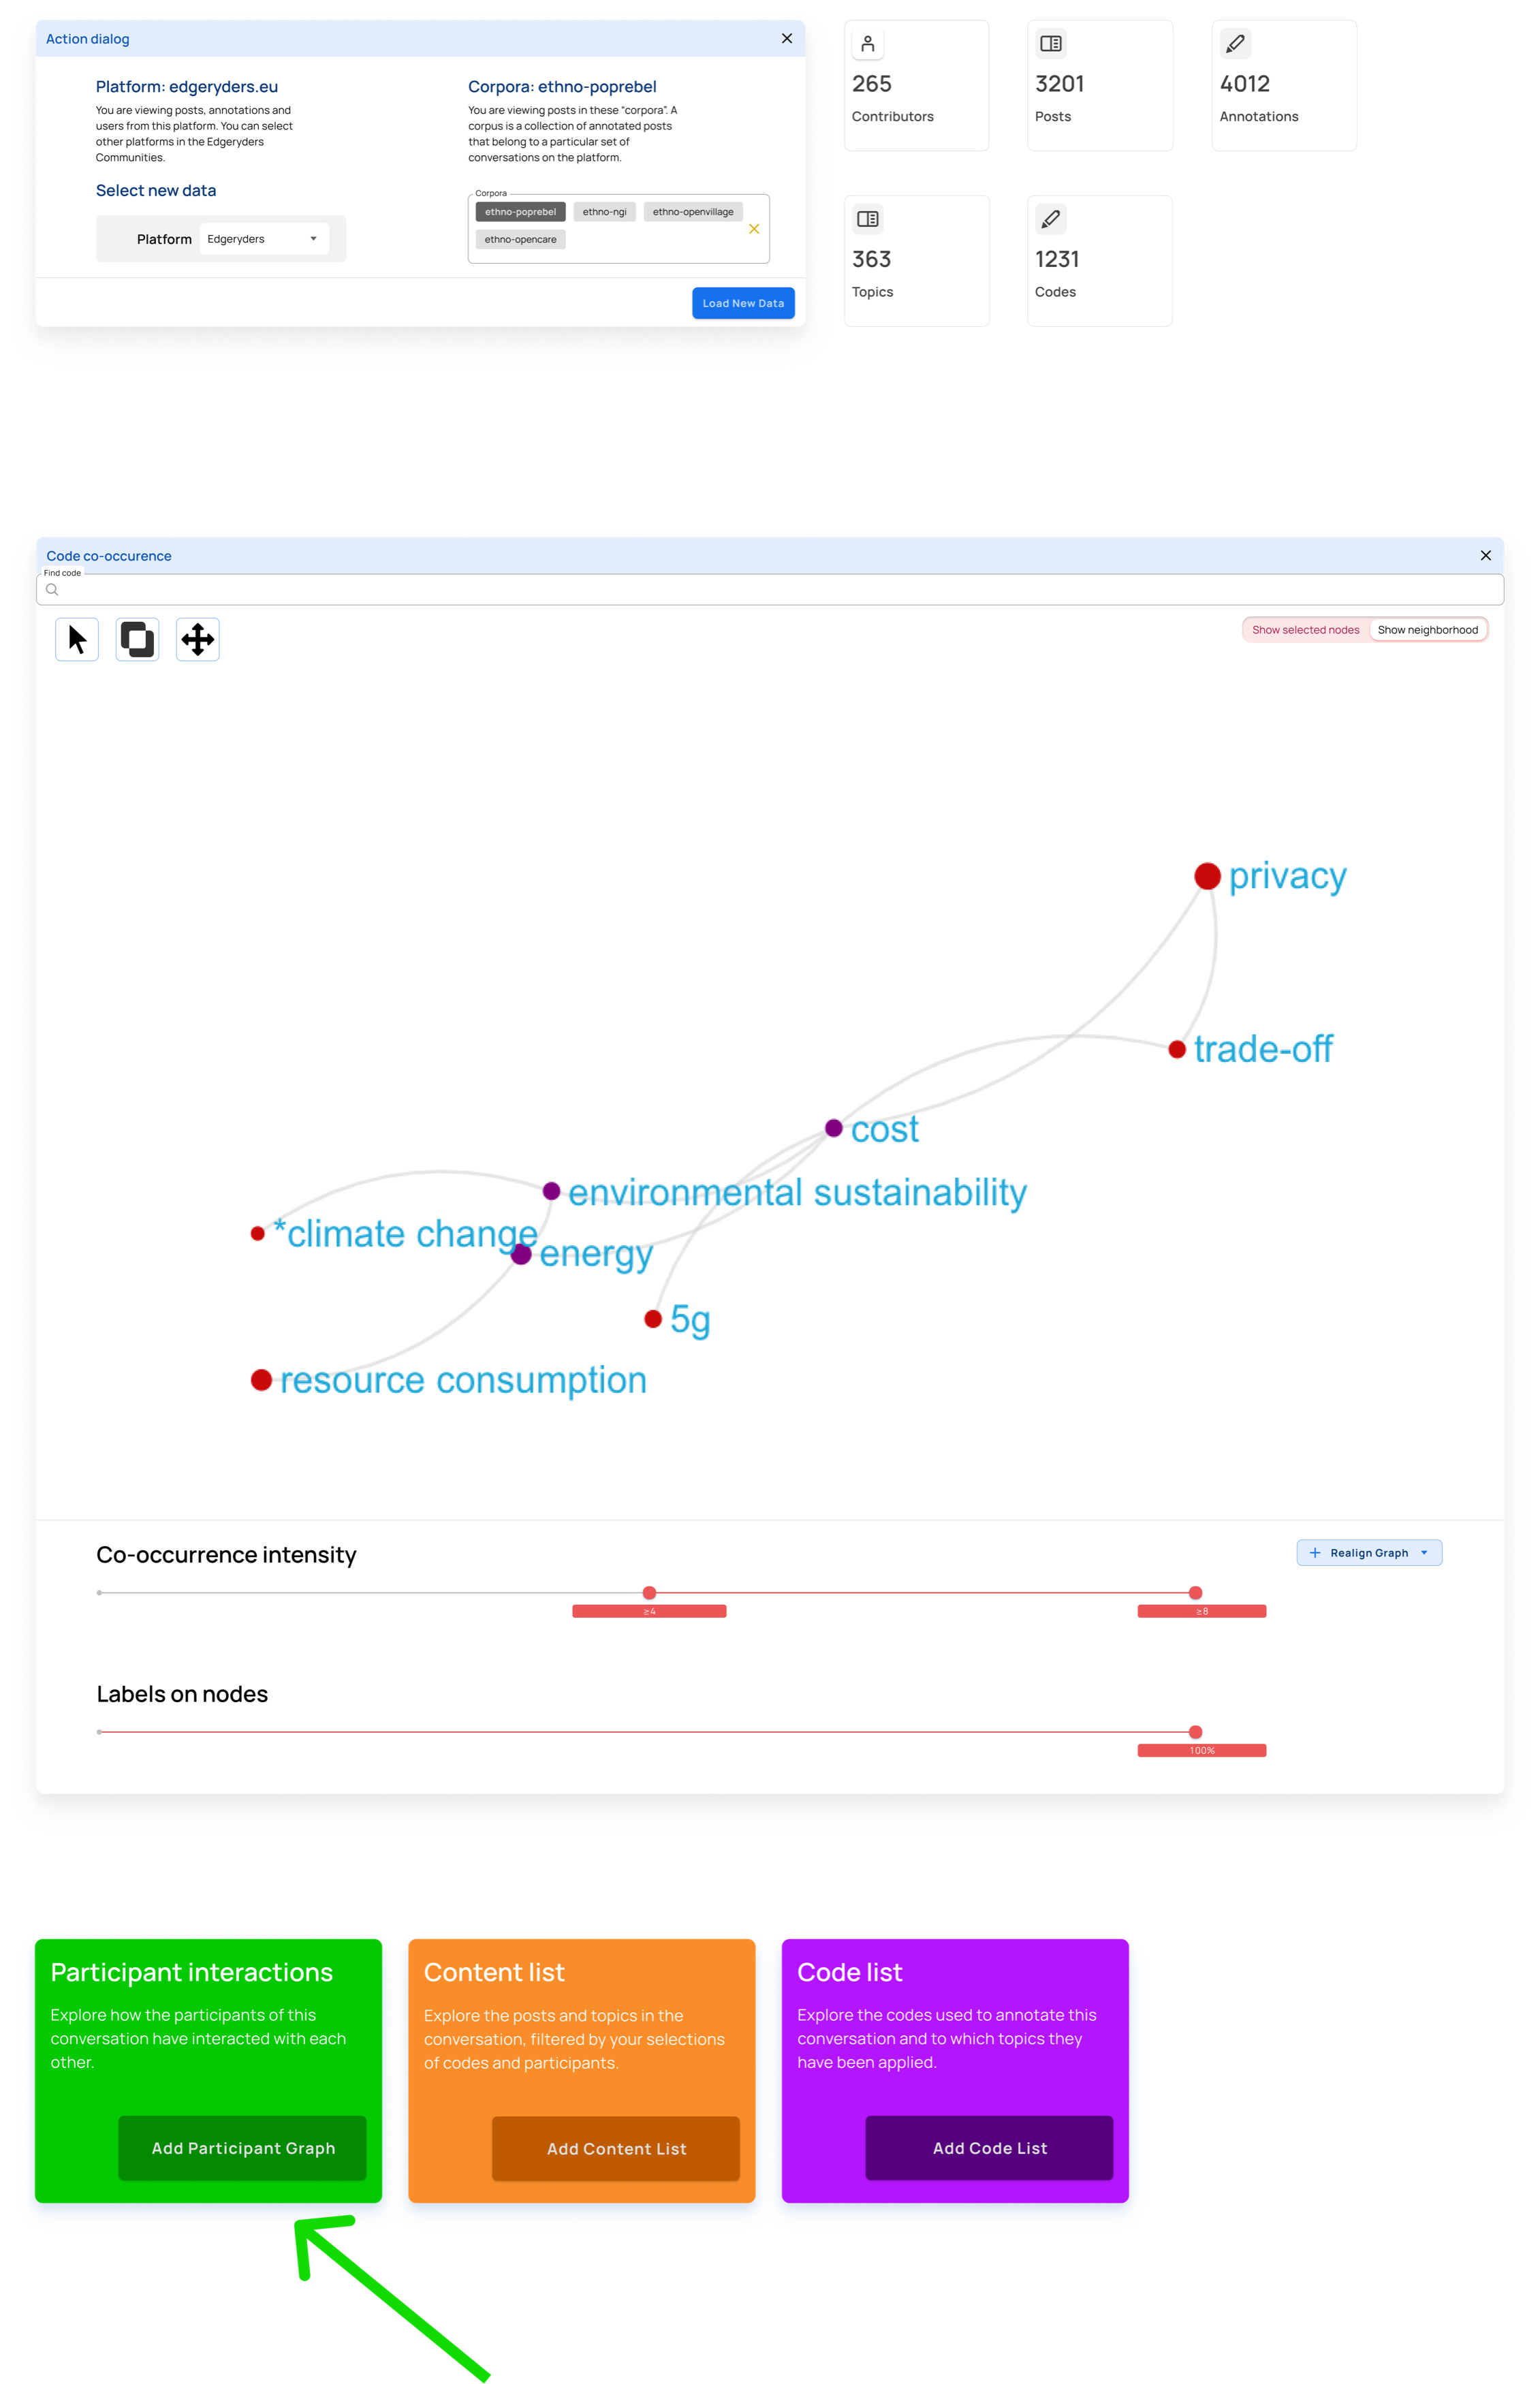
Show the neighborhood of the selected nodes to see the adjacent concepts in the conversation.
Step 8

Case 2: Isolate participants who have engaged with identified concepts
See full resolution of case 2 sketches in Figma
Why?
To understand a conversation and community, it’s not enough to know what has been talked about. You also need to know who has talked about something, and with whom. For example, you may find a strong connection (many co-occurrences) between Covid-19 and 5G, but when inspecting the participant network of the sub-conversation of posts annotated with both of those codes, you may discover that only a single participant makes that connection.
Step 1
When adding a component, it appears below the last added component.
Step 2
This graph (second graph in the image below) displays participants (users) as nodes, with an edge between them if an interaction between them exists in the filtered subset of posts. An interaction is defined as:
- User A replies to post by user B
- User A replies to a topic started by user B
https://www.dropbox.com/s/c2j2iwi244n6aai/Case%202_%20Step%202.png?dl=0
Case 3: See Posts that have been annotated with selected codes
See full resolution of case 3 sketches in Figma
Why?
Once you have found an interesting connection, you often want to explore the posts in which that connection was made. This feature is used by our researchers when writing periodic reports and by community managers looking to engage participants around specific topics.
Step 1
https://www.dropbox.com/s/1ntx4lyfykw4y4o/Case%203_%20Step%201.png?dl=0
Step 2
https://www.dropbox.com/s/42rpr6s2qo57kuc/Case%203_%20Step%202.png?dl=0
Case 4: Close views
See full resolution of case 4 sketches in Figma
Why?
We want to allow users to open and close components as they see fit, so that they can focus on exactly the question they are trying to answer without their view being cluttered.
Step 1
https://www.dropbox.com/s/xu57u3e7q3do7h1/Case%204_%20Step%201.png?dl=0
Step 2
https://www.dropbox.com/s/d20ba3pccs0i1gd/Case%204_%20Step%202.png?dl=0
Step 3
https://www.dropbox.com/s/efyb9d19cee2rvi/Case%204_%20Step%203.png?dl=0
Step 4
https://www.dropbox.com/s/0fhv0y12w583dqp/Case%204_%20Step%204.png?dl=0
Case 5: Start from participants to find topics they have engaged with
See full resolution of case 5 sketches in Figma
Why?
Community managers might want to center on a group of participants to see which conversations they are engaged in. Participants themselves may also be curious to see the code-cooccurrence graph of their own posts, or the posts of someone they are interested in reading more from. Ahead of community events or seminars that follow a long online conversation, participant breakout groups can be given a graph of the concepts they have in common before the session to act as an ice-breaker.
Step 1
https://www.dropbox.com/s/f7lkh45ia1trdrr/Case%205_%20Step%201.png?dl=0
Step 2
*Choose the multi-select tool and select a number of users. UX for how multi-select works is TBD.
https://www.dropbox.com/s/p6cq0lgx168mk05/Case%205_%20Step%202.png?dl=0
Step 3
https://www.dropbox.com/s/g9gz8ivrg21pqjf/Case%205_%20Step%203.png?dl=0
Step 4
This co-occurrence graph (second graph in the image below) shows the co-occurrence network between codes that have been applied to posts authored by either or all (should be possible to switch between AND or OR) of the participants selected in the graph above.
https://www.dropbox.com/s/5ez3201d8to1151/Case%205_%20Step%204.png?dl=0
Case 6: Show filtered codes in a list
See full resolution of case 6 sketches in Figma
Why?
Most of the codes applied have more information attached to them, like a definition and the number of times they have been applied in total. It can often be useful for the researchers to see a table of the codes that pertain to a particular co-occurrence graph or list of posts.
Step 1
https://www.dropbox.com/s/f64jf2aapms6o71/Case%206_%20Step%201.png?dl=0
Step 2
This is a list overview of the codes that are shown in the graph above, which displays more details about the codes in a list.
https://www.dropbox.com/s/nmuhgc1qzy8zrip/Case%206_%20Step%202.png?dl=0
Case 7: Show posts annotated with selected codes in a list
See full resolution of case 6 sketches in Figma
Why?
Sometimes it may be a lot easier to filter out codes through selecting them in a list than to find and select them in a graph. A researcher may want to do this in order to look at only posts that have been annotated with a subset of the codes that are currently visible in the co-occurrence graph.
Step 1
https://www.dropbox.com/s/whlvsp4febp96dy/Case%207_%20Step%201.png?dl=0
Step 2
https://www.dropbox.com/s/sussw8xmxhiynfv/Case%207_%20Step%202.png?dl=0
Step 3
https://www.dropbox.com/s/g5qbpxyzry82zcc/Case%207_%20Step%203.png?dl=0
2 Likes
I personally love it. Your use cases make complete sense to me. Case 7 would be the standard “quotation manager” in ethno software like Atlas.Ti.
I recall us talking about using Google Analytics to count both page views javascript actions. This gives precious indications, because you can see which feature people use and which ones they don’t, and from that infer what the dashboard is actually used for. This is what we did for Edgesense (between iterations), and results were quite surprising to the designers. Did we end up doing that?
1 Like
I don’t think we did - at least the dashboards we have now are not linked to any analytics.
For reference in preparation for development, here is an example cypher query for calculating the co-occurrence network of a set of posts.
In this example, we connect to the ryderex neo4j database which contains data from all our platforms and corpora, select the “ethno-bbu” corpus on the bbu.world platform, get posts by three users, and display the co-occurrence network at c=>3 of codes that annotate at least one of those posts.
MATCH (posts:post)-[:ON_PLATFORM]->(platform:platform {url: 'https://bbu.world'})
MATCH (posts)-[:IN_TOPIC]->()-[:TAGGED_WITH]->(corpus:corpus {name: 'ethno-bbu'})
MATCH (posts)<-[:CREATED]-(u:user) WHERE u.username IN ['kerak', 'player1', 'fel']
MATCH (posts)<-[:ANNOTATES]-()-[:REFERS_TO]-(code)
MATCH (code)-[cr:COOCCURS]->(code2)
WHERE cr.count >= 3 AND cr.corpus = 'ethno-bbu'
WITH DISTINCT cr AS cooccur, code, code2
RETURN DISTINCT code.name, code2.name, cooccur.count ORDER BY cooccur.count DESC
Example from results
| code1 | code2 | cooccur.count | corpus |
|---|---|---|---|
| “pandemic” | “coronavirus” | 10 | “ethno-bbu” |
| “breakup” | “Memories” | 9 | “ethno-bbu” |
| “Mother” | “self-reflection” | 8 | “ethno-bbu” |
| “sanitize” | “pandemic” | 8 | “ethno-bbu” |
| “fear” | “Mother” | 8 | “ethno-bbu” |
| etc … |
@nadia, we need a new logo for the next generation of Graphryder. Do you want to design one?  Or work with someone to do it?
sure. Round or square or other?
Preferably a vector graphic on a transparent background that is simple enough to be recognizable even when it’s only 50x50 px but still looks good at 300x300 px.
I’m thinking that we want three variants:
- Text only
- Logo only
- Logo + text
Sort of like the Blivande logos have three variants.
Text only
![]()
Logo only

Logo + text

ok when do you need it by?
1 Like
No rush. A month?

We are still ironing out some bugs, but the first experimental version of RyderEx is just about ready to test. This is how far we have been able to get on the current budget. Explaining what RyderEx does is easier if I show it, so I have recorded a series of videos of me running through a demo.
Search, scoping, and participant interaction graph
… And one more thing (state saved in URL)
Play with the OpenCare graph here (loading it for the first time can be quite slow, we are working on that)
Things RyderEx does not do yet:
- Ego network views
- Edge click to explore content related to specific co-occurrence edge
- Hide all nodes that are not contributing to scope in a given graph
Planned improvements:
- Language improvements (mistranslations, grammar, etc)
- More beautiful UI
- More intuitive labels control
Known bugs:
- Links to platform content and user profiles missing
Things RyderEx will probably never do:
- Curved edges. We have gotten used to the nice curved edges of Graphryder, but it turns out that those are very inefficient to draw when calculating a graph on the fly, so the new version of Sigma does not support them.
2 Likes
Wooow!!! Can’t wait to sink my teeth into it. Thanks, great work!
I am in Italy: not much time and so-so Internet at my mother’s place. Might have to wait until next week, but I’m really happy. 
1 Like
So, I re-watched all the videos, and played around a bit with the demo installation. Solid work, really. I especially like the search function (finally!) and the possibility to add entities to the scope via lists. Also that feature that allows to save the state in the URL, though we will need good documentation to explain what defines “the state”.
We do not necessarily need that in the same form. If you can make an interactor which selects the neighbors of a given node (your “poor man’s ego network”), then those could be put into a scope, and sorting the codes list by scope would put the ego network on the top.
Yes, this would be nice.
1 Like